Learn how to execute a SQL query to access polygon features from a feature layer.
A feature layer can contain a large number of features stored in ArcGIS. To access a subset of the features, you can execute a SQL or spatial query, or both at the same time. You can also return the attributes, geometry, or both attributes and geometry for each record. SQL and spatial queries are useful when a feature layer is very large and you just want to access a subset of the data.
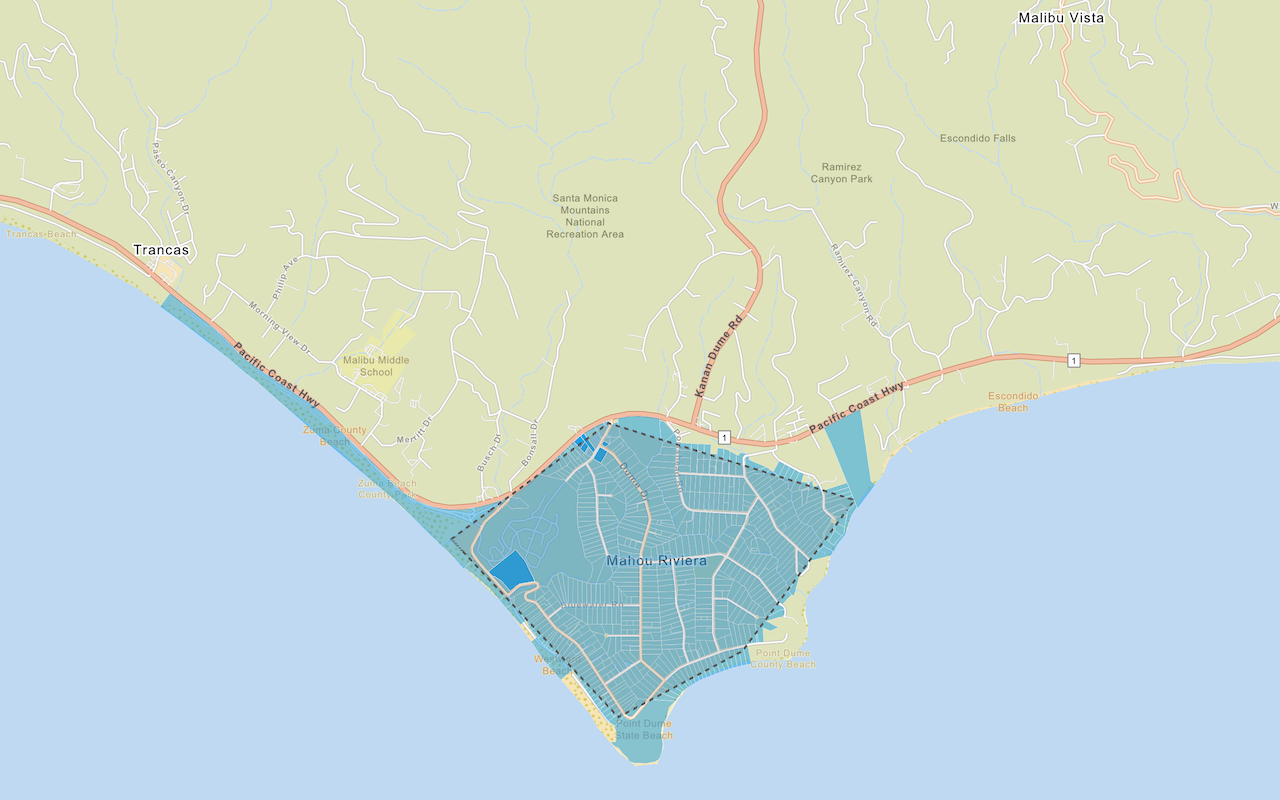
In this tutorial, you perform server-side SQL queries to return a subset of the features from the LA County Parcel hosted feature layer. The feature layer contains over 2.4 million features. The resulting features are displayed as graphics on the map. A pop-up is also used to display feature attributes.
Prerequisites
You need an ArcGIS Developer or ArcGIS Online account to access the developer dashboard and create an API key.
Steps
Create a new pen
- To get started, either complete the Display a map tutorial or .
Set the API key
To access location services, you need an API key or OAuth 2.0 access token. To learn how to create and scope your key, visit the Create an API key tutorial.
-
Go to your dashboard to get an API key. The API key must be scoped to access the services used in this tutorial.
-
In CodePen, update
apito use your key.Key Use dark colors for code blocks const apiKey = "YOUR_API_KEY"; const basemapEnum = "arcgis/streets"; const map = new maplibregl.Map({ container: "map", // the id of the div element style: `https://basemapstyles-api.arcgis.com/arcgis/rest/services/styles/v2/styles/${basemapEnum}?token=${apiKey}`, zoom: 12, // starting zoom center: [-118.805, 34.027] // starting location [longitude, latitude] });
Add API references
This tutorial uses ArcGIS REST JS to query the feature layer.
- In the
<head>element, add references to the ArcGIS REST JS library.
<script src=https://unpkg.com/maplibre-gl@3.2.1/dist/maplibre-gl.js></script>
<link href=https://unpkg.com/maplibre-gl@3.2.1/dist/maplibre-gl.css rel="stylesheet" />
<script src="https://unpkg.com/@esri/arcgis-rest-request@4.0.0/dist/bundled/request.umd.js"></script>
<script src="https://unpkg.com/@esri/arcgis-rest-feature-service@4.0.0/dist/bundled/feature-service.umd.js"></script>
<style>
html,
body,
#map {
padding: 0;
margin: 0;
height: 100%;
width: 100%;
font-family: Arial, Helvetica, sans-serif;
font-size: 14px;
color: #323232;
}
</style>
</head>
Create a SQL selector
Hosted feature layers support a standard SQL query where clause. Use an HTML <select> element to provide a list of SQL queries for the LA County Parcel feature layer.
To add the <select> HTML element as a Map control, you create an object that implements the MapLibre GL JS IControl interface.
Creating an IControl allows MapLibre GL JS to position it, which prevents your control overlapping other MapLibre GL JS controls.
-
Create a
Queryclass with anControl ofunction. Inside, create an Add <div>element with a<select>inside, with options for each of the SQLwhereclauses. Return this element.Use dark colors for code blocks const map = new maplibregl.Map({ container: "map", // the id of the div element style: `https://basemapstyles-api.arcgis.com/arcgis/rest/services/styles/v2/styles/${basemapEnum}?token=${apiKey}`, zoom: 12, // starting zoom center: [-118.80543, 34.03] // starting location [longitude, latitude] }); class QueryControl { onAdd(map) { const template = document.createElement("template"); template.innerHTML = `<div class="maplibregl-ctrl maplibregl-ctrl-group" style="margin:20px;"> <select style="font-size:16px; padding:4px 8px;"> <option value="">Choose a WHERE clause...</option> <option>UseType = 'Residential'</option> <option>UseType = 'Government'</option> <option>UseType = 'Irrigated Farm'</option> <option>TaxRateArea = 10853</option> <option>TaxRateArea = 10860</option> <option>TaxRateArea = 08637</option> <option>Roll_LandValue > 1000000</option> <option>Roll_LandValue < 1000000</option> </select> </div>`; return template.content; } } -
Create a
Queryand add it to the Map withControl map.add.Control Use dark colors for code blocks return template.content; } } const queryControl = new QueryControl(); map.addControl(queryControl);
Add parcel layer
Parcels returned by the query are simple GeoJSON polygons. You can display them with a GeoJSON source and a fill layer.
-
Create an
addfunction. Inside, add a GeoJSON source and a fill layer. Add the layer before the first symbol layer.Parcel Layer By inserting the polygon layer beneath the icon and text layers, it keeps the labels readable. In MapLibre GL JS, there is no distinction between "basemap" layers and "overlay layers", so you can insert the layer anywhere.
To determine the first symbol layer, you can use
map.getto get the style, then iterate to find the first layer whoseStyle typeissymbol.See the MapLibre GL JS documentation for details.
Use dark colors for code blocks const queryControl = new QueryControl(); map.addControl(queryControl); function addParcelLayer() { map.addSource("parcels", { type: "geojson", data: { type: "FeatureCollection", features: [] } }); const firstSymbolLayer = map.getStyle().layers.find((l) => l.type === "symbol"); map.addLayer( { id: "parcels-fill", source: "parcels", type: "fill", paint: { "fill-color": "hsla(200, 80%,50%, 0.5)", "fill-outline-color": "hsl(360, 100%, 100%)" } }, firstSymbolLayer.id ); // insert new layer before this one map.addLayer({ id: "parcels-line", source: "parcels", type: "line", paint: { "line-width": 0.5, "line-color": "hsl(360, 100%,100%)" } }); // set outline style for parcels }
Add load handler
To add layers to the map, you need to use the load event to ensure the map is fully loaded.
-
Add an event handler for the
loadevent. Inside, calladd.Parcel Layer Use dark colors for code blocks const firstSymbolLayer = map.getStyle().layers.find((l) => l.type === "symbol"); map.addLayer( { id: "parcels-fill", source: "parcels", type: "fill", paint: { "fill-color": "hsla(200, 80%,50%, 0.5)", "fill-outline-color": "hsl(360, 100%, 100%)" } }, firstSymbolLayer.id ); // insert new layer before this one map.addLayer({ id: "parcels-line", source: "parcels", type: "line", paint: { "line-width": 0.5, "line-color": "hsl(360, 100%,100%)" } }); // set outline style for parcels } map.on("load", () => { addParcelLayer(); });
Execute the query
Use the ArcGIS REST JS queryFeatures method to find features in the LA County Parcels feature layer that match the selected where clause.
To limit the query results to the visible extent of the Map, you can set the queryFeatures geometry property. To do so, use map.get to get the extent of the Map viewport, and then convert it to the required esri format of [minx, miny, maxx, maxy]. This confines the SQL query to the geographic bounds (extent) of the map.
When the matching parcels are returned, call set on the parcels source to display them.
-
Create a function called
executewithQuery whereandClause geometryparameters. Inside, create a newarcgisto access the feature service. CallRest.Api K e y Manager arcgis. Pass theRest.query Features geometryandgeometry. Specify GeoJSON as the return type, requestingType returnand specificGeometry out. All of the features within the geometry will be returned with attribute information set by theFields outproperty.Fields There are many other spatial relationships that you can specify with
spatial. For example, you can useRel esrito only return parcels completely within the viewport. See the ArcGIS services reference for details.Spatial R e l Contains Use dark colors for code blocks function executeQuery(whereClause, geometry) { arcgisRest .queryFeatures({ url: "https://services3.arcgis.com/GVgbJbqm8hXASVYi/arcgis/rest/services/LA_County_Parcels/FeatureServer/0", geometry: geometry, geometryType: "esriGeometryEnvelope", inSR: 4326, // EPSG:4326 uses latitudes and longitudes spatialRel: "esriSpatialRelIntersects", where: whereClause, f: "geojson", returnGeometry: true, outFields: ["APN", "UseType", "TaxRateCity", " Roll_LandValue"] }) } -
Add a response handler. Inside, set the returned parcels as the data for the parcels source.
Use dark colors for code blocks arcgisRest .queryFeatures({ url: "https://services3.arcgis.com/GVgbJbqm8hXASVYi/arcgis/rest/services/LA_County_Parcels/FeatureServer/0", geometry: geometry, geometryType: "esriGeometryEnvelope", inSR: 4326, // EPSG:4326 uses latitudes and longitudes spatialRel: "esriSpatialRelIntersects", where: whereClause, f: "geojson", returnGeometry: true, outFields: ["APN", "UseType", "TaxRateCity", " Roll_LandValue"] }) .then((response) => { map.getSource("parcels").setData(response); }); -
Update your
Queryto add aControl changeevent handler to theselectelement. Inside, calculate the viewport extent and callexecutewith the extent andQuery whereclause.Use dark colors for code blocks class QueryControl { onAdd(map) { const template = document.createElement("template"); template.innerHTML = `<div class="maplibregl-ctrl maplibregl-ctrl-group" style="margin:20px;"> <select style="font-size:16px; padding:4px 8px;"> <option value="">Choose a WHERE clause...</option> <option>UseType = 'Residential'</option> <option>UseType = 'Government'</option> <option>UseType = 'Irrigated Farm'</option> <option>TaxRateArea = 10853</option> <option>TaxRateArea = 10860</option> <option>TaxRateArea = 08637</option> <option>Roll_LandValue > 1000000</option> <option>Roll_LandValue < 1000000</option> </select> </div>`; const select = template.content.querySelector("select"); select.addEventListener("change", () => { // Do nothing for the "Choose a WHERE clause..." option if (select.value !== "") { // Get bounds in [minx, miny, maxx, maxy] format const bounds = map.getBounds().toArray().flat(); executeQuery(select.value, bounds); } }); return template.content; } } -
At the top right, click Run. When you select a where clause using the toolbox, a query will run against the feature layer and display all land parcels within the current viewport matching the where clause.
Add a pop-up
You can add a Popup to view attributes of a parcel when the user clicks on it.
See the Display a pop-up tutorial for more details.
-
Add a
clickevent handler to theparcels-filllayer. Inside, construct the pop-up content from the attributes of the clicked parcel. Create a newPopup, then usepopup.setto set the content. Set the position of the pop-up and add it to the map.HTML Use dark colors for code blocks .then((response) => { map.getSource("parcels").setData(response); }); } map.on("click", "parcels-fill", (e) => { const parcel = e.features[0].properties; const landValue = parcel.Roll_LandValue != "null" ? `$${parcel.Roll_LandValue.toLocaleString()}` : `N/A`; const message = `<b>Parcel ${parcel.APN}</b></br>` + `Type: ${parcel.UseType} <br>` + `Land value: ${landValue} <br>` + `Tax Rate City: ${parcel.TaxRateCity}`; new maplibregl.Popup().setHTML(message).setLngLat(e.lngLat).addTo(map); });
Run the app
In CodePen, run your code to display the map.
When the map displays, you should be able to use the query selector to display parcels. Click on a parcel to show a pop-up with the feature's attributes.
What's next?
Learn how to use additional ArcGIS location services in these tutorials:
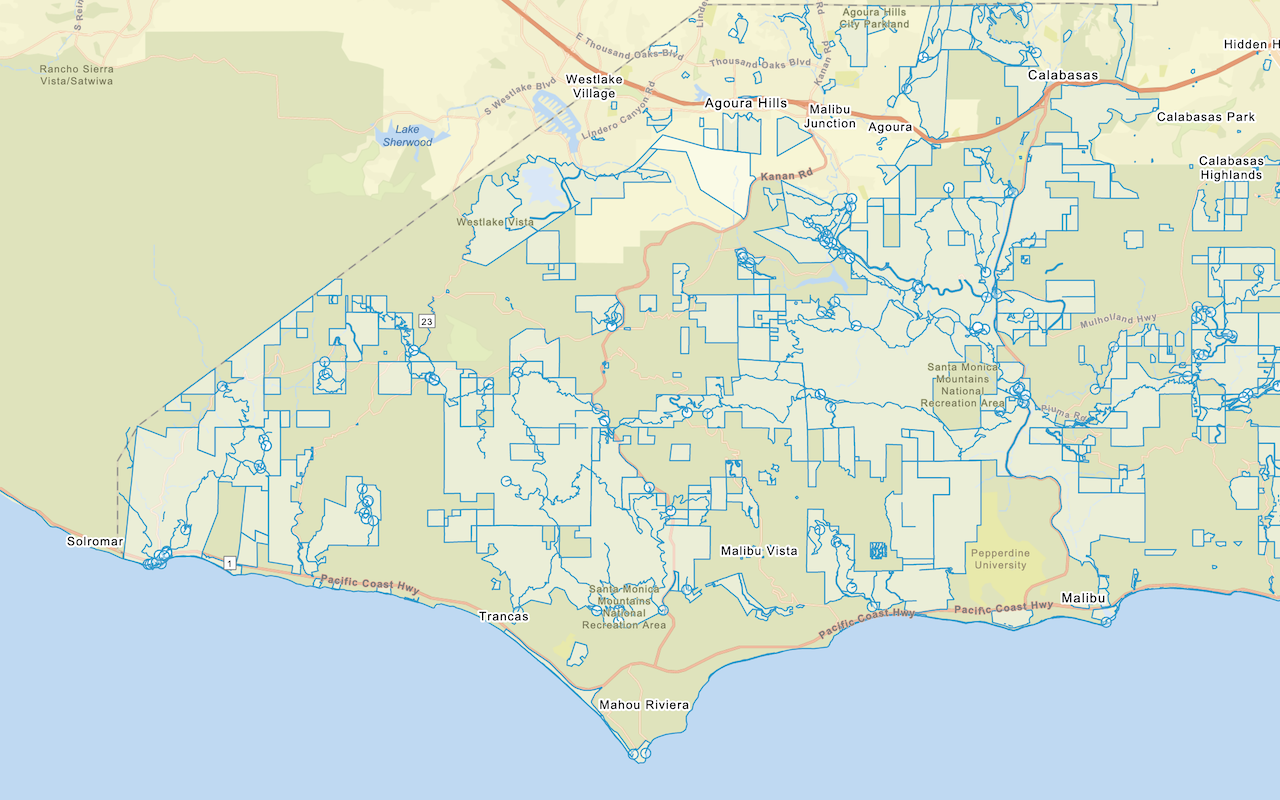
Query a feature layer (spatial)
Execute a spatial query to access polygon features from a feature service.
Get global data
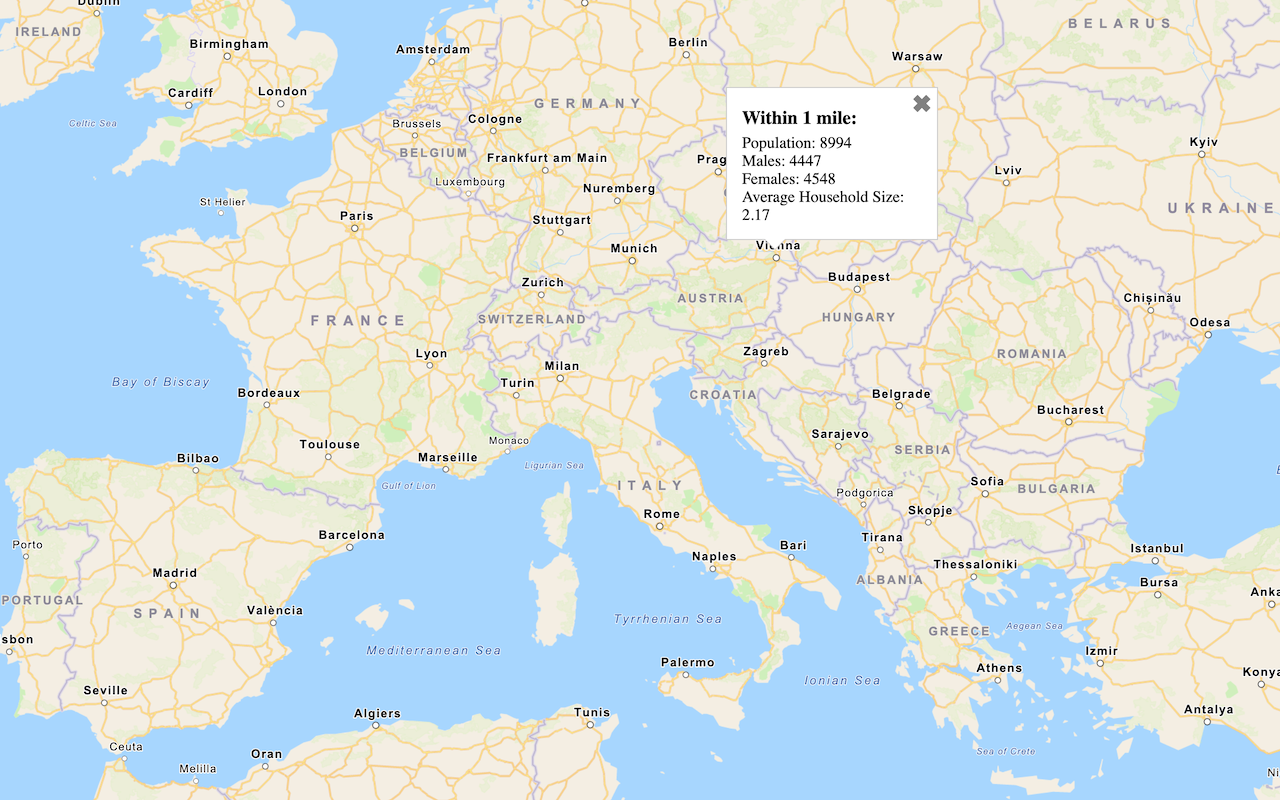
Query demographic information for locations around the world with the GeoEnrichment service.
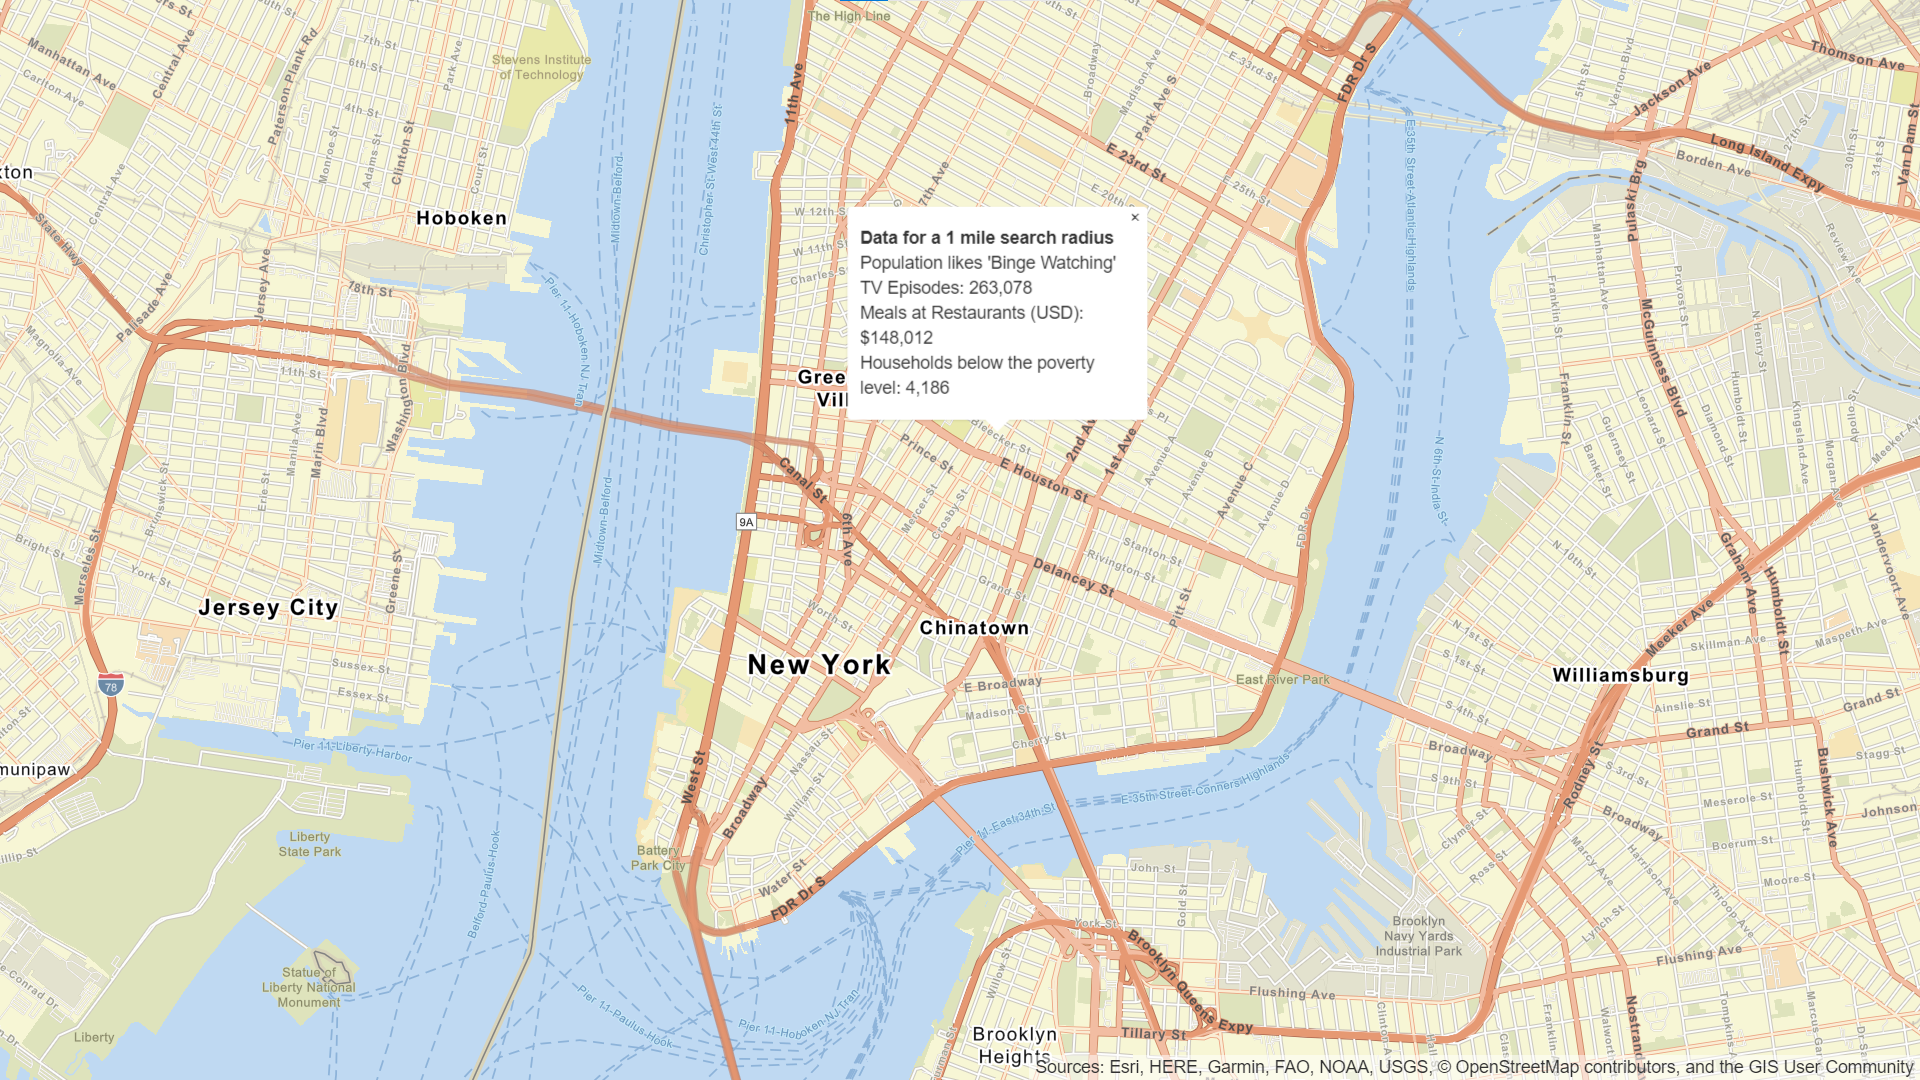
Get local data
Query regional facts, spending trends, and psychographics with the GeoEnrichment service.
Add a feature layer
Add features from feature layers to a map.
Style a feature layer
Use data-driven styling to apply symbol colors and styles to feature layers.