December 2018
Improved drawing performance in 2D
WebGL is now used for drawing all layers in a MapView. This allows us to draw all of the layers in the map using a single WebGL context, which improves drawing performance, especially on mobile devices or when using many FeatureLayers and/or VectorTileLayers. Rendering graphics in WebGL results in far more rapid display of both small and large datasets.
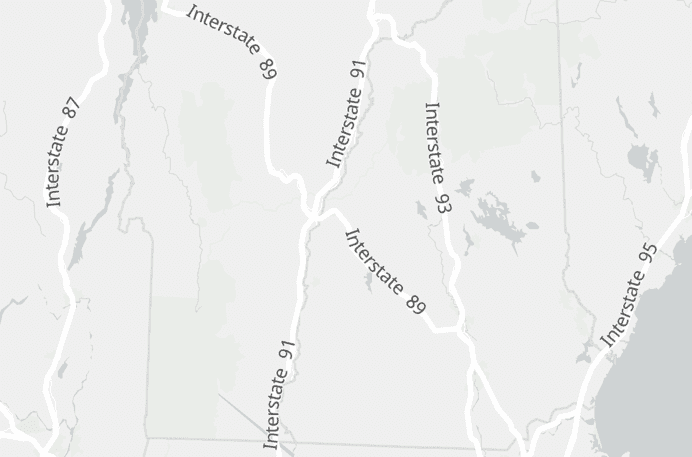
Better Labeling Support
In this release, we added support for labeling lines in 2D MapViews. Currently, the only 2D line labelPlacement supported is center-along. These labels are produced on the fly, based on your data, and dynamically change as the user interacts with the map. We also improved the labeling behavior when working with visual variables, and enhanced the labeling priority in 2D MapViews to better match the layer ordering. Lastly, if the TextSymbol3DLayer.size property is not set, the font.size property will be honored in 3D SceneViews. Future releases will include additional label values for lines, polylines, and polygons in 2D MapViews and 3D SceneViews.
VectorTileLayer updates
In 2D MapViews, you can now update the style of a VectorTileLayer without having to reload it. This can be done with the use of new methods included in this release for getting and setting the paint and layout properties. Check out the VectorTileLayer from JSON sample to see this in action.
Take a screenshot of the MapView
Using MapView.takeScreenshot() you can now create a screenshot of the view and export it as an image. Different options like image format, quality, aspect ratio or image size can be specified. See the Take a screenshot of a SceneView sample to learn more about this feature. Support for Scene was added in version 4.9.
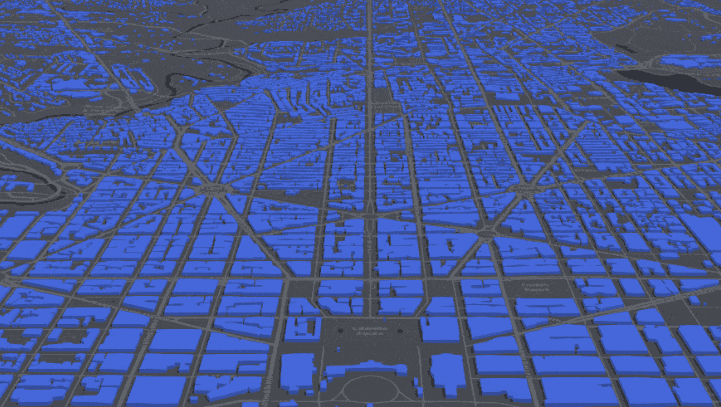
Large line and polygon datasets in a WebScene
In version 4.8 we added support for loading large point feature layers in a WebScene. With this release you can also add thousands of lines and polygons, allowing you to display and visualize large datasets containing features such as streets, rivers, parcels, and country borders.
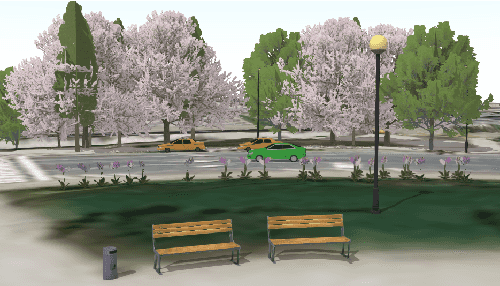
Enhanced 3D WebStyleSymbols
We added a new automatic level of detail to the 3D WebStyleSymbols, so that you can display tens of thousands of realistic trees, cars and other models, and maintain strong performance while zooming in and out. Check out the Visualize features with realistic WebStyleSymbols to see how to use them. For a list of available 3D models see the web style symbols guide page.
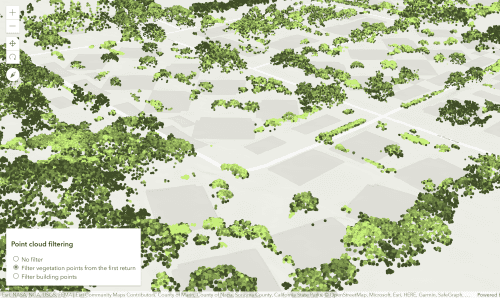
PointCloudLayer filters
PointCloudLayers can now be filtered based on their attributes. PointCloudValueFilter shows points that belong to a certain class. PointCloudReturnFilter filters points using the return value of each point. See the Filtering points in a PointCloudLayer sample to learn how to use these filters. For example, you can use it to display only points that belong to vegetation:
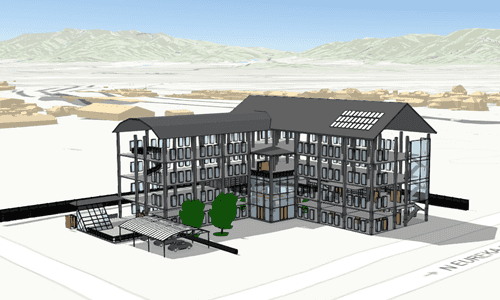
BuildingSceneLayer
Explore the fine details of buildings in scenes using the new BuildingSceneLayer. This new layer allows you to display and explore exterior and interior structures like facades, walls, doors and mechanical systems. The layer groups together BuildingComponentSublayers that are very similar to SceneLayers so you can apply renderers, customize popups with popupTemplates or filter by attributes using definitionExpression. BuildingSceneLayers can be published from Revit data with ArcGIS Pro 2.3. Check out the BuildingSceneLayer with Slice widget sample to learn more about BuildingSceneLayers.
New widgets
Slice widget
The Slice widget is a 3D analysis tool that can be used to reveal obstructed content in a SceneView. The slice widget can be applied to any layer type, making it possible to see inside buildings or to explore geological surfaces.

Sketch widget
The Sketch widget provides a simple UI for creating and updating graphics in a 2D MapView. By adding a Sketch widget to your application, you will be able to create new graphics or update existing graphics without having to write additional code. See the Sketch widget sample to learn more about Sketch widget.
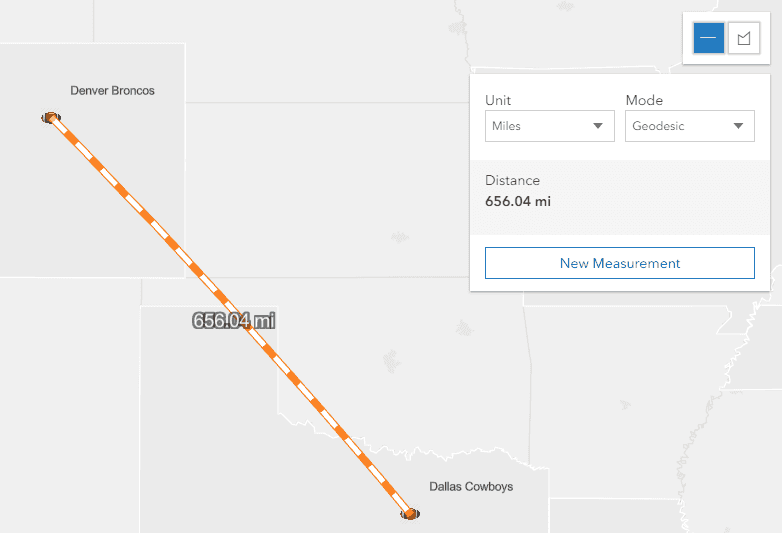
Widgets for measuring area and distance
We added two new widgets for measuring in 2D MapViews. The AreaMeasurement2D widget calculates and displays the area and perimeter of a polygon. The DistanceMeasurement2D widget calculates and displays the distance between two or more points. See the Measurement in 2D sample for an example of both widgets.
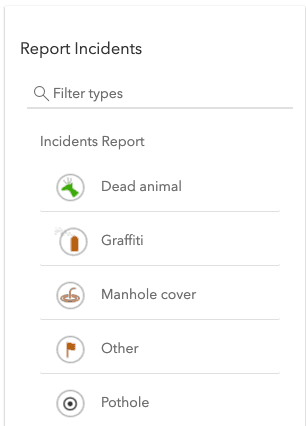
FeatureTemplates widget (Beta release)
The FeatureTemplates widget is part of the overall editing workflow. Its main purpose is to display templates from one or more feature layers. In addition to displaying templates, it is also possible to filter and group templates for an easier editing experience. See the updated FeatureLayer applyEdits sample to see this widget in action.
Widget updates
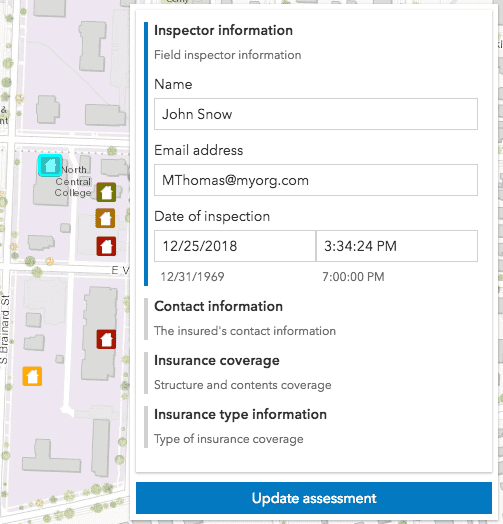
Updates to FeatureForm widget
The FeatureForm widget has been updated to allow grouped field configurations. You can configure field groupings to display and organize form data. Use this widget, in combination with FeatureLayer.applyEdits, to enable an end user to update a feature's attribute on a specified editable feature layer(s). For an example of grouped field configurations, please refer to the Update Feature Attributes sample.
SketchViewModel updates
We introduced some breaking changes for SketchViewModel in this release based on user feedback. These changes will allow you to accomplish same functionality with less code. In 4.10, you can select multiple graphics to rotate, scale or move. You can also specify if selected graphics can only be rotated, moved or scaled by setting SketchViewModel's defaultUpdateOptions or setting the update parameter of the update method.
Locate widget update
The Locate widget has been updated to now display a Popup once clicking on the resulting location.
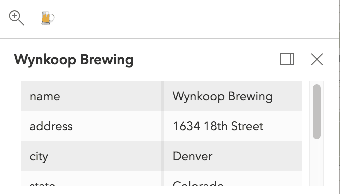
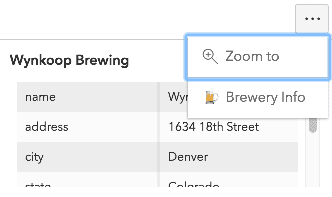
Updates to Popup widget
The Popup widget UI has been redesigned to display action items differently.
| Multiple actions on Popup in 4.9 | Multiple actions on Popup in 4.10 |
|---|---|
|
|
Prior to version 4.10, a user would need to add event.stop to allow manual display of a Popup with the view's click event. With 4.10 and onward, this event is handled directly in the Popup, rather than the View. Set the new autoOpenEnabled to false. This prevents the Popup from opening when the view is clicked.
view.popup.autoOpenEnabled = false;
view.on("click", function(event) {
view.popup.open({
// Set the popup
});
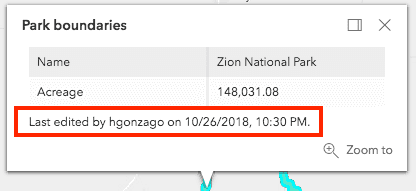
});A new property, lastEditInfoEnabled was added to the PopupTemplate. This property allows you to indicate whether to display editor tracking information (if enabled on the feature layer). If set to true, the popup displays similar to what is shown below.
Better WebMap Support
In this release, we added support for line labeling. This means most web maps can now be read using the 4.x version of the ArcGIS Maps SDK for JavaScript. Not yet supported web map features include WFS and time support.
API updates and enhancements
- Arcade expressions now support geometry functions.
- MapView now automatically projects graphics with any spatial reference to the view's spatial reference.
- Added class esri/layers/BuildingSceneLayer.
- Added class esri/layers/buildingSublayers/BuildingComponentSublayer.
- Added class esri/layers/buildingSublayers/BuildingGroupSublayer.
- Added class esri/layers/buildingSublayers/BuildingSublayer.
- Added class esri/layers/pointCloudFilters/PointCloudFilter.
- Added class esri/layers/pointCloudFilters/PointCloudReturnFilter.
- Added class esri/layers/pointCloudFilters/PointCloudValueFilter.
- Added class esri/layers/support/AttachmentInfo.
- Added class esri/renderers/visualVariables/ColorVariable.
- Added class esri/renderers/visualVariables/OpacityVariable.
- Added class esri/renderers/visualVariables/RotationVariable.
- Added class esri/renderers/visualVariables/SizeVariable.
- Added class esri/renderers/visualVariables/support/ColorStop.
- Added class esri/renderers/visualVariables/support/OpacityStop.
- Added class esri/renderers/visualVariables/support/SizeStop.
- Added class esri/renderers/visualVariables/VisualVariable.
- Added class
esri/support/Content.Element - Added class
esri/support/Content.Element/Attachments - Added class
esri/support/Content.Element/Content Element - Added class
esri/support/Content.Element/Fields - Added class
esri/support/Content.Element/Media - Added class
esri/support/Content.Element/Media/Bar Chart - Added class
esri/support/Content.Element/Media/Chart - Added class
esri/support/Content.Element/Media/Chart/Series - Added class
esri/support/Content.Element/Media/Chart/Value - Added class
esri/support/Content.Element/Media/Column Chart - Added class
esri/support/Content.Element/Media/Image - Added class
esri/support/Content.Element/Media/Image/Value - Added class
esri/support/Content.Element/Media/Line Chart - Added class
esri/support/Content.Element/Media/Media - Added class
esri/support/Content.Element/Media/Pie Chart - Added class
esri/support/Content.Element/Text - Added class
esri/support/Expression.Info - Added class
esri/support/Field.Info - Added class
esri/support/Field.Info/Format - Added class
esri/support/Layer.Options - Added class
esri/support/Related.Records Info - Added class
esri/support/Related.Records Info/Field Order - Added class esri/widgets/AreaMeasurement2D.
- Added class esri/widgets/AreaMeasurement2D/AreaMeasurement2DViewModel.
- Added class esri/widgets/DistanceMeasurement2D.
- Added class esri/widgets/DistanceMeasurement2D/DistanceMeasurement2DViewModel.
- Added class esri/widgets/FeatureForm/FieldGroupConfig.
- Added class esri/widgets/FeatureForm/InputFieldGroup.
- Added class esri/widgets/FeatureTemplates.
- Added class esri/widgets/FeatureTemplates/FeatureTemplatesViewModel.
- Added class esri/widgets/FeatureTemplates/TemplateItem.
- Added class esri/widgets/FeatureTemplates/TemplateItemGroup.
- Added class esri/widgets/Search/SearchResultRenderer.
- Added class esri/widgets/Sketch.
- Added class esri/widgets/Slice.
- Added class esri/widgets/Slice/SliceViewModel.
- Added property anchorPosition to esri/symbols/ObjectSymbol3DLayer.
- Added property autoOpenEnabled to esri/widgets/Popup.
- Added property autoOpenEnabled to esri/widgets/Popup/PopupViewModel.
- Added property color to esri/symbols/Symbol.
- Added property declaredClass to esri/layers/support/DimensionalDefinition.
- Added property defaultLabel to esri/renderers/ClassBreaksRenderer.
- Added property FeatureLayer.capabilities.operations.supportsQueryAttachments to esri/layers/FeatureLayer.
- Added property filters to esri/layers/PointCloudLayer.
- Added property group to esri/widgets/FeatureForm/InputField.
- Added property groupDisplay to esri/widgets/FeatureForm.
- Added property hasAttributionData to esri/layers/BingMapsLayer.
- Added property travelMode to esri/tasks/support/ClosestFacilityParameters.
- Added property travelMode to esri/tasks/support/RouteParameters.
- Added property travelMode to esri/tasks/support/ServiceAreaParameters.
- Added properties description, domain, editable, editorType, hint, label, maxLength, required to esri/widgets/FeatureForm/FieldConfig.
- Added properties lastEditInfoEnabled, relatedRecordsInfo to esri/PopupTemplate.
- Added properties maximumNumberOfFeatures, maximumNumberOfFeaturesExceeded to esri/views/layers/CSVLayerView.
- Added properties maximumNumberOfFeatures, maximumNumberOfFeaturesExceeded to esri/views/layers/FeatureLayerView.
- Added properties maximumNumberOfFeatures, maximumNumberOfFeaturesExceeded to esri/views/layers/SceneLayerView.
- Added method checkAppAccess to esri/identity/IdentityManager.
- Added method clone to esri/tasks/support/StatisticDefinition.
- Added method create to esri/core/promiseUtils.
- Added method findField to esri/widgets/FeatureForm/FeatureFormViewModel.
- Added method isRTL to esri/widgets/support/widget.
- Added method loadAll to esri/layers/GroupLayer.
- Added method newMeasurement to esri/widgets/AreaMeasurement3D/AreaMeasurement3DViewModel.
- Added method newMeasurement to esri/widgets/DirectLineMeasurement3D/DirectLineMeasurement3DViewModel.
- Added method open to esri/widgets/Popup/PopupViewModel.
- Added method takeScreenshot to esri/views/MapView.
- Added method ungeoreference to esri/geometry/support/meshUtils.
- Added methods clone, fromJSON to esri/layers/support/DimensionalDefinition.
- Added methods getLayoutProperties, getPaintProperties, getStyleLayerId, setLayoutProperties, setPaintProperties to esri/layers/VectorTileLayer.
- Added support for
trianglestyle in SimpleMarkerSymbol.style. - Added support for printing BingMapsLayer.
- The
themeproperty ofMediahas been deprecated, and will be removed at version 4.11.Info Chart Value
Breaking changes
- Renamed the Esri Icon Font family from
CalcitetoW e b Core Icons calcite-web-iconsfor 2D MapViews. - Removed FeatureLayer.capabilities.query.supportsAttachments from esri/layers/FeatureLayer.
- Creating a FeatureLayer from client-side features now requires a
typeproperty to be set for each field. - The
Fieldclass has been removed and merged with the FieldConfig class.Options - Removed the ability of
event.stopto allow manual display of a Popup with the view's click event. Set the new autoOpenEnabled toPropagation() falseinstead. - All documentation for
Identityhas been merged into IdentityManager.Manager Base
Please refer to the Breaking Changes guide topic for a complete list of breaking changes across all releases of the 4x API.
Bug fixes and enhancements
- BUG-000109959: Fixed an issue where the MapView.scale value differs between desktop browsers and mobile browsers.
- BUG-000112925: The IdentifyResult.toJSON method was fixed to no longer return an empty JavaScript object.
- BUG-000115254: Fixed an issue where vector tile layers did not render correctly on touch screen devices.
- BUG-000115402: Fixed an issue where apps configured with Integrated Windows Authentication security caused services to disappear or become unresponsive after 30 minutes of sitting idle.
- BUG-000115508: Fixed an issue where gridlines would occasionally display on basemaps while zooming in using mobile devices.
- BUG-000115703: Fixed an issue when calling the refresh() method every second on a layer would only send a request every 6 seconds.
- BUG-000116487: Fixed a problem when trying to add or remove a new format to the CoordinateConversion widget.
- BUG-000116758: Changing a layer's listMode now correctly updates in the LayerList widget while working with a GroupLayer.
- BUG-000117211: Fixed the sample Synchronize MapView and SceneView so that no errors no longer display in the console.
- BUG-000117370: Fixed an issue where the Popup widget would not display fields correctly in a feature collection layer.
- BUG-000117396: Fixed an issue where offsets were not honored when used when rendering client-side graphics with PictureMarkerSymbols.
- BUG-000116667: Updated documentation for the Query's outSpatialReference property.
- ENH-000115400: Added a comment in the Search widget and
Featuredocumentation specific to support for feature layers in the Search sources.Layer Search Source - GEONET-222984: Support adding formats dynamically to the CoordinateConversion widget.
- GEONET-223936: Updating the
mapproperty on the MapView now works in IE11. - GEONET suggestion: Better accessibility for closed Expand widgets.
- Added an enhancement to RequestOptions.responseType. When this value is
image, theheadersare no longer ignored. - Fixed a offset issue for symbols with an SVG-based path that had a non-square aspect ratio.
- Fixed an issue where haloColor and haloSize properties of TextSymbol were not being properly honored.
- Fixed an issue where the Layer.opacity property was affecting its label opacity as well.
- Fixed an issue where the Print widget was not properly displaying the legend on the printout.
- Fixed an issue with PrintTask to properly honor the LayerView.visible property.
- Fixed an issue with printing a CSVLayer.
- Fixed an issue with printing a FeatureLayer created from an array of client-side features.
- Fixed an issue with properly honoring the
angle,xoffset, andyoffsetproperties of the TextSymbol class when labeling features. - Improved the display of labels when multiple label classes are present and active in 2D MapViews.
- The behavior of the MapView.html#goTo method has changed to zoom to fit the defined target, instead of zooming to the nearest level of detail (LOD).
Additional packages
Version 4.10 of the ArcGIS Maps SDK for JavaScript uses ArcGIS Arcade 1.5 (no FeatureSet support), Dojo 1.14.0 (since 4.9), dgrid version 1.2.1 (since 4.5), and dstore version 1.1.2 (since 4.5). From Dojo 4 we use @dojo/framework version 4.0.0 (since 4.10).
How to access the SDK
- The API library is available on both CDN and npm, Read more at Get started.
- For supported versions, you can also download both the documentation and the API library. These downloads are typically available 3-4 weeks after release.
Previous releases
- Version 4.29 - February 2024
- Version 4.28 - October 2023
- Version 4.27 - June 2023
- Version 4.26 - February 2023
- Version 4.25 - November 2022
- Version 4.24 - June 2022
- Version 4.23 - March 2022
- Version 4.22 - December 2021
- Version 4.21 - September 2021
- Version 4.20 - June 2021
- Version 4.19 - April 2021