December 2021
AnimatedFlowRenderer
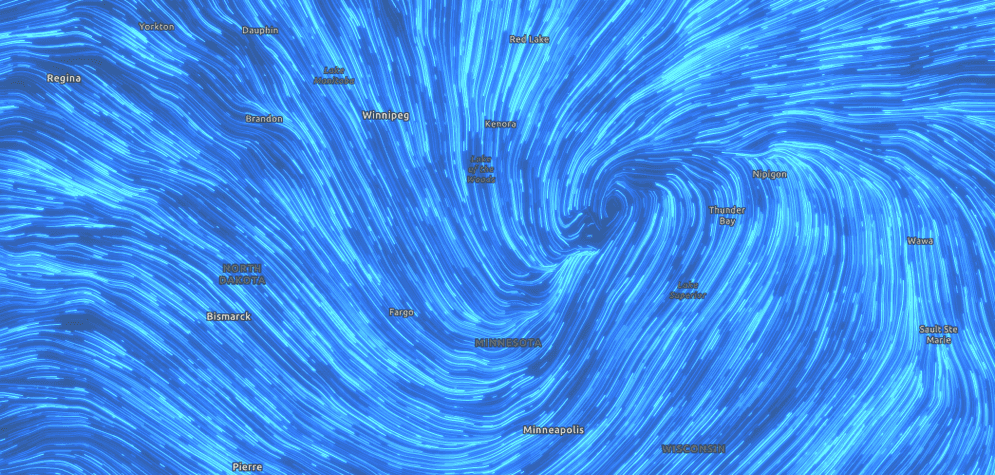
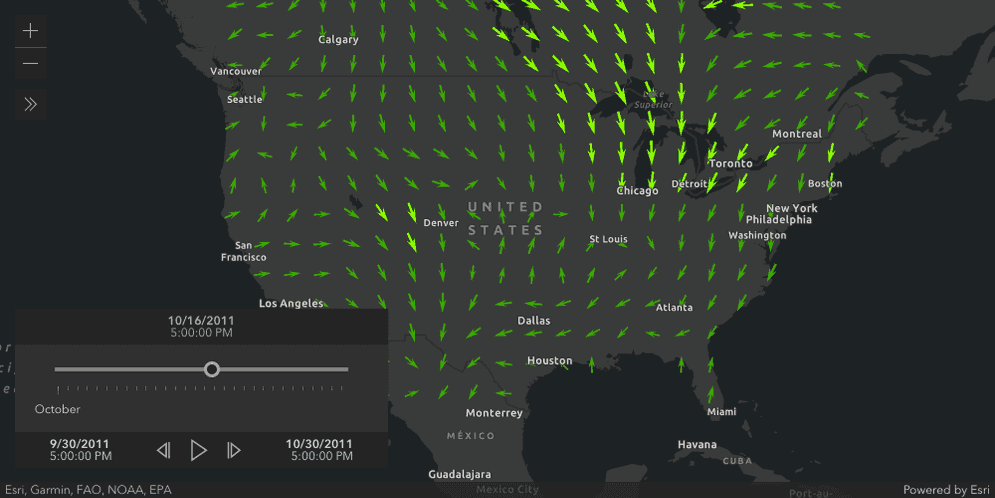
The AnimatedFlowRenderer (released in beta) allows you to visualize your UV or Mag raster data with animated streamlines.
This renderer can be used to visualize flow direction and magnitude information in ImageryLayers and ImageryTileLayers in a MapView.
The direction of the raster defines the direction of movement, and the magnitude defines the visible length of the streamline.
This new renderer also works well with layer effects and blendModes, as shown in this sample: AnimatedFlowRenderer with effects and blending. The AnimatedFlowRenderer is still in beta. We plan to add more support in the upcoming releases for things like the TimeSlider widget, visual variables, and more!
3D updates
Weather
Make your scenes more realistic by adding weather. A new property on SceneView.environment allows you to configure a range of weather conditions from sunny to cloudy and even foggy. Adjust cloud cover, fog strength and time-of-day to enjoy a new atmosphere and weather visualizations at ground level.
Use this new sample to see San Francisco in different weather conditions.
Line patterns
Use patterns on lines or polygon outlines to symbolize additional information, for example to differentiate between planned and existing features. A new class LineStylePattern3D provides a variety of styles compatible with existing 2D capabilities. Patterns can be driven by attribute values and combined with visual variables.
Examples of different line patterns are used in the following hiking map sample.
Voxel layer
VoxelLayer (released in beta) allows you to display multidimensional volumetric data in local scenes. Powered by WebGL2 you can now visualize atmospheric or oceanic data, geological underground models, or space-time cubes using voxel layers. Upcoming releases will add support for explorative tools and popups to inspect individual voxels.
A new sample visualizes sea water temperature in the Caribbean at various depths.
Improved performance and stability
As part of our ongoing efforts to improve performance, we reduced memory usage up to 50% for applications with FeatureLayers using simple polygons and simple polygon outlines by streamlining how vertex data is encoded. This will help increase stability on resource-constrained devices such as phones and tablets.
Visualization
Faster smart mapping statistics
Logic for calculating unique values, summary statistics, class breaks, and histogram in smart mapping for client-side layers moved from the main thread to workers. This prevents UI freezing and makes statistic calculations 6x faster than in previous versions of the API. This applies to statistic calculations in FeatureLayers created from client-side graphics, CSVLayer, GeoJSONLayer, WFSLayer, OGCFeatureLayer, and any service-based FeatureLayer using an Arcade expression in its renderer.
In the animation below, note the UX improvement in the ArcGIS Online Map Viewer as it generates statistics for histograms and class breaks much faster when using version 4.22 of the API than version 4.21.
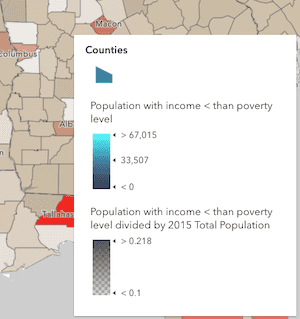
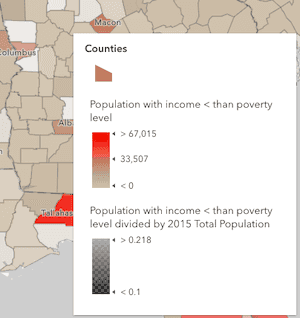
Legend support for layer effects
The Legend widget now supports layer effects in operational layers. It does not support FeatureEffect.
Compare the following images showing the Legend for a layer that has the invert effect applied. In 4.22, the Legend much more accurately depicts what is rendered on the map.
| 4.21 | 4.22 |
|---|---|
|
|
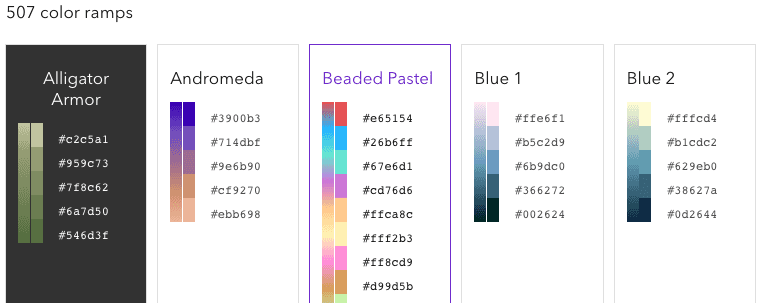
More than 500 color ramps now available
We added 167 colorblind-friendly color ramps to the Smart Mapping color APIs. These ramps include dozens of newly designed above-and-below ramps that emphasize middle values in addition to the values above and below the critical middle value. Traditionally, above and below color ramps use neutral hues that blend in with the basemap for the middle values, making it difficult to see those features. There are many scenarios where that is desirable (i.e. where the important values are further from the center). However, making the middle values more obvious can help users to easily see the locations of all data points, especially when middle values are important to highlight in addition to the extremes.
These new color ramps can be accessed in the following ways:
- As color schemes with suggested symbol properties based on geometry type and desired background color.
- As an array of colors via the colorRamps module.
- Directly from the Esri Color Ramps topic. On this page, you can preview all available ramps and filter them based on theme, color, and background and copy and paste the colors directly into your app.
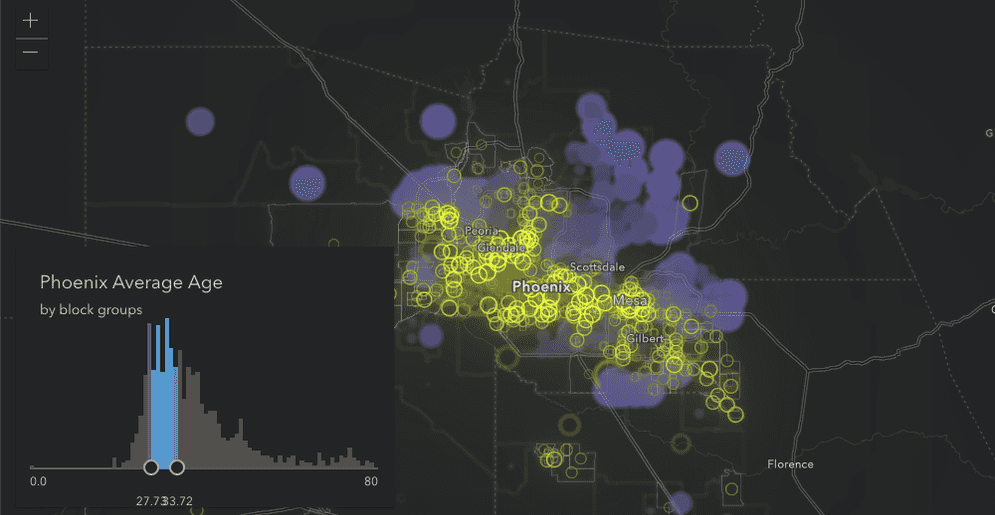
High density data guide topics
We added a new chapter to the Visualization guide called High density data. This chapter demonstrates seven effective ways you can visualize data with overlapping features. Covered topics include the following:
Trace how resources flow through a utility network
The new UtilityNetworkTrace widget allows users to run a trace in a WebMap containing a Utility Network.
In order to use the Utility widget, the Web must be published with Named Trace Configurations, which are supported as of ArcGIS Enterprise 10.9.
Input flags (starting points and barriers) can be set via the widget. The starting points define the location in the network where the trace begins, and the barrier points mark the locations to stop the trace.
The Utility widget can execute one or more traces simultaneously. Refer to the blog "Trace a Utility Utility Network with the ArcGIS Maps SDK for JavaScript" in order to learn more about
tracing with the Utility widget.
Improved polyline labels
We improved the polyline labeling experience by giving developers more control and configuration options. Previously, the API only allowed for a "curved" labelPosition, which meant each of the label characters followed the curve of the polyline. Now, you can choose between "curved" or "parallel", with "parallel" meaning that the label characters will always be straight, and the orientation of the label will be based on the polyline curve angle.
We also added a repeatLabelDistance
property, which indicates the distance between labels on a polyline. The
repeatLabel must
be true for repeat to be honored. If repeat is false, the label will only appear once
per polyline segment. Lastly, allowOverrun
specifies whether or not a label can overrun the geometry feature being labeled, e.g. after the end of a polyline segment.
See the images below to compare how the upgraded polyline labeling looks:
| 4.21 - default configuration | 4.22 - label = "parallel”, repeat = 200 |
|---|---|
|
|
Popup updates
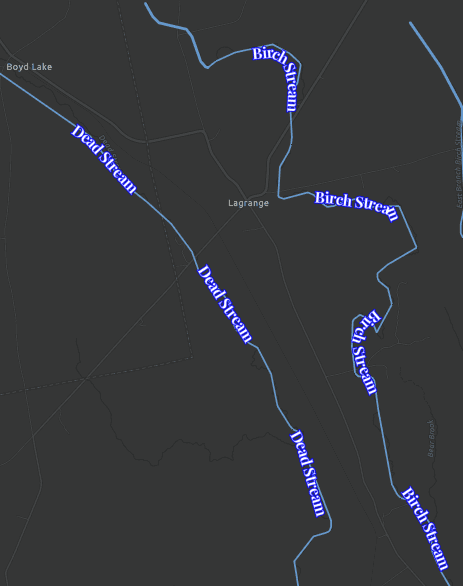
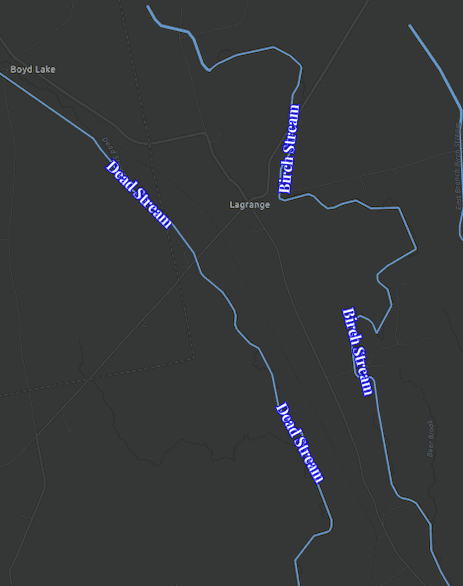
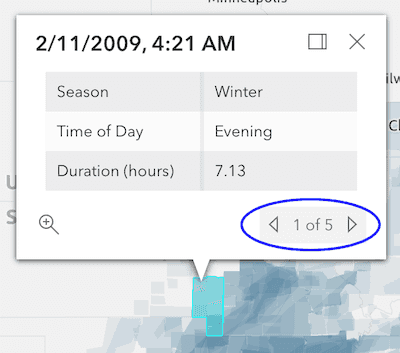
Only show popup for visible features
As of version 4.22, the popup only displays for features visible in the map. If there is a filter applied, only the features that pass the filter will return a popup. We will continue to improve popup behaviors in coming releases.
The map in the following images is filtered by Season = "Winter". Notice how in 4.21, all features return a popup, but in 4.22 only the filtered features return a popup.
| 4.21 - all features returned | 4.22 - only filtered features returned |
|---|---|

|
|
The popup only makes one query to the server for missing attributes if not all required attributes are available on the client. No server requests are made if all attributes are available on the client. This should translate into a better performance.
Use Arcade to create popup content elements
PopupTemplate now supports a new content type: ExpressionContent. ExpressionContent allows you to use Arcade to create popup content elements, including rich text with HTML, tables, and charts.
Defining dynamic popup content in Arcade expressions as opposed to JavaScript means you can save the popup template in a webmap and load it in other ArcGIS apps, providing a consistent user experience for the same webmap. This feature is especially useful in layers representing aggregated data.
Prior to this release, if you wanted to create a chart from values returned from an Arcade expression, you would have to write a separate expression for each data point in the chart's media infos. With this change, you can create multiple charts with a single expression, allowing you to write more efficient code. Creating charts with ExpressionContent also allows popup content to render 3-4 times faster than when using multiple expressions in a MediaContent element. The increased performance improvement depends on the number and complexity of expressions you would have had to use in a MediaContent element.
Check out these examples of how to use Arcade to create popup content elements.
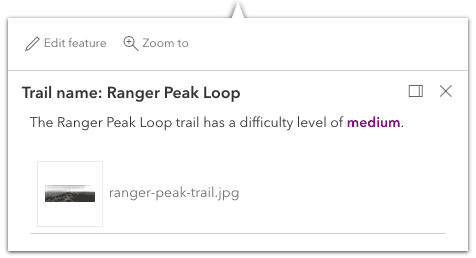
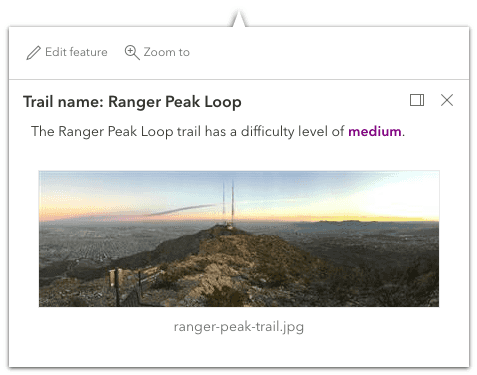
Better defaults for popup attachments
Attachment content within Popups now uses auto as the default displayType instead of list. If the feature layer's capabilities support resizing attachments, the content will display in preview mode. If not, it will revert to displaying the attachment as a list.
The images below show the same popup attachment. Take note that the 4.22 version displays as preview since the layer supports resizing attachments.
Default display, layer supports attachment resizing - 4.21 | Default display, layer supports attachment resizing - 4.22 |
|---|---|
|
|
Feature ordering
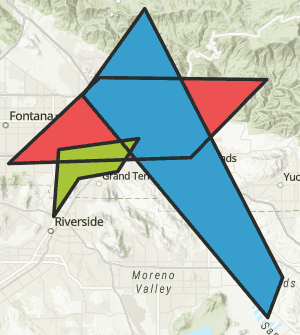
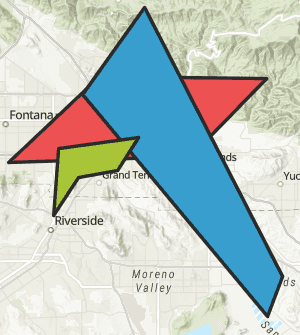
Improved support for overlapping polygon features
We improved how overlapping polygon features are displayed in the map. Previously, polygon outlines were rendered after polygon fills, causing the outlines to display on top. This made it difficult to differentiate boundaries for overlapping polygons. At 4.22, we now render solid outlines and fills simultaneously for each polygon in the order that each feature is displayed in the map.
| 4.21 | 4.22 |
|---|---|
|
|
Support for feature ordering in WFSLayer
WFSLayer added the orderBy property to allow you to configure the order features are drawn in the view. The order property was added to other layer types at version 4.21.
Layer updates
Better support for CSVLayer and GeoJSONLayer
We've added the following enhancements and improvements to CSVLayer and GeoJSONLayer.
- CSVLayer and GeoJSONLayer can now be refreshed, meaning that you can fetch new data after those layers are initialized and loaded to the map.
- We added support for
customon both CSVLayer and GeoJSONLayer. This property can be used to set additional query parameters when the layer is initialized or refreshed. Check out this sample to seeParameters refreshandcustomin action on the GeoJSONLayer.Parameters - GeoJSONLayer now supports
stringand number feature ids in its objectIdField. - GeoJSONLayer now can be persisted in a WebMap and WebScene.
Raster layers
At this release, we added time support for ImageryTileLayer and WCSLayer.
For imagery centric workflows that use image coordinate systems, we added computeAngles() and computePixelSpaceLocations() methods on ImageryLayer and imageService. These methods can help imagery analysts know the corresponding up and north angles and the pixel space locations for image coordinates.
Refreshable layers
We've added the following optimizations and improvements for working with refreshable layers — layers that update their data at a specified interval.
A layer is refreshable if it has a refresh property.
- GeoRSSLayer is now can be refreshed by setting its refreshInterval property or calling refresh() method.
- CSVLayer and GeoJSONLayer can also be refreshed now. See details from the previous section.
- All refreshable layers emit a
refreshevent that will indicate when the data has been refreshed. This event now has a payload to indicate if the layer's data has changed.
Widget updates
Easier graphic selection for Sketch
Using Sketch and SketchViewModel, you can select and move point graphics in the map by clicking anywhere on the symbol. Previously, it was only possible to move a point graphic directly from the location of the point geometry. These changes are specifically for CIMSymbol, PictureMarkerSymbol, and TextSymbol.
In the images below, the point geometry is represented by an orange circle. In 4.22, you can move the graphic by clicking anywhere on the symbol, instead of only on the point geometry.
| 4.21 | 4.22 |
|---|---|
 |  |
Time-enabled bookmarks
The Bookmarks widget now supports bookmarks that are time-enabled, or have a specified time extent.
When a time-enabled bookmark is selected in the bookmarks widget, the view's time extent will update to match the time extent of the selected bookmark.
A time extent will only be set on a bookmark if View.time is defined when the bookmark is created.
TimeSlider - get properties from WebMap
TimeSlider.getPropertiesFromWebMap() allows you to easily configure your TimeSlider based on settings saved in a WebMap.
Print widget
By default, the map extent is now preserved instead of the map scale in the printout. This allows you to print all the features in the current view. To preserve the scale instead, use the TemplateOptions.scaleEnabled property.
If using a custom print service, custom are now supported for each print template with the
Print widget. The widget calls the Get Layout Templates Info
task on the GPServer to discover possible custom values for each template. Values found there
will be populated in the Print widget under Advanced options. These values can be overwritten in the Print
widget UI, or programmatically using the
Print.templateCustomTextElements property.
If the Get Layout Templates Info task is named differently on the custom print service, then no values will be
populated in the Print widget under Advanced options, and it will not be possible to support custom.
In this scenario, we recommend republishing the print service to use the standard Get Layout Templates Info name.
Lastly, the Print widget and print support printing layers with non-standard URLs
(e.g. no MapServer, FeatureServer, or ImageServer in the URL) by sending a layer property in the print request.
However, this requires a print service from ArcGIS Server 10.9.1 or later.
Search widget
When the scale of the MapView or SceneView is less than or equal to 300,000, the
Search widget supports prioritization
of candidates based on their distance from the center of the view by passing in the
location parameter. This default behavior can now be changed by using the
localSearchDisabled
property.
Feature effect support for layers
We added feature to CSVLayer, GeoJSONLayer, FeatureLayer, OGCFeatureLayer and WFSLayer, which allows you to draw attention to features of interest.
The corresponding layerViews of those layers also support the feature property, and it should be used in place of effect. Feature effects that are set on layers can be persisted in a WebMap.
MapView.hitTest improvements for GraphicsLayer
MapView.hittest now returns all features that intersect the specified screen coordinates from a GraphicsLayer. Previously, it only returned the topmost feature from a GraphicsLayer. We will implement this behavior for other layers in upcoming releases.
Updates to identify operation
The identify operation was enhanced to add support for dynamic layers and time extent. We added a sublayers property to allow identify to be performed on MapImageLayer. We also added a timeExtent property to allow users to specify the time extent used by identify.
API keys
- New apiKey property on VectorTileLayer.
- When a global API key is set, the default basemaps displayed in the BasemapGallery widget will default to the basemaps for use with API keys (as defined by the Portal.devBasemapGalleryGroupQuery property).
Support for Bulgarian locale
Version 4.22 adds support for the Bulgarian (bg) locale. See the Localization topic for more information about using different locales.
Content Security Policy
It is no longer necessary to set Dojo's "csp-restrictions" has flag to true when CSP support is needed. Although this flag is no longer necessary, please be aware that there are still limitations when using the JavaScript API with CSP. Please refer to our FAQ section for additional information regarding this.
Added classes, properties, methods, events
- esri/layers/support/FeatureEffect
- esri/layers/support/FeatureFilter
- esri/layers/VoxelLayer
- esri/popup/content/ExpressionContent
- esri/popup/ElementExpressionInfo
- esri/renderers/AnimatedFlowRenderer
- esri/rest/support/ImageAngleParameters
- esri/rest/support/ImageAngleResult
- esri/rest/support/ImagePixelLocationParameters
- esri/rest/support/ImagePixelLocationResult
- esri/symbols/patterns/LineStylePattern3D
- esri/views/3d/environment/CloudyWeather
- esri/views/3d/environment/FoggyWeather
- esri/views/3d/environment/RainyWeather
- esri/views/3d/environment/SunnyWeather
- esri/widgets/UtilityNetworkTrace
- esri/widgets/UtilityNetworkTrace/UtilityNetworkTraceViewModel
esri/layers/CSVLayer- Added properties: customParameters, featureEffect, refreshInterval
- Added method: refresh
- Added event: refresh
esri/layers/GeoJSONLayer - Added properties: customParameters, editingEnabled, featureEffect, refreshInterval
- Added method: refresh
- Added event: refresh
esri/layers/GeoRSSLayer - Added property: refreshInterval to
esri/layers/GeoRSSLayer - Added method: refresh
- Added event: refresh
- Added property: refreshInterval to
esri/layers/ImageryLayer - Added property: rasterFunctionInfos
- Added methods: computeAngles, computePixelSpaceLocations
esri/layers/ImageryTile Layer - Added properties: timeExtent, timeInfo, timeOffset, useViewTime
esri/layers/OGCFeatureLayer - Added properties: featureEffect, screenSizePerspectiveEnabled
esri/layers/StreamLayer - Added properties: customParameters, featureEffect
esri/layers/VectorTile Layer - Added properties: apiKey, customParameters
esri/layers/WFSLayer- Added properties: featureEffect, orderBy
esri/networks/UtilityNetwork - Added properties: rulesTableId, rulesTableUrl
esri/portal/Portal- Added properties: defaultDevBasemap, devBasemapGalleryGroupQuery
esri/rest/imageService - Added methods: computeAngles, computePixelSpaceLocations
esri/rest/support/IdentifyParameters - Added properties: sublayers, timeExtent
esri/widgets/Print/PrintView Model - Added properties: effectiveTemplateCustomTextElements, templateCustomTextElements
esri/widgets/Search/LocatorSearch Source - Added properties: localSearchDisabled, url
- Added property:
featureto esri/layers/CSVLayer, esri/layers/FeatureLayer, esri/layers/GeoJSONLayer, esri/layers/OGCFeatureLayer, esri/layers/StreamLayer, esri/layers/WFSLayer, esri/views/layers/CSVLayerView, esri/views/layers/FeatureLayerView, esri/views/layers/GeoJSONLayerView, esri/views/layers/OGCFeatureLayerView, esri/views/layers/StreamLayerView, esri/views/layers/WFSLayerViewEffect - Added property:
timeto esri/webmap/BookmarkExtent - Added property:
repeatto esri/layers/support/LabelClassLabel Distance - Added property:
sourceto esri/networks/NetworkJSON - Added property:
rulesto esri/networks/UtilityNetworkTable I d - Added property:
rulesto esri/networks/UtilityNetworkTable Url - Added property:
defaultto esri/portal/PortalD e v Basemap - Added property:
devto esri/portal/PortalBasemap Gallery Group Query - Added property:
filterto esri/portal/PortalQueryParams - Added property:
sublayersto esri/rest/support/IdentifyParameters - Added property:
patternto esri/symbols/LineSymbol3DLayer - Added property:
abilitiesto esri/widgets/Bookmarks/BookmarksViewModel - Added property:
textto esri/widgets/FeatureTable/FieldColumnConfigAlign - Added property:
templateto esri/widgets/Print, esri/widgets/Print/PrintViewModelCustom Text Elements - Added property:
effectiveto esri/widgets/Print/PrintViewModelTemplate Custom Text Elements - Added property:
customto esri/widgets/Print/TemplateOptionsText Elements - Added property:
localto esri/widgets/Search/LocatorSearchSourceSearch Disabled - Added property:
urlto esri/widgets/Search/LocatorSearchSource - Added property:
defaultto esri/widgets/Search/SearchViewModelSymbols - Added method:
refreshto esri/layers/CSVLayer, esri/layers/GeoJSONLayer, esri/layers/GeoRSSLayer - Added method:
computeto esri/layers/ImageryLayer, esri/rest/imageServiceAngles - Added method:
computeto esri/layers/ImageryLayer, esri/rest/imageServicePixel Space Locations - Added method:
getto esri/widgets/TimeSlider, esri/widgets/TimeSlider/TimeSliderViewModelProperties From W e b Map
Deprecated classes, properties, methods, events
The following are deprecated and will be removed in a future release:
- AddressCandidate deprecated since version 4.20. Use AddressCandidate instead.
- AlgorithmicColorRamp deprecated since version 4.20. Use AlgorithmicColorRamp instead.
- AreasAndLengthsParameters deprecated since version 4.20. Use AreasAndLengthsParameters instead.
- AttachmentQuery deprecated since version 4.20. Use AttachmentQuery instead.
- BasemapToggle.toggle deprecated since version 4.22. Use BasemapToggle instead.
- Bookmark.extent deprecated since 4.17. Use viewpoint instead.
- BufferParameters deprecated since version 4.20. Use BufferParameters instead.
- ClosestFacilityParameters deprecated since version 4.20. Use ClosestFacilityParameters instead.
- ClosestFacilitySolveResult deprecated since version 4.20. Use ClosestFacilitySolveResult instead.
- ClosestFacilityTask deprecated since version 4.20. Use closestFacility instead.
- ColorRamp deprecated since version 4.20. Use ColorRamp instead.
- CSVLayerView.effect deprecated since version 4.22. Use featureEffect instead.
- DataFile deprecated since version 4.20. Use DataFile instead.
- DataLayer deprecated since version 4.20. Use DataLayer instead.
- decorators.cast(classFunction) deprecated since version 4.14. Parameter decorators won't be supported by JavaScript decorators.
- DensifyParameters deprecated since version 4.20. Use DensifyParameters instead.
- DirectionsFeatureSet deprecated since version 4.20. Use DirectionsFeatureSet instead.
- DistanceParameters deprecated since version 4.20. Use DistanceParameters instead.
- Editor.layerInfos.fieldConfig deprecated since version 4.22. Set the Editor's editable fields via layerInfo.formTemplate.elements and pass in either a FieldElement or GroupElement instead.
- Editor.supportingWidgetDefaults.featureForm.fieldConfig deprecated since version 4.22. Set the Editor's editable fields via layerInfos.formTemplate.elements and pass in either a FieldElement or GroupElement instead.
- Effect.Effect deprecated since version 4.21. Use Effect instead.
- FeatureEffect deprecated since version 4.22. Use esri/layers/support/FeatureEffect instead.
- FeatureFilter deprecated since version 4.22. Use esri/layers/support/FeatureFilter instead.
- FeatureFormViewModel.fieldConfig deprecated since version 4.16. Use FieldElement and/or GroupElement instead.
- FeatureLayerView.effect deprecated since version 4.22. Use featureEffect instead.
- FeatureSet deprecated since version 4.20. Use FeatureSet instead.
- FieldConfig.editorType deprecated since version 4.16
- FindParameters deprecated since version 4.20. Use FindParameters instead.
- FindResult deprecated since version 4.20. Use FindResult instead.
- FindTask deprecated since version 4.20. Use find instead.
- GeneralizeParameters deprecated since version 4.20. Use GeneralizeParameters instead.
- GeoJSONLayerView.effect deprecated since version 4.22. Use featureEffect instead.
- GeometryService deprecated since version 4.20. Use geometryService instead.
- Geoprocessor deprecated since version 4.20. Use geoprocessor instead.
- GPMessage deprecated since version 4.20. Use GPMessage instead.
- IdentifyParameters deprecated since version 4.20. Use IdentifyParameters instead.
- IdentifyResult deprecated since version 4.20. Use IdentifyResult instead.
- IdentifyTask deprecated since version 4.20. Use identify instead.
- ImageHistogramParameters deprecated since version 4.20. Use ImageHistogramParameters instead.
- ImageIdentifyParameters deprecated since version 4.20. Use ImageIdentifyParameters instead.
- ImageIdentifyResult deprecated since version 4.20. Use ImageIdentifyResult instead.
- ImageIdentifyTask deprecated since version 4.20. Use imageService instead.
- JobInfo deprecated since version 4.20. Use JobInfo instead.
- LabelClass.labelExpressionInfo.value deprecated since version 4.5. Use expression instead.
- LegendLayer deprecated since version 4.20. Use LegendLayer instead.
- LengthsParameters deprecated since version 4.20. Use LengthsParameters instead.
- LinearUnit deprecated since version 4.20. Use LinearUnit instead.
- Locator deprecated since version 4.20. Use locator instead.
- LocatorSearchSource.locator deprecated since version 4.22. Use url instead.
- MultipartColorRamp deprecated since version 4.20. Use MultipartColorRamp instead.
- NAMessage deprecated since version 4.20. Use NAMessage instead.
- OffsetParameters deprecated since version 4.20. Use OffsetParameters instead.
- OGCFeatureLayerView.effect deprecated since version 4.22. Use featureEffect instead.
- ParameterValue deprecated since version 4.20. Use ParameterValue instead.
- PointDrawAction.coordinates deprecated since version 4.19. Use vertices instead.
- Portal.createClosestFacilityTask deprecated since version 4.21.
- Portal.createGeometryService deprecated since version 4.21.
- Portal.createPrintTask deprecated since version 4.21.
- Portal.createRouteTask deprecated since version 4.21.
- Portal.createServiceAreaTask deprecated since version 4.21.
- PrintParameters deprecated since version 4.20. Use PrintParameters instead.
- PrintTask deprecated since version 4.20. Use print instead.
- PrintTemplate deprecated since version 4.20. Use PrintTemplate instead.
Printdeprecated since version 4.22. Instead, use TemplateOptions if using the Print widget, or PrintTemplate if calling print() directly.View Model.scale Enabled - ProjectParameters deprecated since version 4.20. Use ProjectParameters instead.
- promiseUtils.reject deprecated since version 4.19. Use the native Promise.reject() method instead.
- promiseUtils.resolve deprecated since version 4.19. Use the native Promise.resolve() method instead.
- Query deprecated since version 4.20. Use Query instead.
- QueryTask deprecated since version 4.20. Use query instead.
- RasterData deprecated since version 4.20. Use RasterData instead.
- RelationParameters deprecated since version 4.20. Use RelationParameters instead.
- RelationshipQuery deprecated since version 4.20. Use RelationshipQuery instead.
- RouteParameters deprecated since version 4.20. Use RouteParameters instead.
- RouteResult deprecated since version 4.20. Use RouteResult instead.
- RouteTask deprecated since version 4.20. Use route instead.
- SceneView.constraints.collision deprecated since version 4.8. Use Ground.navigationConstraint instead.
Searchdeprecated since version 4.22. Use SearchViewModel.defaultSymbols instead.View Model.default Symbol - ServiceAreaParameters deprecated since version 4.20. Use ServiceAreaParameters instead.
- ServiceAreaSolveResult deprecated since version 4.20. Use ServiceAreaSolveResult instead.
- ServiceAreaTask deprecated since version 4.20. Use serviceArea instead.
- StatisticDefinition deprecated since version 4.20. Use StatisticDefinition instead.
- StreamLayerView.effect deprecated since version 4.22. Use featureEffect instead.
- Task deprecated since version 4.20.
- TimeSlider.values deprecated since version 4.20. Use timeExtent instead.
- TimeSliderViewModel.values deprecated since version 4.20. Use timeExtent instead.
- TrimExtendParameters deprecated since version 4.20. Use TrimExtendParameters instead.
- WFSLayerView.effect deprecated since version 4.22. Use featureEffect instead.
- widget.renderable deprecated since version 4.19. All properties are automatically tracked now and don't need to be decorated with this decorator.
- The light-blue, dark-blue, light-green, dark-green, light-purple, dark-purple, light-red, dark-red are deprecated since 4.19. Please use
lightordarkinstead, or create your own theme. - The TimeSlider settings from a WebMap will no longer will automatically applied to the TimeSlider widget on initialization. Use the getPropertiesFromWebMap method instead.
Breaking changes
- Removed the public Widget view source code (.tsx) files for all out-of-the-box widgets. This change does not affect the ability to build custom widgets, extend the ViewModel or customize widget CSS.
- Attachment elements within popups no longer display
listas the default displayType. Instead oflist, it defaults toauto. - Originally released as beta in 4.20, the analysis layers
DirectandLine Measurement Layer Areahave been removed in favor of an upcoming implementation.Measurement Layer - Removed
justifyas a possible value for TextSymbol.horizontalAlignment. - The
basemapparameter in all smartMapping methods within theesri/smartfolder was deprecated at version 4.13 and is now replaced by theMapping/renderers viewparameter. - Updated the CoordinateConversion widget by removing the Geometry Service for cases when the coordinateFormatter didn't load due to using an outdated browser. The
requestproperty was removed from the CoordinateConversion widget and CoordinateConversionViewModel.Delay - Updated the request flow of workers so that an after interceptor receives the expected data type.
This means after interceptors that were expecting
array-buffersfor client-side layers such as GeoJSONLayer and CSVLayer will now receive the expected data typesjsonortext.
The following classes, methods, properties and events have been deprecated for at least 2 releases and have now been removed from the API:
| Class/Property/Method/Event | Alternate option | Version deprecated |
|---|---|---|
Chart | ChartMediaInfoValueSeries.value | 4.17 |
Chart | ChartMediaInfoValueSeries.tooltip | 4.17 |
decorators.declared() | declared is no longer needed to extend Accessor anymore. See Implementing Accessor for updated information. | 4.16 |
esri/layers/support/Attachment | esri/rest/query/support/AttachmentInfo | 4.19 |
Field | TextAreaInput or TextBoxInput | 4.16 |
params.color in univariateColorSize.createContinuousRenderer() | params.theme | 4.18 |
params.color in univariateColorSize.createContinuousRenderer() | params.legend | 4.18 |
params.size in univariateColorSize.createContinuousRenderer() | params.legend | 4.18 |
projection.is | projection.is is no longer needed since support for IE11 was removed at version 4.18. | 4.18 |
Slider.labels | Slider.visibleElements.labels | 4.15 |
Slider.range | Slider.visibleElements.rangeLabels | 4.15 |
Size | SizeVariable.valueExpression | 4.2 |
symbol | symbolUtils | 4.11 |
widget.@renderable | No alternative is required. | 4.19 |
Please refer to the Breaking changes guide topic for a complete list of breaking changes across all releases of the 4.x API.
Bug fixes and enhancements
- BUG-000114502: Fixed an issue where Directions widget did not allow users to add stops on iOS devices.
- BUG-000126231: Fixed an issue where a WMTSLayer would sometimes throw out of bounds requests when used in a SceneView.
- BUG-000126998: Fixed an issue where a WMTSLayer would display blurry tiles when resampled.
- BUG-000127497: Fixed an issue where PictureMarkerSymbol in a feature service had slight blurry texture when displayed in map.
- BUG-000129121: Fixed an issue where WMTSLayer would not redraw all tiles when zoomed in or out if the tiles did not exist at a particular level.
- BUG-000135115: Fixed an issue where TextSymbol with an angle property set was placed at incorrect locations.
- BUG-000135727: Fixed an issue with WMSLayer where the layer would not load if the spatial reference was not defined on the root layer in the service.
- BUG-000135884: Fixed an issue where FeatureTemplate.drawingTool would return the wrong string value if derived from a layer's subtypes.
- BUG-000137602: Fixed an issue where MapView.destroy() would throw errors if the map contained a layer with a different spatial reference than the view.
- BUG-000138336: Fixed an issue where the Popup widget wouldn't honor carriage returns (breaklines) in custom HTML content.
- BUG-000138393: Fixed an issue where Popup was displaying attributes of features that are not visible on the map.
- BUG-000140282: Fixed an issue where it was not possible to select a one-dimensional polygon using the Sketch widget.
- BUG-000140531: Fixed an issue where Multipoint graphics appeared cutoff at tile boundaries.
- BUG-000140562: Fixed an issue with hosting the API under a folder named 'esri'.
- BUG-000141053: Fixed an issue for poor graphic selection and movement experience for graphics with PictureMarkerSymbols and TextSymbols when using Sketch.
- BUG-000141133: Fixed an issue where workers were returning
array-buffersin an after interceptor for GeoJSONLayer. - BUG-000141451: Fixed an issue where ImageryTileLayer could be cropped when printed, depending on the browser window size or the
#viewdimensions.Div - BUG-000141462: Fixed an issue where the Print widget would show layers in the printed legend that were hidden in the map's legend.
- BUG-000142291: Content Security Policy issue addressed and a few instances of global
eval()functions were removed from the API. - BUG-000142543: Fixed an issue where the Print widget did not support
custom.Text Elements - BUG-000143043: Fixed an issue with WMTSLayer where duplicate parameters were being included in requests to the service.
- BUG-000143069: Fixed an issue where VectorTileLayer failed to display if it has style-layers with the same name but with different case sensitivity.
- BUG-000143284: Fixed an issue where a point FeatureLayerView's updating status remained
trueif the layer was not visible within the map view. - BUG-000143467: Fixed an issue where some point symbols were getting cut off at tile boundaries when panning or zooming in the map.
- BUG-000143654: Fixed an issue with the documentation for the Search widget using the deprecated
locatorproperty in code snippets. - BUG-000143660: Fixed an issue with the documentation for the Conversion class not having a constructor section.
- BUG-000144019: Fixed an issue where the observer position would not update the lines in Line of Sight widget when changed programmatically.
- BUG-000144099: Fixed an issue where the API key was not being sent for some basemaps with labels when printing.
- BUG-000144207: Fixed an issue where labels on client-side FeatureLayer did not load until there was an interaction with the view.
- BUG-000144287: Fixed an issue where printing client-side features using ClassBreaksRenderer failed to print labels.
- Esri Community - 1007866: Fixed an issue where CSVLayer.popupTemplate was not displaying a popup option for overlapping features if the csv file has a field called
Object.I D - Esri Community - 1101128: Fixed an issue where a CIMPictureMarker would not render when the URL was an
SVG. - Fixed an issue where a map was flashing when it was clicked if it had a VectorTileLayer with an effect.
- Fixed an issue where Layer.opacity was impacting the highlight opacity.
- Fixed an issue where the DirectionsFeatureSet.mergedGeometry had incorrect
hasandM hasvalues.Z - Fixed an issue where the View.timeExtent was not being honored by TimeSlider.timeExtent.
- Fixed an issue where the
-sign in latitude/longitude values were incorrectly displayed withrtllanguages in the CoordinateConversion widget. - ENH-000107617: Updated the LayerList widget with actions sample to demonstrate how to add an opacity slider to the LayerList widget.
- ENH-000126408: Added a support to refresh GeoJSONLayer and CSVLayer.
- ENH-000128160: Added a support to refresh GeoRSSLayer.
- ENH-000133610: Updated the Compass widget's tooltip to now display
Reset map orientationinstead ofReset compass orientation. - ENH-000137806: Added a support for customParameters on StreamLayer.
- ENH-000142044: Improved graphic selection and movement behavior for graphics with PictureMarkerSymbols and TextSymbols when using Sketch.
- ENH-000142792: Added better code snippets for the query documentation.
- Added
medianto SummaryStatisticsResult. - Enhanced the polygon labelPlacement behavior to better place labels in the center of a polygon.
- Enhanced the Print widget so that the map extent is preserved by default in the printout.
- Enhanced the WMTSLayer by adding support for the
Topparameter withinLeft Corner Tile.Matrix - Fixed an issue where the feature count within a Popup would overflow when adjusting a browser's zoom and window size.
- The ellipsis button no longer displays within a Popup if actions within it are not visible.
- When using ESM, the Editor widget no longer throws errors when creating a new feature and discarding edits.
Additional packages
Version 4.22 of the ArcGIS Maps SDK for JavaScript uses ArcGIS Arcade 1.16 (since 4.22).
Version 4.22 of the ArcGIS Maps SDK for JavaScript uses Calcite Design System (Beta), version 1.0.0-beta.69.
How to access the SDK
- The API library is available on both CDN and npm, Read more at Get started.
- For supported versions, you can also download both the documentation and the API library. These downloads are typically available 3-4 weeks after release.
Previous releases
- Version 4.29 - February 2024
- Version 4.28 - October 2023
- Version 4.27 - June 2023
- Version 4.26 - February 2023
- Version 4.25 - November 2022
- Version 4.24 - June 2022
- Version 4.23 - March 2022
- Version 4.22 - December 2021
- Version 4.21 - September 2021
- Version 4.20 - June 2021
- Version 4.19 - April 2021