import FeatureReductionCluster from "@arcgis/core/layers/support/FeatureReductionCluster.js";const FeatureReductionCluster = await $arcgis.import("@arcgis/core/layers/support/FeatureReductionCluster.js");- Inheritance:
- FeatureReductionCluster→
Accessor
- Since
- ArcGIS Maps SDK for JavaScript 4.14
Aggregates and summarizes dense features in a layer to clusters defined in screen space.
This feature reduction method spatially groups features into clusters based on an area of influence defined in screen space (i.e. the clusterRadius). By default, the size of each cluster is proportional to the number of features within the cluster.
Clustering is typically used to visualize large point layers, but may be used with any geometry type (since version 4.31). In the case of clustering polyline or polygon features, the centroid of the line or polygon is used to determine the cluster in which it is placed.
The renderer, labels, and popup of each cluster summarizes the features it represents.
This documentation refers to two kinds of features: aggregate features and individual features. Aggregate features represent clusters. When clustering points, if a feature does not belong to a cluster, it is rendered as an individual feature and therefore not represented as a cluster graphic. When clustering lines or polygons, individual features not belonging to a true cluster (of 2 or more features) are still represented as a cluster of size 1 according to the cluster renderer or symbol. This is so features exploding from clusters on zoom are clearly associated with the clustered layer.
Usage guidelines
- In the case of clustered points rendered with an auto generated
cluster renderer, if you want individual features to be smaller than the smallest clusters (two
features), then you need to adjust the size of the symbols in the
layer.rendererto sizes smaller than the clusterMinSize. - The clusterMaxSize and clusterRadius complement each other. If you adjust one, you should adjust the other (a larger
maxClusterSizeshould have a largerclusterRadius). - Turn off label deconfliction when labeling clusters with a count in the center of the cluster. If label placement is outside the cluster, keep label deconfliction enabled.
- Increase the clusterMinSize to fit labels inside smaller clusters (16pt is a good starting point when labels are visible).
- If the layer's renderer has a SizeVariable, increase the size of the smallest features (either in the variable stops, or
in the
minSizeproperty) to improve the cluster visualization, and so labels can fit inside the clusters. - If multiple label classes are set on
featureReduction.labelingInfo, set matching label classes on thelayer.labelingInfo, especially when a size visual variable is included in the renderer. This helps the end user differentiate between clusters and individual features.
Styles and configurations
The following section describes various auto generated cluster renderers created based on the layer's renderer. This only applies to clustering point features.
Read More
Simple Renderer
In the most basic scenario, where all points are styled with a SimpleRenderer and no visual variables, the cluster size will indicate the number of features within the cluster.
| Display all points | Display clustered features |
|---|---|
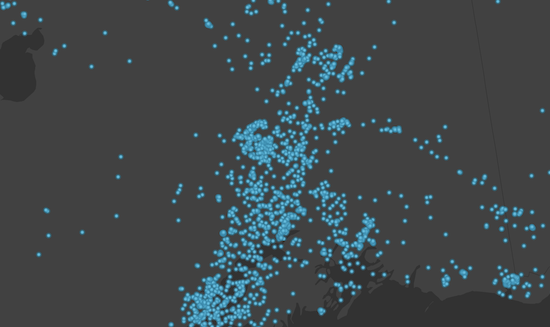 |  |
Visual Variables
When any numeric field is used by the renderer with one or more visual variables, the average value of that field will be used in the cluster symbology and made available to the developer in the popupTemplate.
In the example below, the layer representing weather stations is rendered with three visual variables: color, size, and rotation. When clustering is enabled, the average of each field from the visual variables is computed for the features within each cluster. The color, rotation, and size of the cluster is then applied to the cluster graphic according to the average value of each respective field for the visual variables of features in that cluster.
| Display all points | Display clustered features |
|---|---|
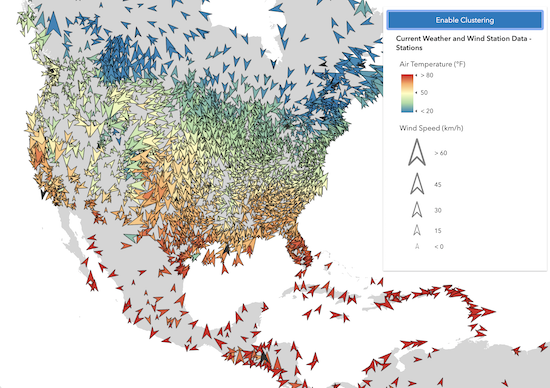 |  |
Unique Value Renderer
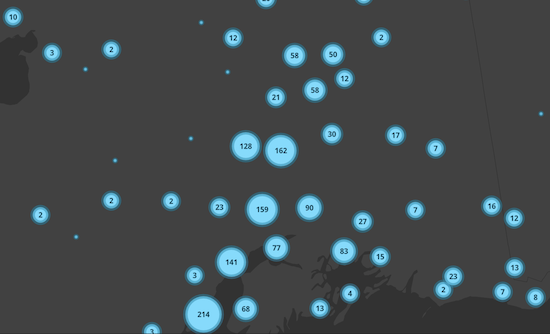
When a clustered layer contains a UniqueValueRenderer or a ClassBreaksRenderer, the clustered graphics are rendered with the symbol of the most common, or predominant, value of the uniqueValueInfos (or classBreakInfos) of the features represented by the cluster.
| Display all points | Display clustered features |
|---|---|
 |  |
Known Limitations
Clustering currently has the following limitations:
- Unlike point layers, clustered polyline or polygon features, do not have an auto generated renderer. You must define your own cluster renderer to view clustered line or polygon features. This renderer may only represent the clusters as marker symbols or pie charts.
- Not supported in 3D SceneView.
- Supported in FeatureLayer, CSVLayer, GeoJSONLayer, WFSLayer, and OGCFeatureLayer.
- Not supported in all other layer types, including MapImageLayer.
- Not supported for any layer with a HeatmapRenderer or a UniqueValueRenderer defined with multiple fields (i.e. field2, field3).
- Layer views with an applied FeatureEffect cannot be clustered.
Example
layer.featureReduction = { type: "cluster", clusterRadius: "120px", popupTemplate: { content: "This cluster represents <b>{cluster_count}</b> features.", fieldInfos: [{ fieldName: "cluster_count", format: { digitSeparator: true, places: 0 } }] }};Constructors
Constructor
Parameters
| Parameter | Type | Description | Required |
|---|---|---|---|
| properties | | |
Properties
| Property | Type | Class |
|---|---|---|
| | ||
| | ||
| | ||
declaredClass readonly inherited | ||
FieldConfiguration[] | null | undefined | | |
| | ||
LabelClass[] | null | undefined | | |
| | ||
| | ||
| | ||
| | ||
| | ||
| | ||
type readonly | "cluster" | |
clusterMaxSize
- Type
- number
- Since
- ArcGIS Maps SDK for JavaScript 4.16
Defines the symbol size of the largest cluster in points (or pixels if specified). Adjusting clusterMaxSize
generally should be considered if the clusterRadius is modified.
For example, if you prefer cluster icons to not overlap, then the clusterMaxSize
should be substantially smaller than the clusterRadius.
If a custom renderer is defined for cluster, and that renderer contains a SizeVariable, then this property is ignored and cluster sizes are determined using the renderer's size variable.
- See also
- Default value
- 37.5
Example
// clusterMaxSize should be adjusted// appropriately to conform// to the clusterRadiuslayer.featureReduction = { type: "cluster", clusterRadius: "50px", clusterMaxSize: "32px"}; clusterMinSize
- Type
- number
- Since
- ArcGIS Maps SDK for JavaScript 4.16
Defines the symbol size of the smallest cluster in points (or pixels if specified). If labeling clusters
with a count or some other information in the center of the cluster, then having a clusterMinSize
larger than the default is generally preferred.
Keep in mind that this size may be smaller than the symbol size of individual non-clustered features
in the layer. In that scenario, you should either reduce the size of the symbol(s) in the layer's renderer
or increase the clusterMinSize to be larger than the size of individual point symbols to avoid confusion
for the end user. This is most likely to happen when cluster size represents feature count.
If a custom renderer is defined for cluster, and that renderer contains a SizeVariable, then this property is ignored and cluster sizes are determined using the renderer's size variable.
- See also
- Default value
- 9
Example
// a larger clusterMinSize looks better when labels are enabledfeatureReduction.clusterMinSize = "24px";featureReduction.labelsVisible = true; clusterRadius
- Type
- number
Defines the radius in points (or pixels if specified) of the area in which multiple features will be grouped
and visualized as a single cluster. Adjusting clusterRadius
generally should be considered if the clusterMaxSize is modified.
For example, if you prefer cluster graphics to not overlap, then the clusterRadius
should be substantially larger than the clusterMaxSize.
- See also
- Default value
- 60
Examples
// enables clustering on the layer with a// clusterRadius of 40ptlayer.featureReduction = { type: "cluster", clusterRadius: 40, clusterMaxSize: 24};// enables clustering on the layer with a// clusterRadius of 120pxlayer.featureReduction = { type: "cluster", clusterRadius: "120px", clusterMaxSize: "80px"}; fieldConfigurations
- Type
- FieldConfiguration[] | null | undefined
- Since
- ArcGIS Maps SDK for JavaScript 5.0
An array of FieldConfiguration objects that control how fields are displayed in popups and other UI elements. Each object specifies options for an individual field, such as its display name, via alias, and formatting rules, via fieldFormat. For more information, see the FieldConfiguration documentation. These configurations will only be honored if the parent layer is a service-based FeatureLayer.
Support is limited in version 5.0. For details, see the FieldConfiguration documentation.
fields
- Type
- AggregateField[]
- Since
- ArcGIS Maps SDK for JavaScript 4.25
An array of aggregate fields that summarize layer FeatureLayer.fields from features contained within each cluster. These fields may be used by the popupTemplate, labelingInfo, and renderer.
Some fields are internally automatically created by the JS API's rendering engine for use in default cluster renderers (not set by the developer). The AggregateField.isAutoGenerated property indicates whether a field was internally created by the JS API. All auto-generated fields are read-only. They are discarded and replaced with new fields each time the user changes the underlying layer's renderer. Therefore, auto-generated fields should always be used with caution.
The table below describes the general rules for how the rendering engine names auto-generated aggregate fields.
| Field Name | Type | Description |
|---|---|---|
cluster_count | number | The number of features in the cluster. |
cluster_avg_{fieldName} | number | For renderers visualizing a number field either with size, opacity, continuous color, or class breaks, this field describes the average of the rendered field among all features in the cluster. |
cluster_type_{fieldName} | string | For layers with a UniqueValueRenderer, this field describes the mode, or predominant string of the rendered field among all features within the cluster. |
Example
featureReduction.fields = [{ name: "aggregateCount", statisticType: "count"}, { name: "SUM_population", onStatisticField: "population", statisticType: "sum"}, { name: "AVG_age", onStatisticField: "age", statisticType: "avg"}, { name: "AVG_population_density", alias: "Average population density", onStatisticExpression: { expression: "$feature.population / AreaGeodetic($feature, 'square-miles')", title: "population density", returnType: "number" }, statisticType: "avg"}]; labelingInfo
- Type
- LabelClass[] | null | undefined
- Since
- ArcGIS Maps SDK for JavaScript 4.16
Defines labels for clusters as an array of LabelClass. When set, labels independent of the layer.labelingInfo are used to convey information about the clusters, including the count of all features in the cluster, the average, or predominant values of fields mapped by the renderer.
Label expressions may only refer to aggregate fields defined in the fields property. Auto-generated fields may be used, but are at risk of being discarded if the underlying layer's renderer changes. See fields for more information.
It is advisable to turn off label deconfliction when labeling clusters with a count in the center of the cluster. To generate suggested labels for your cluster configuration based on the layer's renderer, see clusterLabelCreator.
Multiple Label classes with different where clauses can be used to define several
labels with varying styles on the same feature. Likewise, multiple label classes
may be used to label different types of clusters (e.g. blue labels
for small clusters and red labels for large ones).
- See also
Example
// Displays the count inside the clusterlayer.featureReduction = { type: "cluster", labelingInfo: [{ labelExpressionInfo: { expression: "$feature.cluster_count" }, deconflictionStrategy: "none", labelPlacement: "center-center", symbol: { type: "text", color: "white", font: { size: "12px" }, haloSize: 1, haloColor: "black" } }]}; labelsVisible
- Type
- boolean
- Since
- ArcGIS Maps SDK for JavaScript 4.16
Indicates whether to display labels for the clusters. If true, labels will
appear as defined in the labelingInfo property.
- Default value
- true
Example
// Turns off cluster labels, but preserves labelingInfoconst featureReduction = layer.featureReduction.clone();featureReduction.labelsVisible = false;layer.featureReduction = featureReduction; maxScale
- Type
- number
- Since
- ArcGIS Maps SDK for JavaScript 4.26
Defines the maximum view scale at which clustering is enabled.
If the user zooms in beyond the scale specified here, clustering will be disabled and
only individual features will be displayed in the view.
Once the user zooms out past this scale, clustering will be re-enabled.
A value of 0 means clustering is always enabled, and therefore clusters may be visible at
any view scale.
- Default value
- 0
Example
// clustering is disabled when the user zooms// in beyond a 1:50,000 view scalelayer.featureReduction = { type: "cluster", maxScale: 50000}; popupEnabled
- Type
- boolean
- Since
- ArcGIS Maps SDK for JavaScript 4.16
Indicates whether to display the cluster popup. If true, popups will
open when the user clicks or taps a cluster. If false, the popup as defined
in the popupTemplate will be persisted, but won't be displayed
on click/tap.
- Default value
- true
Example
// Turns off cluster popups, but preserves popupTemplateconst featureReduction = layer.featureReduction.clone();featureReduction.popupEnabled = false;layer.featureReduction = featureReduction; popupTemplate
- Type
- PopupTemplate | null | undefined
The PopupTemplate to apply to clustered graphics. When set, a popupTemplate independent of the layer.popupTemplate is used. This popup can display summary information for the cluster, including the count of all features in the cluster and the average or predominant values of fields mapped by the renderer.
To generate a suggested predefined popup template for your cluster configuration based on the layer's renderer, see clusterPopupTemplateCreator.
The PopupTemplate may contain one or more Arcade expressions following
the specification defined by the Arcade Feature Reduction Popup Profile.
Expressions must return a string or a number and may access data values from the cluster and its aggregated features
with the $feature and $aggregatedFeatures profile variables.
Popup expressions may only refer to aggregate fields defined in the fields property. Auto-generated fields may be used, but are at risk of being discarded if the underlying layer's renderer changes. See fields for more information about this behavior.
The following popupTemplate configurations will display the popups shown in the images below.
Cluster count
layer.featureReduction = { type: "cluster", popupTemplate: { content: "This cluster represents {cluster_count} earthquakes." }};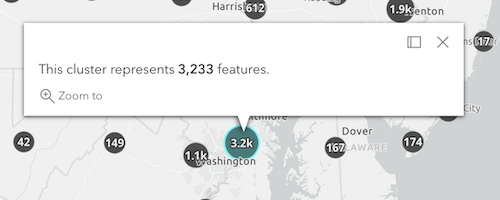
Clusters by predominant type
The following featureReduction configuration assumes the layer's renderer is a UniqueValueRenderer
who's field is named religion.
layer.featureReduction = { type: "cluster", popupTemplate: { content: [{ type: "text", text: "This cluster represents <b>{cluster_count}</b> features." }, { type: "text", text: "The predominant place of worship in this cluster is <b>{cluster_type_religion}</b>." }] }};
Clusters with visual variables
The following featureReduction configuration assumes the layer's renderer contains visual variables
referencing fields named WIND_SPEED, WIND_DIRECT, TEMP.
layer.featureReduction = { type: "cluster", popupTemplate: { content: [{ type: "text", text: "This cluster represents <b>{cluster_count}</b> weather stations." }, { type: "fields", fieldInfos: [{ fieldName: "cluster_avg_WIND_SPEED", label: "Average wind speed (km/h)", format: { places: 0 } }, { fieldName: "cluster_avg_WIND_DIRECT", label: "Average wind direction (degrees)", format: { places: 0 } }, { fieldName: "cluster_avg_TEMP", label: "Average temperature (°F)", format: { places: 0 } }] }] }};
Examples
// enables clustering on the layer with a// popup describing the number of features represented by each clusterlayer.featureReduction = { type: "cluster", popupTemplate: { content: "This cluster represents <b>{cluster_count}</b> features." fieldInfos: [{ fieldName: "cluster_count", format: { digitSeparator: true, places: 0 } }] }};// enables clustering on the layer with a// popup describing the average value of// the field mapped by the renderer
layer.renderer = { type: "simple", symbol: { type: "simple-marker", size: 8 }, label: "Weather stations", visualVariables: [ { type: "color", field: "Temperature", stops: [ { value: 32, color: "blue", label: "< 32° F" }, { value: 90, color: "red", label: ">90° F" } ] } ]};layer.featureReduction = { type: "cluster", popupTemplate: { content: [{ type: "text", text: "This cluster represents <b>{cluster_count}</b> features." }, { type: "text", text: "The average temperature in this cluster is <b>{cluster_avg_Temperature}° F</b>." }], fieldInfos: [{ fieldName: "cluster_count", format: { digitSeparator: true, places: 0 } }, { fieldName: "cluster_avg_Temperature", format: { places: 1 } }] }};// Displays an ordered list of the top 5 categories// of features contained within the clusterlayer.popupTemplate = { title: "Power plant summary", content: [{ type: "expression", // lists the top 5 most common fuel types in the cluster expressionInfo: { expression: ` Expects($aggregatedFeatures, "fuel1")
var statsFS = GroupBy($aggregatedFeatures, [ { name: 'Type', expression: 'fuel1'}, ], [ { name: 'num_features', expression: '1', statistic: 'COUNT' } ] ); var ordered = Top(OrderBy(statsFs, 'num_features DESC'), 5);
// create an HTML ordered list as a string and return in a rich text element var list = "<ol>";
for (var group in ordered){ list += \`<li>\${group.Type} (\${Text(group.num_features, "#,###")})</li>\` } list += "</ol>";
return { type: "text", text: list } `, title: "List of fuel types" } }]}; renderer
- Type
- RendererUnion | null | undefined
- Since
- ArcGIS Maps SDK for JavaScript 4.25
The renderer used to override the default style of the clusters. All fields used by this renderer must be AggregateFields defined in the fields property of this class.
For points, the default cluster style is inferred by the underlying layer's renderer. Each cluster will be styled with a symbol summarizing the points included in the cluster based on the underlying layer's renderer configuration. See Styles and configurations for more information about this behavior. In this scenario, the renderer will be persisted when the layer is saved to the web map, but it will be flagged as "auto generated" in the AuthoringInfo.isAutoGenerated property of the the Renderer.authoringInfo object. All auto generated renderers are discarded and replaced each time the underlying layer's renderer is changed.
This property allows you to override the auto generated cluster styling using any
renderer type suitable for point geometries. For example, if you want to render clusters
as pie charts, you can define a PieChartRenderer in
this property. Custom renderers set on this property are not discarded when the underlying layer's
renderer changes. Setting this property to null will cause clusters to render using the auto-generated renderer based on the layer's renderer.
Defining a renderer here will override the symbols of all aggregate and individual features in the view. If you want to define a dedicated cluster symbol, but retain the layer's renderer for individual features, then use the symbol property (for point layers only).
For polyline and polygon layers, you must define a renderer with marker symbols (or pie charts) to display clusters as there is no auto generated cluster renderer for these geometry types.
The following rendering rules apply to cluster renderers:
- If a renderer does not contain a SizeVariable, then
clusterMinSize and clusterMaxSize are used to automatically size clusters based
on the cluster count at each view scale level. The
clusterMinSizeandclusterMaxSizeproperties only control the sizes of clusters, not individual features. Individual features are sized based on their respective symbols defined in the renderer. - If a SizeVariable is present in the renderer, then
clusterMinSizeandclusterMaxSizeare ignored. The size variable controls the size of both clusters and individual features. - Any renderer defined here overrides the symbols of all aggregate and individual features in the view. Symbol sizes in the renderer will apply to individual features, but not aggregate features. Therefore, symbol sizes should generally be less than or equal to the
clusterMinSizeif no size variable is present. - If no renderer is defined, then a default renderer is used (and persisted in the web map) in this property.
- If defined alongside a defined symbol, then the renderer will always override the symbol.
- When a cluster
rendereris defined, individual features are always rendered with the symbols of the cluster renderer, even for polygon and polyline layers. Therefore, individual line and polygon features will display as marker symbols according to the renderer.
- See also
Examples
// colors clusters along a continuous gradient based on their cluster_countfeatureReduction.clusterMinSize = 16;featureReduction.clusterMaxSize = 16;featureReduction.renderer = { type: "simple", // autocasts as new SimpleRenderer() symbol: { type: "simple-fill", // autocasts as new SimpleFillSymbol() outline: { // autocasts as new SimpleLineSymbol() width: 0.5, color: "white" } }, visualVariables: [{ type: "color", field: "cluster_count", stops: [ { value: 1, color: "white" }, { value: 1000, color: "blue" } ] }]};// sets the cluster renderer to the default style, which// is inferred by the underlying layer's renderer.featureReduction.renderer = null; symbol
- Type
- PictureMarkerSymbol | SimpleMarkerSymbol | TextSymbol | WebStyleSymbol | CIMSymbol | null | undefined
- Since
- ArcGIS Maps SDK for JavaScript 4.25
A symbol used to override the default cluster style. Unlike the renderer property, this symbol doesn't affect individual features (i.e. clusters of size 1). Use this property to create a dedicated cluster symbol while retaining the symbology of individual features.
This property is only applicable to point layers. For polyline and polygon layers, you must define a renderer with marker symbols (or pie charts) to display clusters.
Example
featureReduction.symbol = { type: "simple-marker", color: "yellow", style: "square", outline: { width: 4, color: "orange" }};Methods
| Method | Signature | Class |
|---|---|---|
fromJSON inherited static | fromJSON(json: any): any | |
clone inherited | clone(): this | |
getField(fieldName: string): AggregateField | null | undefined | | |
getFieldAlias(fieldName: string): string | null | undefined | | |
getFieldConfiguration(fieldName: string): FieldConfiguration | null | undefined | | |
toJSON inherited | toJSON(): any |
fromJSON
- Signature
-
fromJSON (json: any): any
Creates a new instance of this class and initializes it with values from a JSON object
generated from an ArcGIS product. The object passed into the input json
parameter often comes from a response to a query operation in the REST API or a
toJSON()
method from another ArcGIS product. See the Using fromJSON()
topic in the Guide for details and examples of when and how to use this function.
Parameters
| Parameter | Type | Description | Required |
|---|---|---|---|
| json | A JSON representation of the instance in the ArcGIS format. See the ArcGIS REST API documentation for examples of the structure of various input JSON objects. | |
- Returns
- any
Returns a new instance of this class.
clone
- Signature
-
clone (): this
Creates a deep clone of this object. Any properties that store values by reference will be assigned copies of the referenced values on the cloned instance.
- Returns
- this
A deep clone of the class instance that invoked this method.
getField
- Signature
-
getField (fieldName: string): AggregateField | null | undefined
- Since
- ArcGIS Maps SDK for JavaScript 5.0
Returns the AggregateField instance for a field name (case-insensitive).
- See also
Parameters
| Parameter | Type | Description | Required |
|---|---|---|---|
| fieldName | The name of the field. | |
- Returns
- AggregateField | null | undefined
The matching field or
undefined.
getFieldAlias
- Signature
-
getFieldAlias (fieldName: string): string | null | undefined
- Since
- ArcGIS Maps SDK for JavaScript 5.0
Returns the alias of the specified field.
The alias is resolved in the following order:
- Field configuration alias
- AggregateField.alias defined on the field.
getFieldConfiguration
- Signature
-
getFieldConfiguration (fieldName: string): FieldConfiguration | null | undefined
- Since
- ArcGIS Maps SDK for JavaScript 5.0
Returns the FieldConfigurations for the specified field. The field configuration provides optional formatting and display information for the field.
Previously, field formatting was commonly retrieved from FeatureLayer.popupTemplate.fieldInfos[x].format. This is no longer needed, instead use FeatureReductionCluster.getFieldConfiguration(fieldname).fieldFormat to retrieve the field configuration formatting.
Parameters
| Parameter | Type | Description | Required |
|---|---|---|---|
| fieldName | The name of the field. | |
- Returns
- FieldConfiguration | null | undefined
The field configuration of the specified field.
toJSON
- Signature
-
toJSON (): any
Converts an instance of this class to its ArcGIS portal JSON representation. See the Using fromJSON() guide topic for more information.
- Returns
- any
The ArcGIS portal JSON representation of an instance of this class.