Display data from an ArcGIS stream service using a dynamic entity layer.
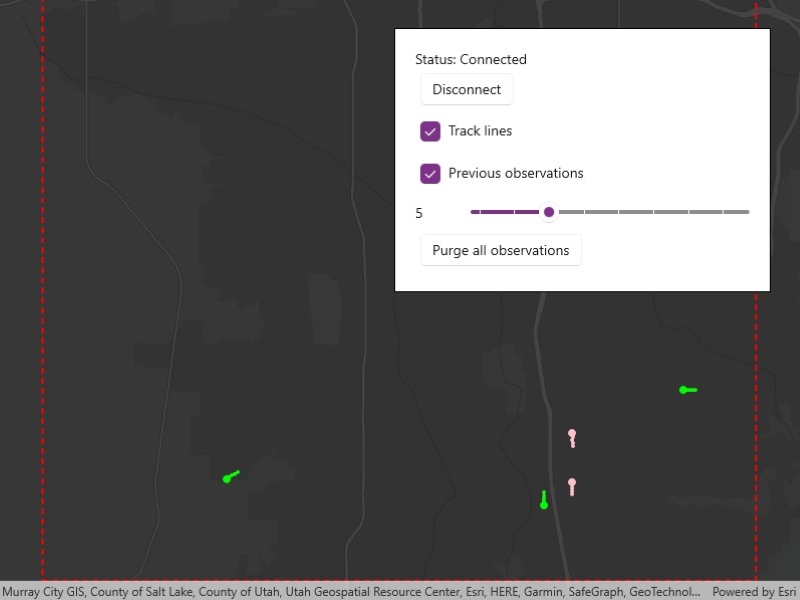
Use case
A stream service is a type of service provided by ArcGIS Velocity and GeoEvent Server that allows clients to receive a stream of data observations via a web socket. ArcGIS Maps SDK for .NET allows you to connect to a stream service and manage the information as dynamic entities and display them in a dynamic entity layer. Displaying information from feeds such as a stream service is important in applications like dashboards where users need to visualize and track updates of real-world objects in real-time.
Use
to manage the connection to the stream service and purge options to manage how much data is stored and maintained by the application. The dynamic entity layer will display the latest received observation, and you can set track display properties to determine how to display historical information for each dynamic entity. This includes the number of previous observations to show, whether to display track lines in-between previous observations, and setting renderers.How to use the sample
Use the controls to connect to or disconnect from the stream service, modify display properties in the dynamic entity layer, and purge all observations from the application.
How it works
- Create an using a .
- Set a on the stream service to limit the amount of data coming from the server.
- Set the property of the stream service to limit the amount of data managed by the application.
- Create a using the stream service.
- Update values in the layer’s to customize the layer’s appearance.
- Add the to the map.
Relevant API
- ArcGISStreamService
- ArcGISStreamServiceFilter
- ConnectionStatus
- DynamicEntity
- DynamicEntityLayer
- DynamicEntityPurgeOptions
- TrackDisplayProperties
About the data
This sample uses a stream service that simulates live data coming from snowplows near Sandy, Utah. There are multiple vehicle types and multiple agencies operating the snowplows.
Additional information
More information about dynamic entities can be found in the guide documentation.
Tags
data, dynamic, entity, live, purge, real-time, service, stream, track
Sample Code
<UserControl x:Class="ArcGIS.WinUI.Samples.AddDynamicEntityLayer.AddDynamicEntityLayer" xmlns="http://schemas.microsoft.com/winfx/2006/xaml/presentation" xmlns:x="http://schemas.microsoft.com/winfx/2006/xaml" xmlns:esriUI="using:Esri.ArcGISRuntime.UI.Controls"> <Grid> <esriUI:MapView x:Name="MyMapView" /> <Border x:Name="MainUI" Style="{StaticResource BorderStyle}"> <StackPanel> <TextBlock Name="ConnectionStatusLabel" /> <Button x:Name="ConnectionButton" Margin="5" Click="ConnectionButton_Click" IsEnabled="False" /> <CheckBox Margin="5" Checked="LineVisibilityCheckbox_Checked" Content="Track lines" IsChecked="True" Unchecked="LineVisibilityCheckbox_Checked" /> <CheckBox Margin="5" Checked="EntityVisibilityCheckbox_Checked" Content="Previous observations" IsChecked="True" Unchecked="EntityVisibilityCheckbox_Checked" /> <TextBlock Grid.Column="0" Text="Previous observations per track:" /> <Grid> <Grid.ColumnDefinitions> <ColumnDefinition Width="0.2*" /> <ColumnDefinition Width="*" /> </Grid.ColumnDefinitions> <TextBlock Grid.Column="0" HorizontalAlignment="Center" VerticalAlignment="Center" Text="{Binding ElementName=EntitiesSlider, Path=Value}" /> <Slider Name="EntitiesSlider" Grid.Column="1" VerticalAlignment="Center" Maximum="16" Minimum="1" TickFrequency="1" ValueChanged="Slider_ValueChanged" Value="5" /> </Grid> <Button Margin="5" Click="PurgeButton_Click" Content="Purge all observations" /> </StackPanel> </Border> </Grid></UserControl>// Copyright 2023 Esri.//// Licensed under the Apache License, Version 2.0 (the "License"); you may not use this file except in compliance with the License.// You may obtain a copy of the License at: http://www.apache.org/licenses/LICENSE-2.0//// Unless required by applicable law or agreed to in writing, software distributed under the License is distributed on an// "AS IS" BASIS, WITHOUT WARRANTIES OR CONDITIONS OF ANY KIND, either express or implied. See the License for the specific// language governing permissions and limitations under the License.
using Esri.ArcGISRuntime.Geometry;using Esri.ArcGISRuntime.Mapping;using Esri.ArcGISRuntime.RealTime;using Esri.ArcGISRuntime.Symbology;using Esri.ArcGISRuntime.UI;using Microsoft.UI.Xaml;using Microsoft.UI.Xaml.Controls;using Microsoft.UI.Xaml.Controls.Primitives;using System;using System.Collections.Generic;
namespace ArcGIS.WinUI.Samples.AddDynamicEntityLayer{ [ArcGIS.Samples.Shared.Attributes.Sample( name: "Add dynamic entity layer", category: "Layers", description: "Display data from an ArcGIS stream service using a dynamic entity layer.", instructions: "Use the controls to connect to or disconnect from the stream service, modify display properties in the dynamic entity layer, and purge all observations from the application.", tags: new[] { "data", "dynamic", "entity", "live", "purge", "real-time", "service", "stream", "track" })] public partial class AddDynamicEntityLayer { // This envelope is a limited region around Sandy, Utah. It will be the extent used by the ArcGISStreamServiceFilter. private Envelope _utahSandyEnvelope = new Envelope(new MapPoint(-112.110052, 40.718083, SpatialReferences.Wgs84), new MapPoint(-111.814782, 40.535247, SpatialReferences.Wgs84));
private ArcGISStreamService _dynamicEntityDataSource; private DynamicEntityLayer _dynamicEntityLayer;
public AddDynamicEntityLayer() { InitializeComponent(); Initialize(); }
private void Initialize() { MyMapView.Map = new Map(BasemapStyle.ArcGISDarkGrayBase);
// Create a border line and display it on the map. This line symbolizes the filter extent. var borderOverlay = new GraphicsOverlay(); borderOverlay.Graphics.Add(new Graphic(_utahSandyEnvelope, new SimpleLineSymbol(SimpleLineSymbolStyle.Dash, System.Drawing.Color.Red, 2))); MyMapView.GraphicsOverlays.Add(borderOverlay); MyMapView.SetViewpoint(new Viewpoint(_utahSandyEnvelope));
// Create the stream service. A stream service is one type of dynamic entity data source. var streamServiceUrl = "https://realtimegis2016.esri.com:6443/arcgis/rest/services/SandyVehicles/StreamServer"; _dynamicEntityDataSource = new ArcGISStreamService(new Uri(streamServiceUrl));
// Add a filter for the data source, to limit the amount of data received by the application. _dynamicEntityDataSource.Filter = new ArcGISStreamServiceFilter() { // Filter with an envelope. Geometry = _utahSandyEnvelope,
// Use a where clause to filter by attribute values. WhereClause = "speed > 0" };
// Set a duration for how long observation data is stored in the data source. Dynamic entity observations older than five minutes will be discarded. _dynamicEntityDataSource.PurgeOptions.MaximumDuration = TimeSpan.FromMinutes(5);
// Handle notifications about connection status. _dynamicEntityDataSource.ConnectionStatusChanged += ServiceConnectionStatusChanged;
// Create a layer to display the data from the stream service. _dynamicEntityLayer = new DynamicEntityLayer(_dynamicEntityDataSource);
_dynamicEntityLayer.TrackDisplayProperties.ShowPreviousObservations = true; _dynamicEntityLayer.TrackDisplayProperties.ShowTrackLine = true;
// Create renderers for the observations and their track lines. // Create a unique value renderer for the latest observations. var entityValues = new List<UniqueValue>();
// The agency attribute has agencies represented by the values "3" and "4". entityValues.Add(new UniqueValue(string.Empty, string.Empty, new SimpleMarkerSymbol(SimpleMarkerSymbolStyle.Circle, System.Drawing.Color.Pink, 8), 3)); entityValues.Add(new UniqueValue(string.Empty, string.Empty, new SimpleMarkerSymbol(SimpleMarkerSymbolStyle.Circle, System.Drawing.Color.Lime, 8), 4)); var entityRenderer = new UniqueValueRenderer(new List<string> { "agency" }, entityValues, string.Empty, new SimpleMarkerSymbol(SimpleMarkerSymbolStyle.Circle, System.Drawing.Color.Blue, 8)); _dynamicEntityLayer.Renderer = entityRenderer;
// Create a unique value renderer for the track observations. var trackValues = new List<UniqueValue>(); trackValues.Add(new UniqueValue(string.Empty, string.Empty, new SimpleMarkerSymbol(SimpleMarkerSymbolStyle.Circle, System.Drawing.Color.Pink, 3), 3)); trackValues.Add(new UniqueValue(string.Empty, string.Empty, new SimpleMarkerSymbol(SimpleMarkerSymbolStyle.Circle, System.Drawing.Color.Lime, 3), 4)); var trackRenderer = new UniqueValueRenderer(new List<string> { "agency" }, trackValues, string.Empty, new SimpleMarkerSymbol(SimpleMarkerSymbolStyle.Circle, System.Drawing.Color.Blue, 3)); _dynamicEntityLayer.TrackDisplayProperties.PreviousObservationRenderer = trackRenderer;
// Create a simple line renderer for the track lines. var lineRenderer = new SimpleRenderer(new SimpleLineSymbol(SimpleLineSymbolStyle.Solid, System.Drawing.Color.LightGray, 2)); _dynamicEntityLayer.TrackDisplayProperties.TrackLineRenderer = lineRenderer;
// Add the dynamic entity layer to the map. MyMapView.Map.OperationalLayers.Add(_dynamicEntityLayer); }
private void ServiceConnectionStatusChanged(object sender, ConnectionStatus status) { // This code needs to work with the UI, so it needs to run on the UI thread. DispatcherQueue.TryEnqueue(Microsoft.UI.Dispatching.DispatcherQueuePriority.Normal, () => { ConnectionStatusLabel.Text = $"Status: {status}"; ConnectionButton.IsEnabled = false;
if (status == ConnectionStatus.Connected) { ConnectionButton.IsEnabled = true; ConnectionButton.Content = "Disconnect"; } else if (status == ConnectionStatus.Disconnected) { ConnectionButton.IsEnabled = true; ConnectionButton.Content = "Connect"; } }); }
private void LineVisibilityCheckbox_Checked(object sender, RoutedEventArgs e) { if (_dynamicEntityLayer != null && sender is CheckBox checkBox) { _dynamicEntityLayer.TrackDisplayProperties.ShowTrackLine = checkBox.IsChecked == true; } }
private void EntityVisibilityCheckbox_Checked(object sender, RoutedEventArgs e) { if (_dynamicEntityLayer != null && sender is CheckBox checkBox) { _dynamicEntityLayer.TrackDisplayProperties.ShowPreviousObservations = checkBox.IsChecked == true; } }
private void PurgeButton_Click(object sender, RoutedEventArgs e) { _dynamicEntityDataSource?.PurgeAllAsync(); }
private void Slider_ValueChanged(object sender, RangeBaseValueChangedEventArgs e) { if (_dynamicEntityLayer != null) { _dynamicEntityLayer.TrackDisplayProperties.MaximumObservations = (int)e.NewValue; } }
private void ConnectionButton_Click(object sender, RoutedEventArgs e) { if (_dynamicEntityDataSource.ConnectionStatus == ConnectionStatus.Connected) { _dynamicEntityDataSource.DisconnectAsync(); } else if (_dynamicEntityDataSource.ConnectionStatus == ConnectionStatus.Disconnected) { _dynamicEntityDataSource.ConnectAsync(); } } }}