Find features in a sublayer based on attributes and location.
Use case
Sublayers of an
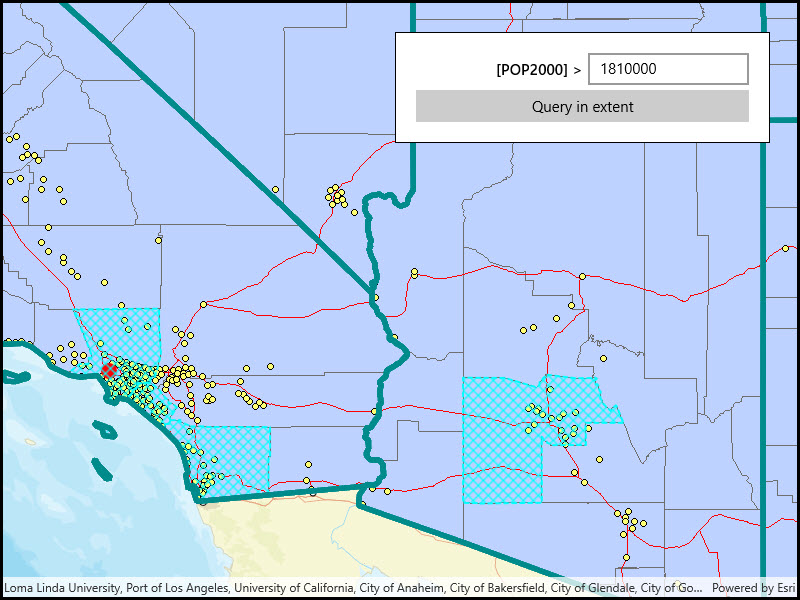
may expose a through a property. This allows you to perform the same queries available when working with a table from a : attribute query, spatial query, statistics query, query for related features, etc. An image layer with a sublayer of counties can be queried by population to only show those above a minimum population.How to use the sample
Specify a minimum population in the input field (values under 1810000 will produce a selection in all layers) and click the query button to query the sublayers in the current view extent. After a short time, the results for each sublayer will appear as graphics.
How it works
- Create an object using the URL of an image service.
- After loading the layer, get the sublayer you want to query with .
- Load the sublayer, and then get its with .
- Create . You can set to query against a table attribute and/or set to limit the results to an area of the map.
- Call to get a with features matching the query. The result is an iterable of features.
Relevant API
- ArcGISMapImageLayer
- ArcGISMapImageSublayer
- QueryParameters
- ServiceFeatureTable
About the data
The
in the map uses the “USA” map service as its data source. This service is hosted by ArcGIS Online, and is composed of four sublayers: “states”, “counties”, “cities”, and “highways”. Since the , , and tables all have a field, they can all execute a query against that attribute and a map extent.Tags
search and query
Sample Code
<UserControl x:Class="ArcGIS.WinUI.Samples.MapImageSublayerQuery.MapImageSublayerQuery" xmlns="http://schemas.microsoft.com/winfx/2006/xaml/presentation" xmlns:x="http://schemas.microsoft.com/winfx/2006/xaml" xmlns:esriUI="using:Esri.ArcGISRuntime.UI.Controls"> <Grid> <esriUI:MapView x:Name="MyMapView" /> <Border Style="{StaticResource BorderStyle}"> <Grid> <Grid.RowDefinitions> <RowDefinition /> <RowDefinition /> <RowDefinition /> </Grid.RowDefinitions> <Grid.ColumnDefinitions> <ColumnDefinition /> <ColumnDefinition /> </Grid.ColumnDefinitions> <TextBlock Grid.Row="0" Grid.Column="0" Margin="0,0,0,5" HorizontalAlignment="Right" VerticalAlignment="Center" FontWeight="SemiBold" Text="[POP2000] > " /> <TextBox x:Name="PopulationTextBox" Grid.Row="0" Grid.Column="1" Margin="5,0,0,5" HorizontalAlignment="Stretch" VerticalAlignment="Center" HorizontalContentAlignment="Right" Text="1810000" /> <Button x:Name="QuerySublayers" Grid.Row="2" Grid.Column="0" Grid.ColumnSpan="2" HorizontalAlignment="Stretch" Click="QuerySublayers_Click" Content="Query in extent" /> </Grid> </Border> </Grid></UserControl>// Copyright 2018 Esri.//// Licensed under the Apache License, Version 2.0 (the "License"); you may not use this file except in compliance with the License.// You may obtain a copy of the License at: http://www.apache.org/licenses/LICENSE-2.0//// Unless required by applicable law or agreed to in writing, software distributed under the License is distributed on an// "AS IS" BASIS, WITHOUT WARRANTIES OR CONDITIONS OF ANY KIND, either express or implied. See the License for the specific// language governing permissions and limitations under the License.
using Esri.ArcGISRuntime.Data;using Esri.ArcGISRuntime.Geometry;using Esri.ArcGISRuntime.Mapping;using Esri.ArcGISRuntime.Symbology;using Esri.ArcGISRuntime.UI;using Microsoft.UI.Xaml;using System;using System.Drawing;
namespace ArcGIS.WinUI.Samples.MapImageSublayerQuery{ [ArcGIS.Samples.Shared.Attributes.Sample( name: "Query map image sublayer", category: "Layers", description: "Find features in a sublayer based on attributes and location.", instructions: "Specify a minimum population in the input field (values under 1810000 will produce a selection in all layers) and click the query button to query the sublayers in the current view extent. After a short time, the results for each sublayer will appear as graphics.", tags: new[] { "search and query" })] public partial class MapImageSublayerQuery { // Use a private variable to reference the graphics overlay for showing selected features. private GraphicsOverlay _selectedFeaturesOverlay;
public MapImageSublayerQuery() { InitializeComponent();
// Initialize the map to show the USA map image layer. Initialize(); }
private void Initialize() { // Create a new Map with a vector streets basemap. Map myMap = new Map(BasemapStyle.ArcGISStreets);
// Create and set the map's initial view point. MapPoint initialLocation = new MapPoint(-12716000.00, 4170400.00, SpatialReferences.WebMercator); myMap.InitialViewpoint = new Viewpoint(initialLocation, 6000000);
// Create the URI to the USA map service. Uri usaServiceUri = new Uri("https://sampleserver6.arcgisonline.com/arcgis/rest/services/USA/MapServer");
// Create a new ArcGISMapImageLayer that uses the service URI. ArcGISMapImageLayer usaMapImageLayer = new ArcGISMapImageLayer(usaServiceUri);
// Add the layer to the map. myMap.OperationalLayers.Add(usaMapImageLayer);
// Assign the map to the MapView. MyMapView.Map = myMap;
// Add a graphics overlay to show selected features. _selectedFeaturesOverlay = new GraphicsOverlay(); MyMapView.GraphicsOverlays.Add(_selectedFeaturesOverlay); }
private async void QuerySublayers_Click(object sender, RoutedEventArgs e) { // Clear selected features from the graphics overlay. _selectedFeaturesOverlay.Graphics.Clear();
// If the population value entered is not numeric, warn the user and exit. double populationNumber = 0.0; if (!double.TryParse(PopulationTextBox.Text.Trim(), out populationNumber)) { var dialog = new MessageDialog2("The population value must be numeric.", "Query error"); _ = dialog.ShowAsync(); return; }
// Get the USA map image layer (the first and only operational layer in the map). ArcGISMapImageLayer usaMapImageLayer = (ArcGISMapImageLayer)MyMapView.Map.OperationalLayers[0];
try { // Use a utility method on the map image layer to load all the sublayers and tables. await usaMapImageLayer.LoadTablesAndLayersAsync();
// Get the sublayers of interest (skip 'Highways' since it doesn't have the POP2000 field). ArcGISMapImageSublayer citiesSublayer = (ArcGISMapImageSublayer)usaMapImageLayer.Sublayers[0]; ArcGISMapImageSublayer statesSublayer = (ArcGISMapImageSublayer)usaMapImageLayer.Sublayers[2]; ArcGISMapImageSublayer countiesSublayer = (ArcGISMapImageSublayer)usaMapImageLayer.Sublayers[3];
// Get the service feature table for each of the sublayers. ServiceFeatureTable citiesTable = citiesSublayer.Table; ServiceFeatureTable statesTable = statesSublayer.Table; ServiceFeatureTable countiesTable = countiesSublayer.Table;
// Create the query parameters that will find features in the current extent with a population greater than the value entered. QueryParameters populationQuery = new QueryParameters { WhereClause = "POP2000 > " + PopulationTextBox.Text, Geometry = MyMapView.GetCurrentViewpoint(ViewpointType.BoundingGeometry).TargetGeometry };
// Query each of the sublayers with the query parameters. FeatureQueryResult citiesQueryResult = await citiesTable.QueryFeaturesAsync(populationQuery); FeatureQueryResult statesQueryResult = await statesTable.QueryFeaturesAsync(populationQuery); FeatureQueryResult countiesQueryResult = await countiesTable.QueryFeaturesAsync(populationQuery);
// Display the selected cities in the graphics overlay. SimpleMarkerSymbol citySymbol = new SimpleMarkerSymbol(SimpleMarkerSymbolStyle.Circle, Color.Red, 16); foreach (Feature city in citiesQueryResult) { Graphic cityGraphic = new Graphic(city.Geometry, citySymbol);
_selectedFeaturesOverlay.Graphics.Add(cityGraphic); }
// Display the selected counties in the graphics overlay. SimpleLineSymbol countyLineSymbol = new SimpleLineSymbol(SimpleLineSymbolStyle.Dash, Color.Cyan, 2); SimpleFillSymbol countySymbol = new SimpleFillSymbol(SimpleFillSymbolStyle.DiagonalCross, Color.Cyan, countyLineSymbol); foreach (Feature county in countiesQueryResult) { Graphic countyGraphic = new Graphic(county.Geometry, countySymbol);
_selectedFeaturesOverlay.Graphics.Add(countyGraphic); }
// Display the selected states in the graphics overlay. SimpleLineSymbol stateLineSymbol = new SimpleLineSymbol(SimpleLineSymbolStyle.Solid, Color.DarkCyan, 6); SimpleFillSymbol stateSymbol = new SimpleFillSymbol(SimpleFillSymbolStyle.Null, Color.Cyan, stateLineSymbol); foreach (Feature state in statesQueryResult) { Graphic stateGraphic = new Graphic(state.Geometry, stateSymbol);
_selectedFeaturesOverlay.Graphics.Add(stateGraphic); } } catch (Exception ex) { await new MessageDialog2(ex.ToString(), "Error").ShowAsync(); } } }}