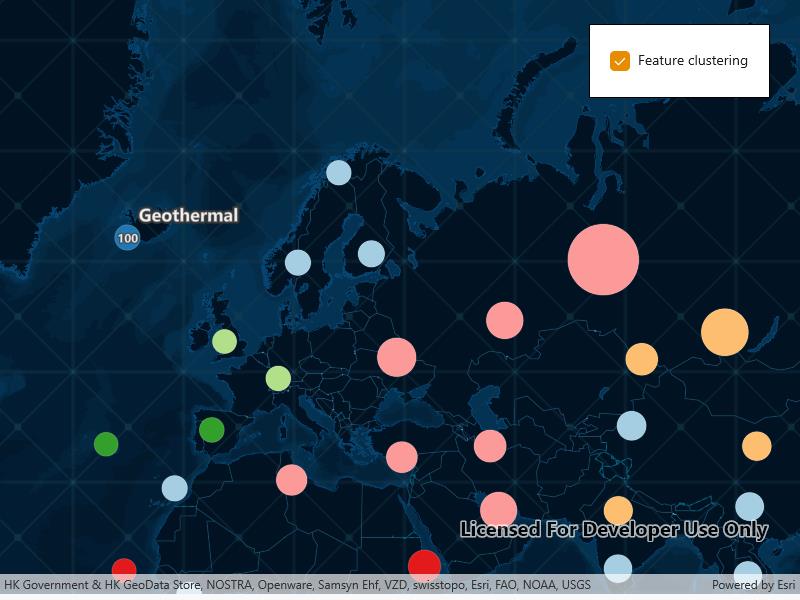
Display a web map with a point feature layer that has feature reduction enabled to aggregate points into clusters.
Use case
Feature clustering can be used to dynamically aggregate groups of points that are within proximity of each other in order to represent each group with a single symbol. Such grouping allows you to see patterns in the data that are difficult to visualize when a layer contains hundreds or thousands of points that overlap and cover each other.
How to use the sample
Pan and zoom the map to view how clustering is dynamically updated. Toggle clustering off to view the original point features that make up the clustered elements. When clustering is on, you can click on a clustered geoelement to view aggregated information and summary statistics for that cluster. When clustering is toggled off and you click on the original feature you get access to information about individual power plant features.
How it works
- Create a map from a web map .
- Get the cluster enabled layer from the map’s operational layers.
- Get the from the feature layer and set the bool to enable or disable clustering on the feature layer.
- When the user clicks on the map, call , passing in the layer, map click location, tolerance, and as true.
- Set the from the resulting to the .
- Make the visible.
Relevant API
- AggregateGeoElement
- FeatureLayer
- FeatureReduction
- GeoElement
- IdentifyLayerResult
About the data
This sample uses a web map that displays the Esri Global Power Plants feature layer with feature reduction enabled. When enabled, the aggregate features symbology shows the color of the most common power plant type, and a size relative to the average plant capacity of the cluster.
Additional information
Graphics in a graphics overlay can also be aggregated into clusters. To do this, set the
property on the to a new .Tags
aggregate, bin, cluster, group, merge, normalize, reduce, summarize
Sample Code
<UserControl x:Class="ArcGIS.WinUI.Samples.DisplayClusters.DisplayClusters" xmlns="http://schemas.microsoft.com/winfx/2006/xaml/presentation" xmlns:x="http://schemas.microsoft.com/winfx/2006/xaml" xmlns:communityTK="using:CommunityToolkit.WinUI.UI.Controls" xmlns:esriTK="using:Esri.ArcGISRuntime.Toolkit.UI.Controls" xmlns:esriUI="using:Esri.ArcGISRuntime.UI.Controls"> <Grid> <esriUI:MapView x:Name="MyMapView" GeoViewTapped="MyMapView_GeoViewTapped" /> <Border Width="auto" Style="{StaticResource BorderStyle}"> <CheckBox Checked="CheckBox_CheckChanged" Content="Feature clustering" IsChecked="True" Unchecked="CheckBox_CheckChanged" /> </Border> <Grid x:Name="PopupBackground" Background="#AA333333" Visibility="Collapsed"> <StackPanel MaxWidth="600" MaxHeight="500" Margin="5" HorizontalAlignment="Center" VerticalAlignment="Center" Background="White"> <esriTK:PopupViewer x:Name="PopupViewer" Margin="5" Padding="5" /> <StackPanel x:Name="GeoElementsPanel" Margin="5,0,5,5" Visibility="Collapsed"> <TextBlock Padding="10,0,10,5" FontWeight="Bold" Text="Contained Geoelements:" /> <communityTK:DataGrid x:Name="GeoElementsGrid" MaxHeight="250" Margin="10,5" AutoGenerateColumns="False" HorizontalScrollBarVisibility="Visible" IsReadOnly="True"> <communityTK:DataGrid.Columns> <communityTK:DataGridTextColumn Binding="{Binding Path=Attributes[objectid]}" Width="auto" Header="Object ID" /> <communityTK:DataGridTextColumn Binding="{Binding Path=Attributes[name]}" Width="auto" Header="Name" /> <communityTK:DataGridTextColumn Binding="{Binding Path=Attributes[capacity_mw]}" Width="auto" Header="Capacity (MW)" /> <communityTK:DataGridTextColumn Width="auto" Binding="{Binding Path=Attributes[fuel1]}" Header="Fuel" /> </communityTK:DataGrid.Columns> </communityTK:DataGrid> </StackPanel> </StackPanel> </Grid> </Grid></UserControl>// Copyright 2023 Esri.//// Licensed under the Apache License, Version 2.0 (the "License"); you may not use this file except in compliance with the License.// You may obtain a copy of the License at: http://www.apache.org/licenses/LICENSE-2.0//// Unless required by applicable law or agreed to in writing, software distributed under the License is distributed on an// "AS IS" BASIS, WITHOUT WARRANTIES OR CONDITIONS OF ANY KIND, either express or implied. See the License for the specific// language governing permissions and limitations under the License.
using Esri.ArcGISRuntime.Data;using Esri.ArcGISRuntime.Mapping;using Esri.ArcGISRuntime.Mapping.Popups;using Esri.ArcGISRuntime.Portal;using Esri.ArcGISRuntime.Reduction;using Esri.ArcGISRuntime.UI.Controls;using Microsoft.UI.Xaml;using Microsoft.UI.Xaml.Controls;using System.Collections.Generic;using System.Linq;using System.Threading.Tasks;
namespace ArcGIS.WinUI.Samples.DisplayClusters{ [ArcGIS.Samples.Shared.Attributes.Sample( name: "Display clusters", category: "Layers", description: "Display a web map with a point feature layer that has feature reduction enabled to aggregate points into clusters.", instructions: "Pan and zoom the map to view how clustering is dynamically updated. Toggle clustering off to view the original point features that make up the clustered elements. When clustering is on, you can click on a clustered geoelement to view aggregated information and summary statistics for that cluster. When clustering is toggled off and you click on the original feature you get access to information about individual power plant features.", tags: new[] { "aggregate", "bin", "cluster", "group", "merge", "normalize", "reduce", "summarize" })] [ArcGIS.Samples.Shared.Attributes.OfflineData()] public partial class DisplayClusters { // Hold a reference to the feature layer. private FeatureLayer _layer;
public DisplayClusters() { InitializeComponent(); _ = Initialize(); }
private async Task Initialize() { // Get the power plants web map from the default portal. var portal = await ArcGISPortal.CreateAsync(); PortalItem portalItem = await PortalItem.CreateAsync(portal, "8916d50c44c746c1aafae001552bad23");
// Create a new map from the web map. MyMapView.Map = new Map(portalItem);
// Get the power plant feature layer once the map has finished loading. await MyMapView.Map.LoadAsync(); _layer = (FeatureLayer)MyMapView.Map.OperationalLayers.First();
PopupBackground.Tapped += (sender, args) => { PopupBackground.Visibility = Visibility.Collapsed; GeoElementsPanel.Visibility = Visibility.Collapsed; PopupViewer.Popup = null; GeoElementsGrid.ItemsSource = null; }; }
private async void MyMapView_GeoViewTapped(object sender, GeoViewInputEventArgs e) { // Clear any previously selected features or clusters. _layer.ClearSelection();
// Identify the tapped observation. var results = await MyMapView.IdentifyLayerAsync(_layer, e.Position, 3, false);
// Return if no popups are found. if (results.GeoElements.Count == 0 || results.Popups.Count == 0) return;
if (results.Popups.FirstOrDefault() is Popup popup) { // Set the popup and make it visible. PopupViewer.Popup = results.Popups.FirstOrDefault(); PopupBackground.Visibility = Visibility.Visible; }
// If the tapped observation is an AggregateGeoElement then select it. if (results.GeoElements.FirstOrDefault() is AggregateGeoElement aggregateGeoElement) { // Select the AggregateGeoElement. aggregateGeoElement.IsSelected = true;
// Get the contained GeoElements. IReadOnlyList<GeoElement> geoElements = await aggregateGeoElement.GetGeoElementsAsync();
// Set the geoelements as an items source and set the visibility. GeoElementsGrid.ItemsSource = geoElements; GeoElementsPanel.Visibility = Visibility.Visible; } else if (results.GeoElements.FirstOrDefault() is ArcGISFeature feature) { // If the tapped observation is not an AggregateGeoElement select the feature. _layer.SelectFeature(feature); } }
// Enable clustering feature reduction if the checkbox has been checked, disable otherwise. private void CheckBox_CheckChanged(object sender, RoutedEventArgs e) { // This event is raised when sample is initially loaded when layer is null. if (_layer == null) return;
_layer.FeatureReduction.IsEnabled = (bool)(sender as CheckBox).IsChecked; } }}