Introduction to data services

Data services, also known as hosted data services, are services hosted in a portal that are used to securely store, manage, and access geographic data. They are typically created as an item in your organization's portal.

You can access data from data services by creating client-side data layers in your application. These are also known as operational layers, and can be used to display features, vector tiles, map tiles, and more.

Feature layers

If you have features containing geometry and attributes, you can import the data to create an ArcGIS feature layer in a feature service. To access the data, you can use the URL of the service to query and return features. You can style and display the results in a map or scene. Feature layers can also contain styling information as part of the service response.

How to publish and display a feature layer

To access and display a hosted feature layer, you use the OpenLayers VectorLayer and VectorSource classes.

  1. Import your data from a CSV, XLS, GeoJSON, or Shapefile file to create a hosted feature layer.
  2. Get the URL for the feature layer.
  3. In your code, reference the OpenLayers CSS, JS, and ol-mapbox-style libraries.
  4. Define a VectorSource to access and query the feature service to return GeoJSON features.
  5. Display the data in a VectorLayer and add the layer to your map.

Example

Display a feature layer (as GeoJSON)

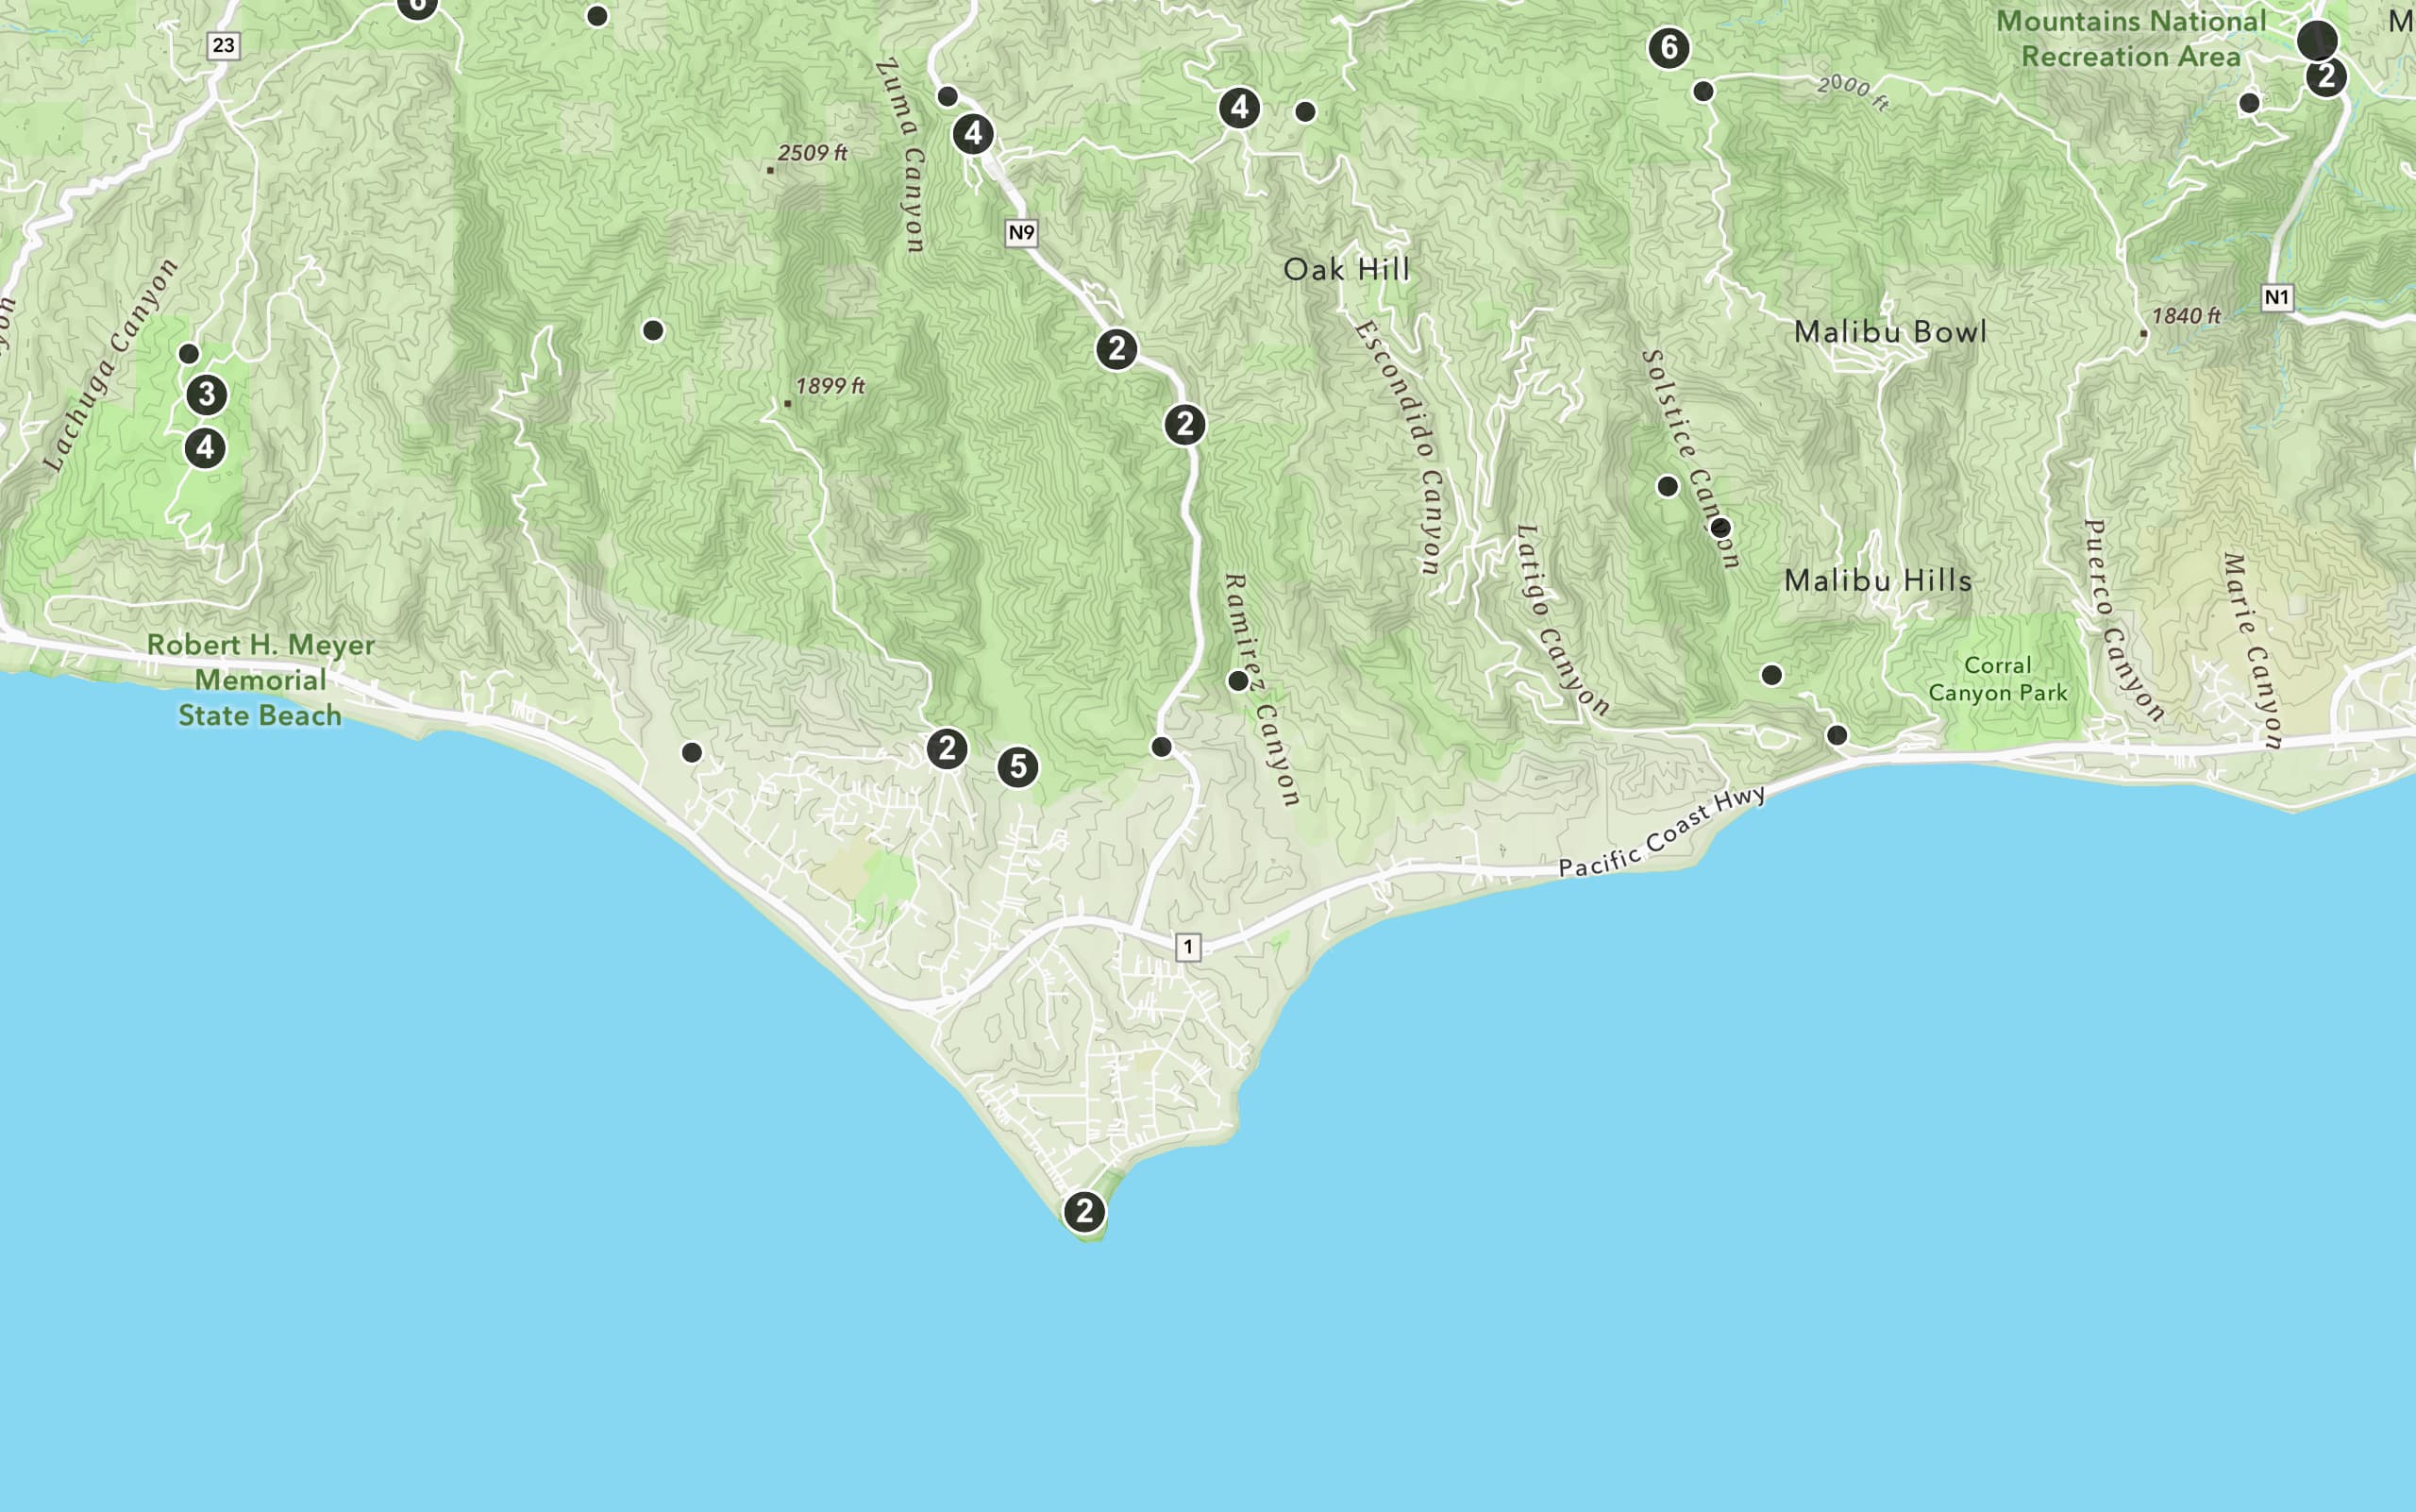
This example demonstrates how to display a feature layer. To get GeoJSON features from a feature layer, you need to provide a URL that queries the feature service and returns the features in GeoJSON format.

Use dark colors for code blocksCopy
1
2
3
4
5
6
7
8
9
10
11
12
13
14
15
16
17
18
19
20
21
22
23
24
25
<link rel="stylesheet" href="https://cdn.jsdelivr.net/gh/openlayers/openlayers.github.io@master/en/v6.15.1/css/ol.css" type="text/css" />
    <script src="https://cdn.jsdelivr.net/gh/openlayers/openlayers.github.io@master/en/v6.15.1/build/ol.js"></script>
    <script src="https://cdn.jsdelivr.net/npm/ol-mapbox-style@6.1.4/dist/olms.js" type="text/javascript"></script>

    <script>

      olms.apply(map, basemapURL).then(function (map) {

        const pointLayerName = "Trailheads";

        const pointSource = new ol.source.Vector({
          format: new ol.format.GeoJSON(),
          url: "https://services3.arcgis.com/GVgbJbqm8hXASVYi/arcgis/rest/services/" +
          pointLayerName +
          "/FeatureServer/0/query?where=1%3D1&outFields=*&returnGeometry=true&f=geojson"
        });

        const pointLayer = new ol.layer.Vector({
          source: pointSource
        });

        map.addLayer(pointLayer);
      });

    </script>

Vector tile layers

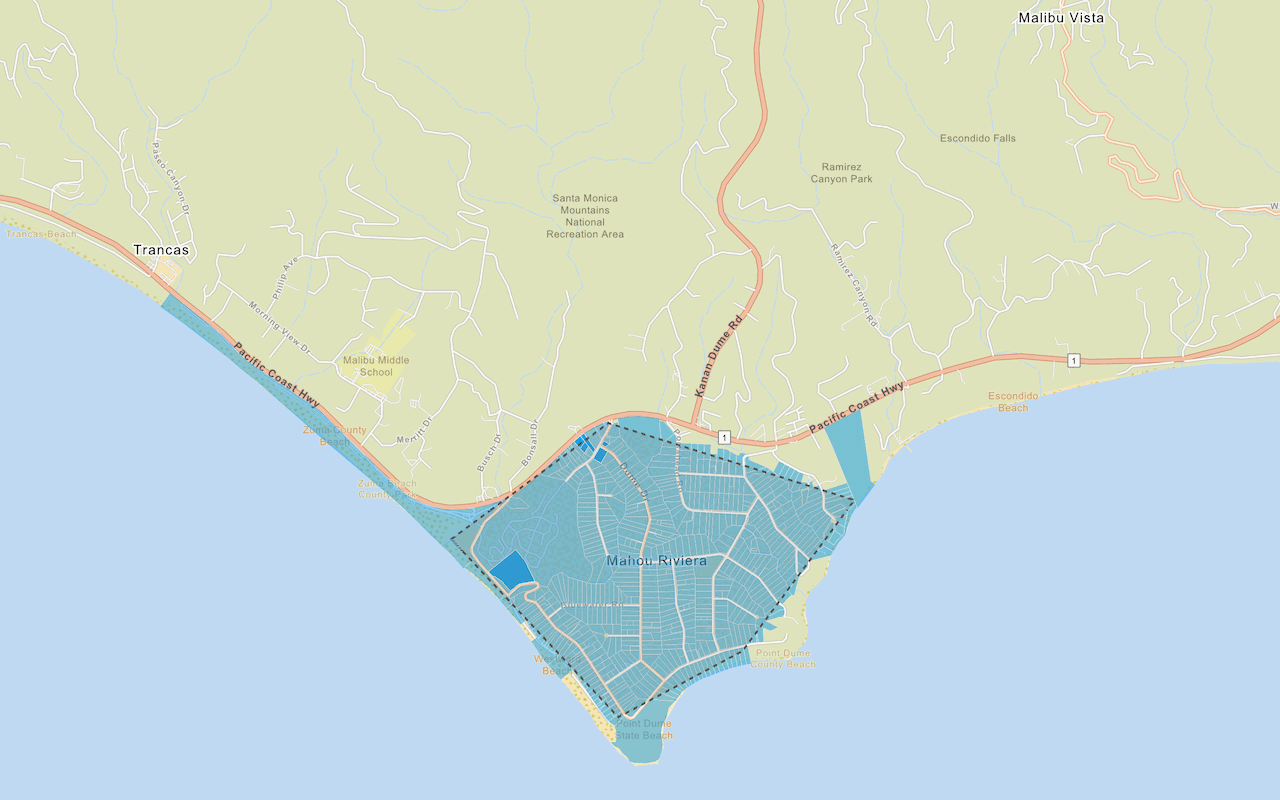
If you want to access and display your data as vector tile data, you can publish a vector tile service from an existing tile layer or feature layer using your portal.

How to publish and display a vector tile layer

To display the hosted layer in your application, you use the OpenLayers VectorTile and VectorTileLayer classes.

  1. Import your data from a CSV, XLS, GeoJSON, or Shapefile file to create a hosted feature layer.
  2. Style and publish the feature layer as a vector tile layer using your portal.
  3. Get the URL for the vector tile layer.
  4. In your code, reference the OpenLayers CSS, JS, and ol-mapbox-style libraries.
  5. Define a VectorTile source to access and query the vector tile layer.
  6. Display the data in a VectorTileLayer and add the layer to your map.
  7. Define the style of the vector tile layer, found in the Style tab of the item page in your portal.

Example

Display a vector tile layer

Use dark colors for code blocksCopy
1
2
3
4
5
6
7
8
9
10
11
12
13
14
15
16
17
18
19
20
21
22
23
24
25
26
27
28
29
30
31
32
33
34
35
36
37
38
39
40
41
42
43
44
45
46
47
48
49
50
51
52
53
54
55
56
57
58
59
60
61
62
63
64
65
66
67
68
69
70
    <link rel="stylesheet" href="https://cdn.jsdelivr.net/npm/ol@v10.1.0/ol.css" type="text/css" />
    <script src="https://cdn.jsdelivr.net/npm/ol@v10.1.0/dist/ol.js"></script>

    <script src="https://cdn.jsdelivr.net/npm/ol-mapbox-style@12.3.5/dist/olms.js"></script>

    <script>

      olms.apply(map, basemapURL).then((map) => {

        const parcelsSource = new ol.source.VectorTile({
          format: new ol.format.MVT(),
          url: `https://vectortileservices3.arcgis.com/GVgbJbqm8hXASVYi/arcgis/rest/services/Santa_Monica_Mountains_Parcels_VTL/VectorTileServer/tile/{z}/{y}/{x}.pbf`,

          // Attribution text retrieved from https://arcgis.com/home/item.html?id=f0298e881b5b4743bbdf2c7d378acc84
          attributions: ['| County of Los Angeles Office of the Assessor']

        });

        const parcelsLayer = new ol.layer.VectorTile({
          source: parcelsSource
        });

        map.addLayer(parcelsLayer);

        // Add Esri attribution
        // Learn more in https://esriurl.com/attribution
        const source = map.getLayers().item(0).getSource();
        source.setAttributions("Powered by <a href='https://www.esri.com/en-us/home' target='_blank'>Esri</a> | ")

      });

    </script>

Map tile layers

If you want to access and display a map tile service containing raster data, you need to use your portal to upload the tile data or publish it from an existing feature layer.

How to publish and display a map tile layer

To display the layer, you use the OpenLayers XYZ and Tile layer classes.

  1. In your portal, import your data from a CSV, XLS, GeoJSON, or Shapefile file to create a hosted feature layer.
  2. Create a tile layer in your portal by navigating to the feature layer's item page > Publish > Tile layer.
  3. Get the URL for the new tile layer.
  4. In your code, reference the OpenLayers CSS, JS, and ol-mapbox-style libraries.
  5. Define an XYZ source to access and query the vector tile layer.
  6. Display the data in a Tile layer and add the layer to your map.

Example

Display a map tile layer

Use dark colors for code blocksCopy
1
2
3
4
5
6
7
8
9
10
11
12
13
14
15
16
17
18
19
20
21
22
23
24
25
26
27
28
29
30
31
32
33
34
35
36
37
38
39
40
41
42
43
44
45
46
47
48
49
50
51
52
53
54
55
56
57
58
59
60
61
62
63
64
65
66
67
68
69
70
71
72
73
74
75
76
77
78
79
80
81
    <link rel="stylesheet" href="https://cdn.jsdelivr.net/npm/ol@v10.1.0/ol.css" type="text/css" />
    <script src="https://cdn.jsdelivr.net/npm/ol@v10.1.0/dist/ol.js"></script>

    <script src="https://cdn.jsdelivr.net/npm/ol-mapbox-style@12.3.5/dist/olms.js" type="text/javascript"></script>

    <script>

      olms.apply(map, basemapURL)

        .then(function (map) {
          const contoursURL = "https://services3.arcgis.com/GVgbJbqm8hXASVYi/arcgis/rest/services/Santa_Monica_contours_(map_tiles)/MapServer/tile/{z}/{y}/{x}";

          const contoursSource = new ol.source.XYZ({
            url: contoursURL,

            // Attribution text retrieved from https://arcgis.com/home/item.html?id=5fd812155876416997c1a03e841e8821
            attributions: ['| City of Santa Monica GIS Data']

          });

          const tileLayer = new ol.layer.Tile({
            source: contoursSource,
            opacity: 0.3
          });

          map.addLayer(tileLayer);

          // Add Esri attribution
          // Learn more in https://esriurl.com/attribution
          const source = map.getLayers().item(0).getSource();
          source.setAttributions("Powered by <a href='https://www.esri.com/en-us/home' target='_blank'>Esri</a> | ")

        });
    </script>

Tutorials

Your browser is no longer supported. Please upgrade your browser for the best experience. See our browser deprecation post for more details.