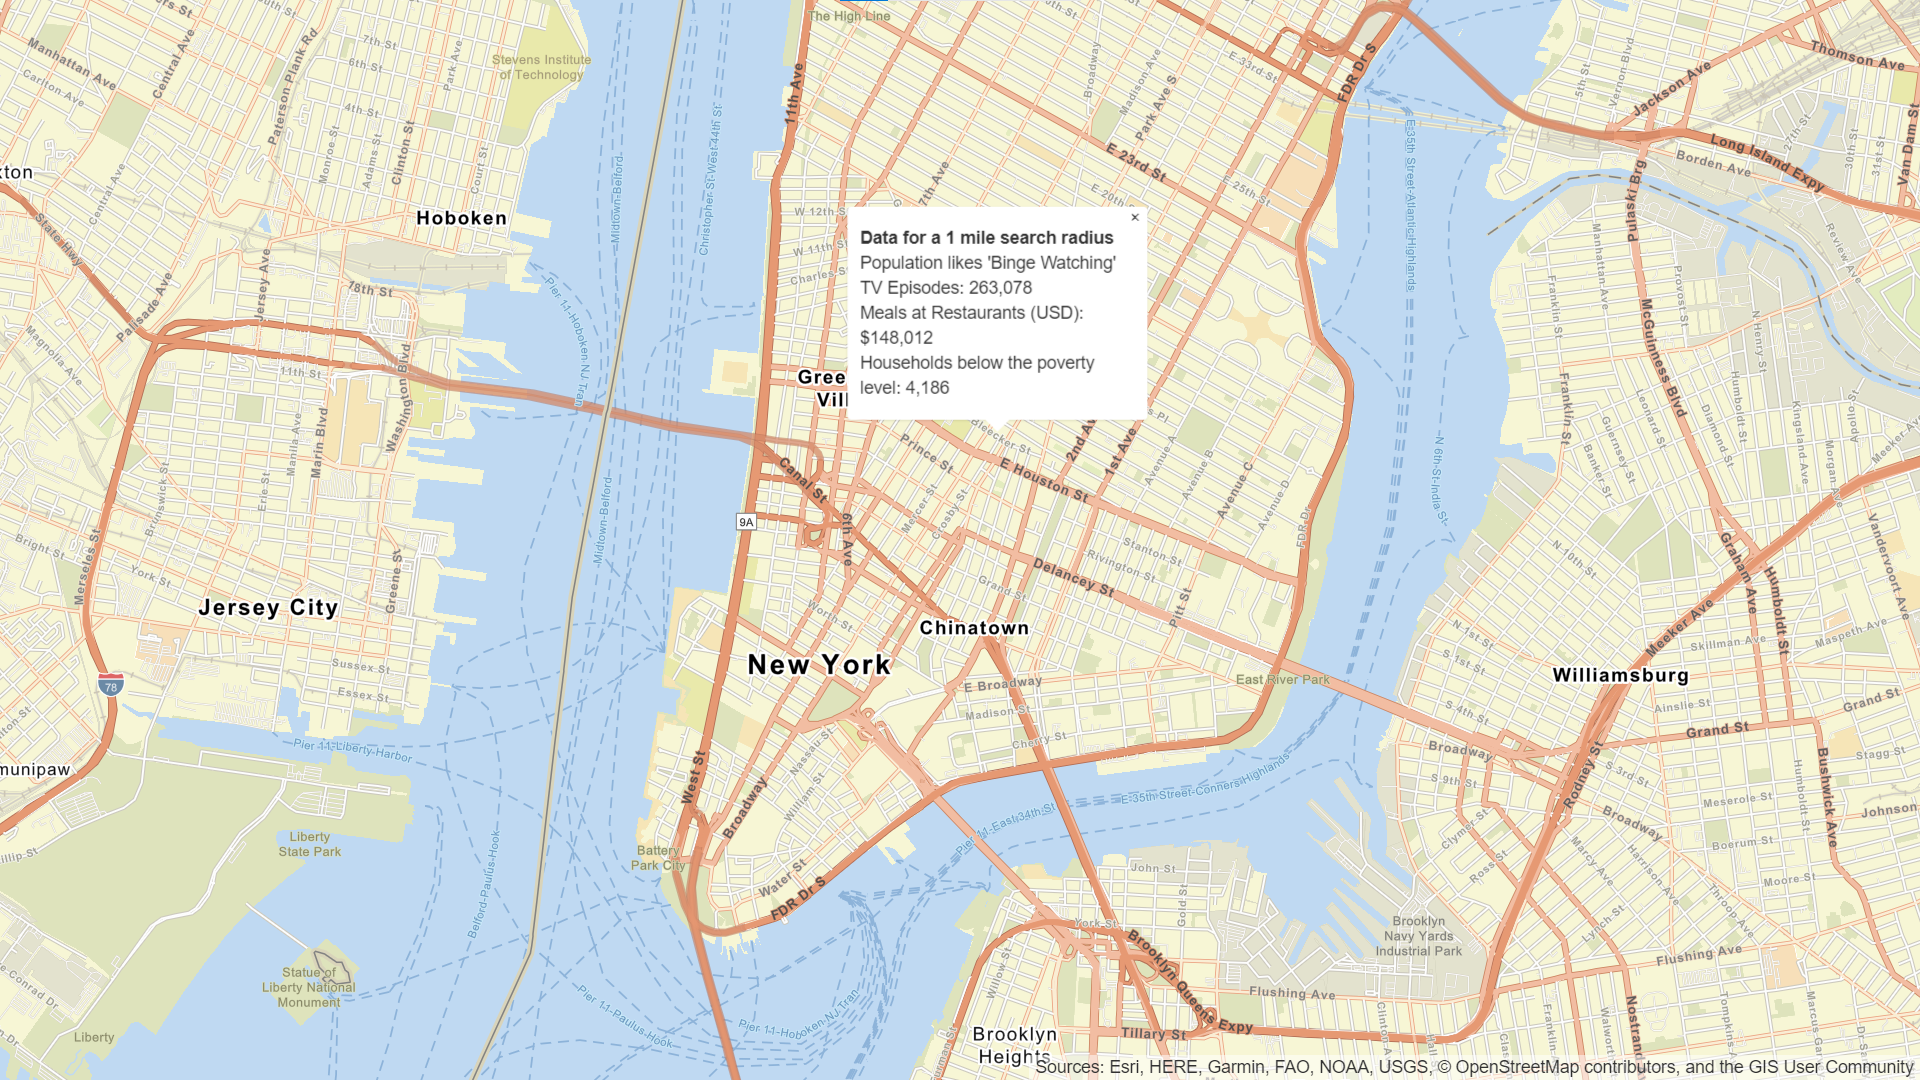
Learn how to query global demographic information for locations around the world with the GeoEnrichment service.
The GeoEnrichment service provides global demographic data for 170 countries and regions. To get globally available information, you use the Key data collection, which returns information for the total population, total households, average household size, and total population for males and females for a study area.
In this tutorial, you use ArcGIS REST JS to access the GeoEnrichment service and display global data for Eastern Europe.
Prerequisites
You need an ArcGIS Location Platform or ArcGIS Online account.
Steps
Create a new pen
- To get started, either complete the Display a map tutorial or .
Get an access token
You need an access token with the correct privileges to access the resources used in this tutorial.
-
Go to the Create an API key tutorial and create an API key with the following privilege(s):
- Privileges
- Location services > Basemaps
- Location services > Data enrichment
- Privileges
-
Copy the API key access token to your clipboard when prompted.
-
In CodePen, update the
accessvariable to use your access token.Token Use dark colors for code blocks const map = L.map("map", { minZoom: 2 }) map.setView([34.02, -118.805], 13); const accessToken = "YOUR_ACCESS_TOKEN"; const basemapEnum = "arcgis/streets"; L.esri.Vector.vectorBasemapLayer(basemapEnum, { token: accessToken }).addTo(map);
To learn about the other types of authentication available, go to Types of authentication.
Add references to ArcGIS REST JS
-
Reference the
demographicsandrequestmodules from ArcGIS REST JS.Use dark colors for code blocks <!-- Load Leaflet from CDN --> <link rel="stylesheet" href="https://unpkg.com/leaflet@1.9.4/dist/leaflet.css" crossorigin="" /> <script src="https://unpkg.com/leaflet@1.9.4/dist/leaflet.js" crossorigin=""></script> <!-- Load Esri Leaflet from CDN --> <script src="https://unpkg.com/esri-leaflet@3.0.12/dist/esri-leaflet.js"></script> <script src="https://unpkg.com/esri-leaflet-vector@4.2.3/dist/esri-leaflet-vector.js"></script> <!-- Load ArcGIS REST JS libraries from https://unpkg.com --> <script src="https://unpkg.com/@esri/arcgis-rest-request@4.0.0/dist/bundled/request.umd.js"></script> <script src="https://unpkg.com/@esri/arcgis-rest-demographics@4.0.0/dist/bundled/demographics.umd.js"></script>
Update the map
-
Center the map on
[18.88, 47.33]and set the zoom level to 5. Change thebasemaptoEnum arcgis/navigation.Use dark colors for code blocks const basemapEnum = "arcgis/navigation"; const map = L.map("map", { minZoom: 2 }); map.setView([47.33, 18.88], 5); //Eastern Europe L.esri.Vector.vectorBasemapLayer(basemapEnum, { token: accessToken }).addTo(map);
Add a click handler
When you click on the map, your application will display demographic data for the area near the clicked location. Use a click handler to retrieve the coordinates of the click.
-
Create a function called
getthat takes theDemographic Data latlngcoordinates as a parameter.Use dark colors for code blocks L.esri.Vector.vectorBasemapLayer(basemapEnum, { token: accessToken }).addTo(map); function getDemographicData(latlng) { } -
Add a
clickevent handler. Inside, callgetwith theDemographic Data Latof the clicked location.Lng Use dark colors for code blocks L.esri.Vector.vectorBasemapLayer(basemapEnum, { token: accessToken }).addTo(map); function getDemographicData(latlng) { } map.on("click", (e) => { getDemographicData(e.latlng); });
Get demographic data
Use the query operation to retrieve demographic data. To query a circular buffer around a point, pass a geometry object with x and y parameters. The default search radius is one mile.
-
Create a new
Apiusing your API key.K e y Manager Use dark colors for code blocks L.esri.Vector.vectorBasemapLayer(basemapEnum, { token: accessToken }).addTo(map); const authentication = arcgisRest.ApiKeyManager.fromKey(accessToken); function getDemographicData(latlng) { } -
Access the GeoEnrichment service with
query. Set theDemographic Data studyparameter with an array containing a singleAreas geometryobject with longitude and latitude. Set thedataparameter to toCollections ["Keyto obtain global data for your location.Global Facts"] Use dark colors for code blocks function getDemographicData(latlng) { arcgisRest .queryDemographicData({ studyAreas: [{ geometry: { x: latlng.lng, y: latlng.lat } }], dataCollections: ["KeyGlobalFacts"], authentication: authentication }) }
Display results
If the query is successful, the response will contain a results array with a value containing a Feature. The Feature contains demographic attributes such as population within the study area, the number of males and females, and the average household size.
A message will display if there is no data available for a location selected. To learn more, go to Data enrichment in the Mapping and location services guide.
You can use a Popup to show the results of the query at the location where you clicked on the map.
To learn more about using pop-ups with Esri Leaflet, go to the Display a popup tutorial.
-
Access the response
Featurein a callback function and check to see if it contains data. If data was returned, access the feature attributes to retrieve demographic information.Set Use dark colors for code blocks function getDemographicData(latlng) { arcgisRest .queryDemographicData({ studyAreas: [{ geometry: { x: latlng.lng, y: latlng.lat } }], dataCollections: ["KeyGlobalFacts"], authentication: authentication }) .then((response) => { const featureSet = response.results[0].value.FeatureSet; let message; if (featureSet.length > 0 && featureSet[0].features.length > 0) { const attributes = featureSet[0].features[0].attributes; message = `<b>Data for a 1 mile search radius</b><br>Population: ${attributes.TOTPOP}<br>Males: ${attributes.TOTMALES} <br>Females: ${attributes.TOTFEMALES}<br>Average Household Size: ${attributes.AVGHHSZ}`; } else { message = "Data not available for this location."; } }); } -
Display a
Popupat the clicked location containing the demographic information.Use dark colors for code blocks .then((response) => { const featureSet = response.results[0].value.FeatureSet; let message; if (featureSet.length > 0 && featureSet[0].features.length > 0) { const attributes = featureSet[0].features[0].attributes; message = `<b>Data for a 1 mile search radius</b><br>Population: ${attributes.TOTPOP}<br>Males: ${attributes.TOTMALES} <br>Females: ${attributes.TOTFEMALES}<br>Average Household Size: ${attributes.AVGHHSZ}`; } else { message = "Data not available for this location."; } var popup = L.popup().setLatLng(latlng).setContent(message).openOn(map); });
Run the app
In CodePen, run your code to display the map.
You should now see a map centered over eastern Europe. Click on the map to query for demographic data and view the results in a popup
What's next?
Learn how to use additional ArcGIS location services in these tutorials:


