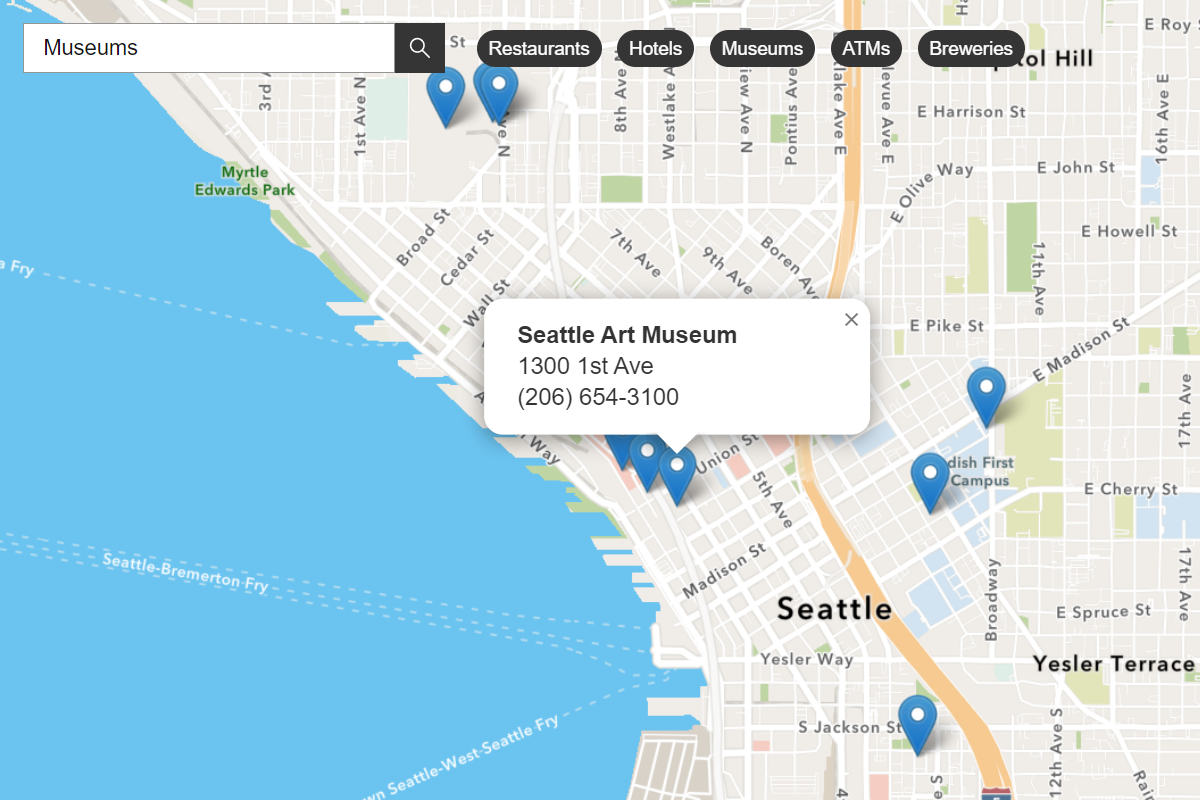
Learn how to find places around a location with a keyword search, then get detailed place information.
A nearby search finds places within a given radius of a location using the places service. The location typically represents a point on a map or the geolocation of a device.
To perform a nearby search, you use the places package from ArcGIS REST JS. With the results of the search, you can make another request to the service and return place attributes including the name, categories, ratings, and store hours.
In this tutorial, you use ArcGIS REST JS to perform a nearby search to find points of interest and return all available attributes associated with a place. The tutorial includes starter code that uses Calcite components to create a basic search interface.
Prerequisites
Steps
Get the starter code
- To get started, . It contains the Calcite Components necessary to create this application, as well as an initial Leaflet map.
Get an access token
You need an access token with the correct privileges to access the resources used in this tutorial.
-
Go to the Create an API key tutorial and create an API key with the following privilege(s):
- Privileges
- Location services > Basemaps
- Location services > Places
- Privileges
-
Copy the API key access token to your clipboard when prompted.
-
In CodePen, update the
accessvariable to use your access token.Token Use dark colors for code blocks const map = L.map("map", { minZoom: 2 }) map.setView([34.02, -118.805], 13); const accessToken = "YOUR_ACCESS_TOKEN"; const basemapEnum = "arcgis/streets"; L.esri.Vector.vectorBasemapLayer(basemapEnum, { token: accessToken }).addTo(map);
To learn about the other types of authentication available, go to Types of authentication.
Reference ArcGIS REST JS
-
Reference the
routingandrequestpackages from ArcGIS REST JS.Use dark colors for code blocks <!-- Load Leaflet from CDN --> <link rel="stylesheet" href="https://unpkg.com/leaflet@1.9.4/dist/leaflet.css" crossorigin="" /> <script src="https://unpkg.com/leaflet@1.9.4/dist/leaflet.js" crossorigin=""></script> <!-- Load Esri Leaflet from CDN --> <script src="https://unpkg.com/esri-leaflet@3.0.12/dist/esri-leaflet.js"></script> <script src="https://unpkg.com/esri-leaflet-vector@4.2.3/dist/esri-leaflet-vector.js"></script> <!-- Calcite components --> <script type="module" src="https://js.arcgis.com/calcite-components/1.0.5/calcite.esm.js"></script> <link rel="stylesheet" type="text/css" href="https://js.arcgis.com/calcite-components/1.0.5/calcite.css" /> <!-- ArcGIS REST JS: request and places --> <script src="https://unpkg.com/@esri/arcgis-rest-request@4.0.0/dist/bundled/request.umd.js"></script> <script src="https://unpkg.com/@esri/arcgis-rest-places@1.0.0/dist/bundled/places.umd.js"></script> -
Create a REST JS
Apiusing your API key.K e y Manager Use dark colors for code blocks const accessToken = "YOUR_ACCESS_TOKEN"; const basemapEnum = "arcgis/navigation"; L.esri.Vector.vectorBasemapLayer(basemapEnum, { token: accessToken }).addTo(map); map.zoomControl.setPosition("bottomright"); const authentication = arcgisRest.ApiKeyManager.fromKey(accessToken);
Set a category and search area
To perform a place search, you typically need a category ID. Each category ID corresponds to a unique category of place, such as "Chinese Restaurants" (13099) or "Sports and Recreation" (18000). A Calcite category selector is included in the . It includes the default top-level categories as selectable options.
-
Declare global variables to track the active place category and clicked location. Set the active category to
16000, which corresponds to theLandmarks and Outdoorscategory of places.Use dark colors for code blocks const authentication = arcgisRest.ApiKeyManager.fromKey(accessToken); let activeCategory = "16000"; let userLocation; -
Create a click event handler that saves the location of clicks on the map.
Use dark colors for code blocks const authentication = arcgisRest.ApiKeyManager.fromKey(accessToken); let activeCategory = "16000"; let userLocation; map.on('click', function (e) { userLocation = e.latlng; }) -
When a click is registered, create a
Circleat the clicked location to represent the area that will be searched. Set the radius to the search radius in meters.Use dark colors for code blocks const authentication = arcgisRest.ApiKeyManager.fromKey(accessToken); let activeCategory = "16000"; let userLocation; const searchRadius = 750; const clickedPoint = L.layerGroup().addTo(map); map.on('click', function (e) { userLocation = e.latlng; clickedPoint.clearLayers(); L.circle(e.latlng, { color:"#000000", stroke:true, weight:2, opacity:0.5, fill:true, fillOpacity:0.25, fillColor:"#aaaaaa", radius: searchRadius }).addTo(clickedPoint); }) -
Create another event handler for the Calcite category selector. Update the
activewhen a new option is selected from the dropdown.Category Use dark colors for code blocks map.on('click', function (e) { userLocation = e.latlng; clickedPoint.clearLayers(); L.circle(e.latlng, { color:"#000000", stroke:true, weight:2, opacity:0.5, fill:true, fillOpacity:0.25, fillColor:"#aaaaaa", radius: searchRadius }).addTo(clickedPoint); }) categorySelect.addEventListener("calciteComboboxChange", e => { console.log(activeCategory) activeCategory = categorySelect.value; map.closePopup(); });
Find places near a point
Once a location and category have been set, make a request to the places service to find places near a point.
-
Define a new function
show. Use the ArcGIS REST JSPlaces findfunction to submit a request to the places service. Pass thePlaces Near Point search,Radius user, andLocation active, as well as yourCategory authenticationobject.Use dark colors for code blocks categorySelect.addEventListener("calciteComboboxChange", e => { console.log(activeCategory) activeCategory = categorySelect.value; map.closePopup(); }); function showPlaces() { arcgisRest.findPlacesNearPoint({ x: userLocation.lng, y: userLocation.lat, categoryIds:activeCategory, radius:searchRadius, authentication }) }; -
Call the
showfunction inside both of the event handlers.Places Use dark colors for code blocks map.on('click', function (e) { userLocation = e.latlng; clickedPoint.clearLayers(); L.circle(e.latlng, { color:"#000000", stroke:true, weight:2, opacity:0.5, fill:true, fillOpacity:0.25, fillColor:"#aaaaaa", radius: searchRadius }).addTo(clickedPoint); showPlaces() }) categorySelect.addEventListener("calciteComboboxChange", e => { console.log(activeCategory) activeCategory = categorySelect.value; map.closePopup(); if (userLocation) showPlaces(); });
Display results on the map
The places service will return a list of places near your location that match the specified category. Display these results as points on your map.
-
Create a Leaflet
Layerto display results and add it to your map. Clear the contents of the group when a new request is made.Group Use dark colors for code blocks const layerGroup = L.layerGroup().addTo(map); function showPlaces() { layerGroup.clearLayers(); resultPanel.innerHTML = ""; arcgisRest.findPlacesNearPoint({ x: userLocation.lng, y: userLocation.lat, categoryIds:activeCategory, radius:searchRadius, authentication }) }; -
Access the service response. Create a new
addfunction and call it for each search result.Result Use dark colors for code blocks arcgisRest.findPlacesNearPoint({ x: userLocation.lng, y: userLocation.lat, categoryIds:activeCategory, radius:searchRadius, authentication }) .then((response)=>{ response.results.forEach((result)=>{ addResult(result); }); }); }; function addResult(place) { } -
Create a Leaflet
Markerat the location of each place. Display the markers in your layer group.Use dark colors for code blocks function addResult(place) { const marker = L.marker([place.location.y, place.location.x], { title:place.name }).addTo(layerGroup); marker.id = place.placeId; }
Display results in a list
To show more information about each place, you will also display place results as an element in a Calcite list. The template for this list is included in the starter code.
-
Create a new
calcite-list-itemelement to display place information. Set the item properties to display the place name, category, and distance from the user's click. Add the element to the list of results.Use dark colors for code blocks function addResult(place) { const marker = L.marker([place.location.y, place.location.x], { title:place.name }).addTo(layerGroup); marker.id = place.placeId; const infoDiv = document.createElement("calcite-list-item"); resultPanel.appendChild(infoDiv); const description = ` ${place.categories[0].label} - ${Number((place.distance / 1000).toFixed(1))} km `; infoDiv.label = place.name; infoDiv.description = description; } -
When the HTML element is clicked, display a popup at the associated marker.
Use dark colors for code blocks function addResult(place) { const marker = L.marker([place.location.y, place.location.x], { title:place.name }).addTo(layerGroup); marker.id = place.placeId; const infoDiv = document.createElement("calcite-list-item"); resultPanel.appendChild(infoDiv); const description = ` ${place.categories[0].label} - ${Number((place.distance / 1000).toFixed(1))} km `; infoDiv.label = place.name; infoDiv.description = description; infoDiv.addEventListener("click",e => { map.openPopup(place.name,marker.getLatLng(), { offset: [0, -25] }); }) } -
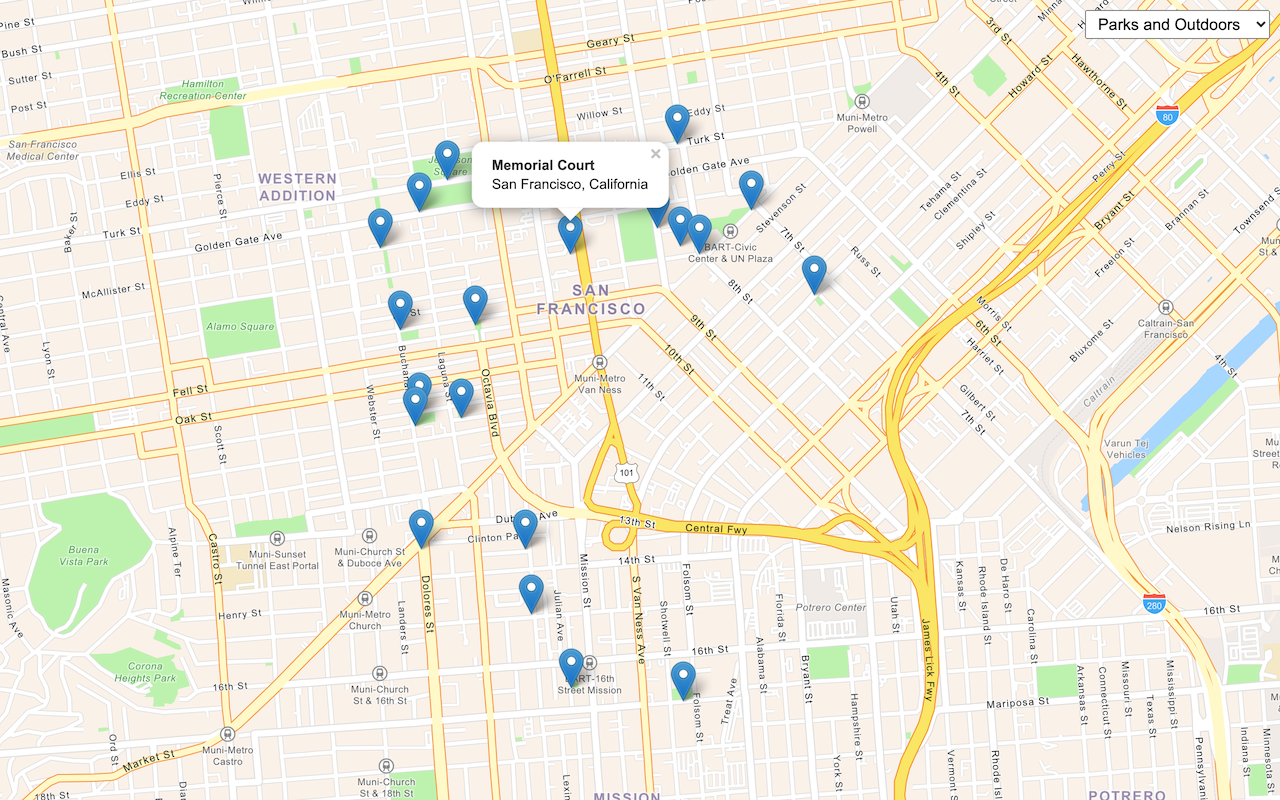
Run the app. Clicking on the map should perform a place search and display results as markers on the map. Result names and categories should display in the results panel to the left.
Get place details
The user of your application should be able to click on a result in the panel in order to see more information about it. Perform an arcgis request to obtain detailed attributes about a specific point of interest.
-
Create a new function
get. When a result is clicked, callDetails getand pass the ID of the clicked result.Details Use dark colors for code blocks infoDiv.addEventListener("click",e => { map.openPopup(place.name,marker.getLatLng(), { offset: [0, -25] }); getDetails(marker); }) } function getDetails(marker) { } -
Call
arcgisto get more information about a specific POI. Pass the place id to theRest.get Place Details placeparameter and provide authentication.I d Use dark colors for code blocks function getDetails(marker) { arcgisRest.getPlaceDetails({ placeId: marker.id, requestedFields: ["all"], authentication }) }
Display place details
Display the resulting place details in a new panel. The helper code for this panel is provided in the template file.
-
Access the response from the places service and create a new
calcite-flow-itemelement to display results. Add the flow item to the<flow>element included in the template.Use dark colors for code blocks function getDetails(marker) { arcgisRest.getPlaceDetails({ placeId: marker.id, requestedFields: ["all"], authentication }) .then((result)=>{ const placeDetails = result.placeDetails; map.setView(marker.getLatLng()); infoPanel = document.createElement("calcite-flow-item"); flow.appendChild(infoPanel) }); } -
Set the name and description of the panel using the service response. Call the
sethelper function included with the starter code to display the rest of the attributes if they are valid. Select a Calcite UI icon for each attribute.Attribute Use dark colors for code blocks .then((result)=>{ const placeDetails = result.placeDetails; map.setView(marker.getLatLng()); infoPanel = document.createElement("calcite-flow-item"); flow.appendChild(infoPanel) infoPanel.heading = placeDetails.name; infoPanel.description = placeDetails.categories[0].label; setAttribute("Description", "information", placeDetails?.description); setAttribute("Address", "map-pin", placeDetails?.address?.streetAddress); setAttribute("Phone", "mobile", placeDetails?.contactInfo?.telephone); setAttribute("Hours", "clock", placeDetails?.hours?.openingText); setAttribute("Rating", "star", placeDetails?.rating?.user); setAttribute("Email", "email-address", placeDetails?.contactInfo?.email); setAttribute("Website", "information", placeDetails?.contactInfo?.website?.split("://")[1].split("/")[0]); setAttribute("Facebook", "speech-bubble-social", (placeDetails?.socialMedia?.facebookId) ? `www.facebook.com/${placeDetails.socialMedia.facebookId}` : null); setAttribute("Twitter", "speech-bubbles", (placeDetails?.socialMedia?.twitter) ? `www.twitter.com/${placeDetails.socialMedia.twitter}` : null); setAttribute("Instagram", "camera", (placeDetails?.socialMedia?.instagram) ? `www.instagram.com/${placeDetails.socialMedia.instagram}` : null); }); -
When the info panel is closed, close any open map popups.
Use dark colors for code blocks function getDetails(marker) { arcgisRest.getPlaceDetails({ placeId: marker.id, requestedFields: ["all"], authentication }) .then((result)=>{ const placeDetails = result.placeDetails; map.setView(marker.getLatLng()); infoPanel = document.createElement("calcite-flow-item"); flow.appendChild(infoPanel) infoPanel.heading = placeDetails.name; infoPanel.description = placeDetails.categories[0].label; setAttribute("Description", "information", placeDetails?.description); setAttribute("Address", "map-pin", placeDetails?.address?.streetAddress); setAttribute("Phone", "mobile", placeDetails?.contactInfo?.telephone); setAttribute("Hours", "clock", placeDetails?.hours?.openingText); setAttribute("Rating", "star", placeDetails?.rating?.user); setAttribute("Email", "email-address", placeDetails?.contactInfo?.email); setAttribute("Website", "information", placeDetails?.contactInfo?.website?.split("://")[1].split("/")[0]); setAttribute("Facebook", "speech-bubble-social", (placeDetails?.socialMedia?.facebookId) ? `www.facebook.com/${placeDetails.socialMedia.facebookId}` : null); setAttribute("Twitter", "speech-bubbles", (placeDetails?.socialMedia?.twitter) ? `www.twitter.com/${placeDetails.socialMedia.twitter}` : null); setAttribute("Instagram", "camera", (placeDetails?.socialMedia?.instagram) ? `www.instagram.com/${placeDetails.socialMedia.instagram}` : null); infoPanel.addEventListener("calciteFlowItemBack", e => { map.closePopup(); }) }); } -
Close the info panel when a new search is performed.
Use dark colors for code blocks function showPlaces() { layerGroup.clearLayers(); resultPanel.innerHTML = ""; if (infoPanel) infoPanel.remove(); arcgisRest.findPlacesNearPoint({ x: userLocation.lng, y: userLocation.lat, categoryIds:activeCategory, radius:searchRadius, authentication }) .then((response)=>{ response.results.forEach((result)=>{ addResult(result); }); }); };
Run the app
In CodePen, run your code to display the application. The app should display a map with a result panel on the left, which will populate with values when the map is clicked. Upon clicking on a place result, more information about the place should appear in the panel.
What's next?
Learn how to use additional ArcGIS location services in these tutorials: