Learn how to execute a spatial query to access polygon features from a feature service.
A feature layer can contain a large number of features stored in ArcGIS. To access a subset of these features, you can execute an SQL or spatial query, either together or individually. The results can contain the attributes, geometry, or both for each record. SQL and spatial queries are useful when a feature layer is very large and you want to access only a subset of its data.
In this tutorial, you sketch a feature on the map and use ArcGIS REST JS to perform a spatial query against the LA County Parcels hosted feature layer. The layer contains ±2.4 million features. The spatial query returns all of the parcels that intersect the sketched feature. A pop-up is also used to display feature attributes.
Prerequisites
You need an ArcGIS Location Platform or ArcGIS Online account.
Steps
Create a new pen
- To get started, either complete the Display a map tutorial or .
Get an access token
You need an access token with the correct privileges to access the resources used in this tutorial.
-
Go to the Create an API key tutorial and create an API key with the following privilege(s):
- Privileges
- Location services > Basemaps
- Item access
- Note: If you are using your own custom data layer for this tutorial, you need to grant the API key credentials access to the layer item. Learn more in Item access privileges.
- Privileges
-
Copy the API key access token to your clipboard when prompted.
-
In CodePen, update the
accessvariable to use your access token.Token Use dark colors for code blocks const map = L.map("map", { minZoom: 2 }) map.setView([34.02, -118.805], 13); const accessToken = "YOUR_ACCESS_TOKEN"; const basemapEnum = "arcgis/streets"; L.esri.Vector.vectorBasemapLayer(basemapEnum, { token: accessToken }).addTo(map);
To learn about the other types of authentication available, go to Types of authentication.
Add script references
In addition to Leaflet and Esri Leaflet, reference the Leaflet Geoman plugin. The plugin allows you to create point, line, and polygon graphics on the map.
-
Add
<script>and<link>tags to reference the libraries.Use dark colors for code blocks <!-- Load Leaflet from CDN --> <link rel="stylesheet" href="https://unpkg.com/leaflet@1.9.4/dist/leaflet.css" crossorigin="" /> <script src="https://unpkg.com/leaflet@1.9.4/dist/leaflet.js" crossorigin=""></script> <!-- Load Esri Leaflet from CDN --> <script src="https://unpkg.com/esri-leaflet@3.0.12/dist/esri-leaflet.js"></script> <script src="https://unpkg.com/esri-leaflet-vector@4.2.3/dist/esri-leaflet-vector.js"></script> <!-- Load Leaflet Geoman from CDN --> <link rel="stylesheet" href="https://unpkg.com/@geoman-io/leaflet-geoman-free@latest/dist/leaflet-geoman.css" /> <script src="https://unpkg.com/@geoman-io/leaflet-geoman-free@latest/dist/leaflet-geoman.min.js"></script>
Add the parcels layer
Use the Feature class to perform a query against the LA County Parcels feature layer. Since you are performing a server-side query, you can hide the features.
-
Create a
Featureobject with the LA County Parcels hosted feature layer as its source.Layer Use dark colors for code blocks L.esri.Vector.vectorBasemapLayer(basemapEnum, { token: accessToken }).addTo(map); var parcels = L.esri .featureLayer({ url: "https://services3.arcgis.com/GVgbJbqm8hXASVYi/arcgis/rest/services/LA_County_Parcels/FeatureServer/0", simplifyFactor: 0.5, precision: 4, }) .addTo(map); -
Hide all features in the layer using a layer definition.
Use dark colors for code blocks var parcels = L.esri .featureLayer({ url: "https://services3.arcgis.com/GVgbJbqm8hXASVYi/arcgis/rest/services/LA_County_Parcels/FeatureServer/0", simplifyFactor: 0.5, precision: 4, where: "1 = 0" // Hide the feature layer until queried }) .addTo(map);
Set up the Geoman toolbar
You can use the Leaflet Geoman toolbar to create point, line, and polygon geometries via a user interface.
-
Add
map.pm.addto create the Geoman toolbar. Hide all buttons except forControls draw,Marker draw, andPolyline draw.Polygon Use dark colors for code blocks var parcels = L.esri .featureLayer({ url: "https://services3.arcgis.com/GVgbJbqm8hXASVYi/arcgis/rest/services/LA_County_Parcels/FeatureServer/0", simplifyFactor: 0.5, precision: 4, where: "1 = 0" // Hide the feature layer until queried }) .addTo(map); map.pm.addControls({ position:'topleft', // Customize the visible tools editControls:false, drawRectangle:false, drawCircle:false, drawCircleMarker:false, drawText:false }); -
Set
map.pm.setto define the style properties for the drawn geometries.Global Options Use dark colors for code blocks map.pm.addControls({ position:'topleft', // Customize the visible tools editControls:false, drawRectangle:false, drawCircle:false, drawCircleMarker:false, drawText:false }); map.pm.setGlobalOptions({ pathOptions: { weight: 2, color: "#4d4d4d", fillColor: "#808080", fillOpacity: 0.2, dashArray:[4, 4]} }); -
Click Run at the top right to test your code. You should be able to sketch a point, line, or polygon.
Get the drawn feature
Leaflet Geoman emits a p event when you have finished sketching a feature. You can listen to this event to respond to the newly created feature.
-
Add an event handler for the
pevent. Format its output to access the newm: create layerobject.Use dark colors for code blocks map.pm.setGlobalOptions({ pathOptions: { weight: 2, color: "#4d4d4d", fillColor: "#808080", fillOpacity: 0.2, dashArray:[4, 4]} }); map.on("pm:create", ({shape,layer}) => { }); -
Remove the
previouswith theLayer removemethod. Setpreviousto the newly drawnLayer layer.Use dark colors for code blocks var previousLayer; map.on("pm:create", ({shape,layer}) => { if (previousLayer) { previousLayer.remove(); } previousLayer = layer; });
Run the query
Use the Feature method to find features in the LA County Parcels feature layer that intersect the sketched geometry.
The maximum number of features returned by a query for hosted feature layers is 2000, except when using ids without setting a limit. To learn more, visit the ArcGIS services documentation.
-
Convert the sketched feature into GeoJSON to access its geometry. Create a query on the parcels layer that returns all parcels intersecting the sketched geometry.
Use dark colors for code blocks var previousLayer; map.on("pm:create", ({shape,layer}) => { if (previousLayer) { previousLayer.remove(); } previousLayer = layer; var feature = layer.toGeoJSON(); parcels .query() .intersects(feature.geometry) .limit(2000) }); -
Return the feature
ids. Display the results with thesetmethod.Where Use dark colors for code blocks var feature = layer.toGeoJSON(); parcels .query() .intersects(feature.geometry) .limit(2000) .ids(function (error, queryResult) { parcels.setWhere("OBJECTID IN (" + queryResult.join(",") + ")"); }); -
Create a pop-up using
bind. Set its contents dynamically based on the currently clicked feature.Popup Use dark colors for code blocks var feature = layer.toGeoJSON(); parcels .query() .intersects(feature.geometry) .limit(2000) .ids(function (error, queryResult) { parcels.setWhere("OBJECTID IN (" + queryResult.join(",") + ")"); }); }); parcels.bindPopup(function (layer) { return L.Util.template("<b>Parcel {APN}</b>" + "Type: {UseType} <br>" + "Tax Rate City: {TaxRateCity}", layer.feature.properties); });
Run the app
In CodePen, run your code to display the map.
When you click on the map to draw a polygon, a spatial query will run against the feature layer and display all land parcels that intersect the boundary of the feature. You can click on a parcel to see a pop-up with information about the parcel.
What's next?
Learn how to use additional ArcGIS location services in these tutorials:
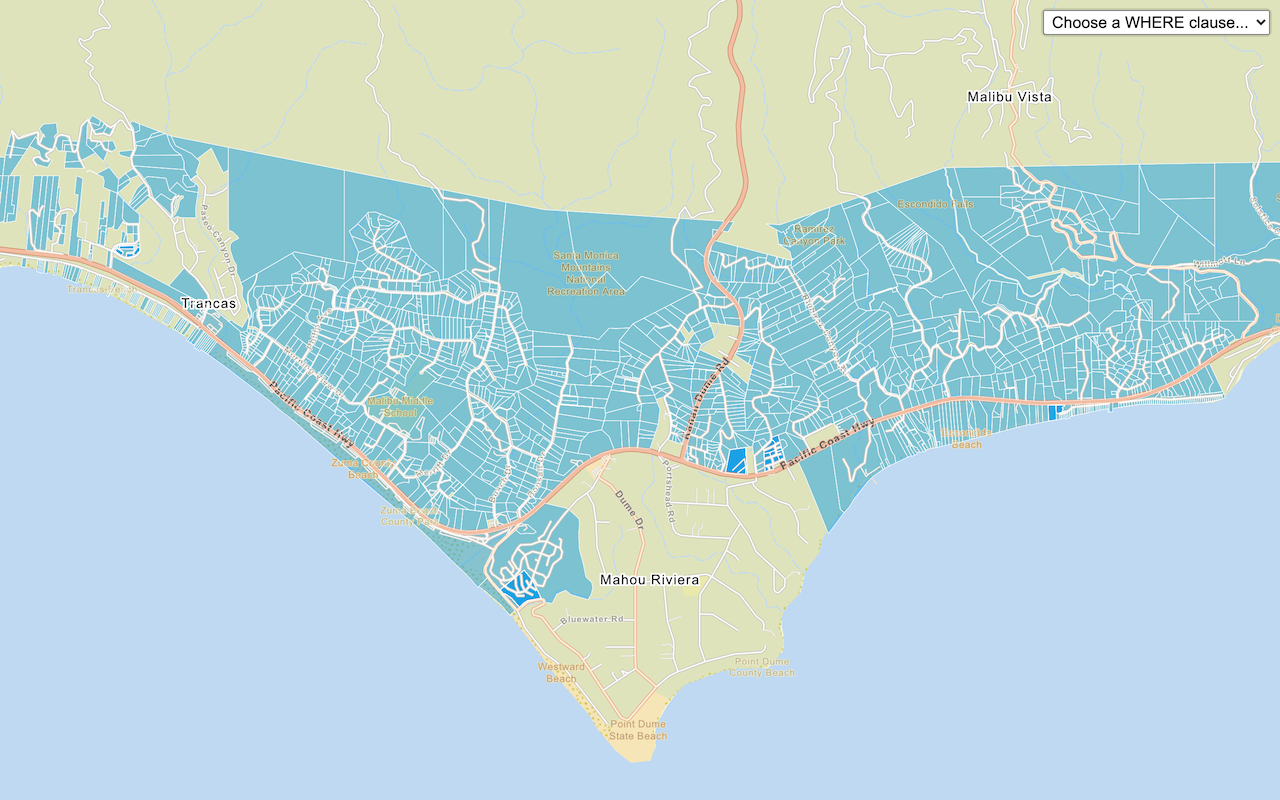
Query a feature layer (SQL)
Execute a SQL query to access polygon features from a feature layer.
Get global data
Query demographic information for locations around the world with the GeoEnrichment service.
Get local data
Query regional facts, spending trends, and psychographics with the GeoEnrichment service.
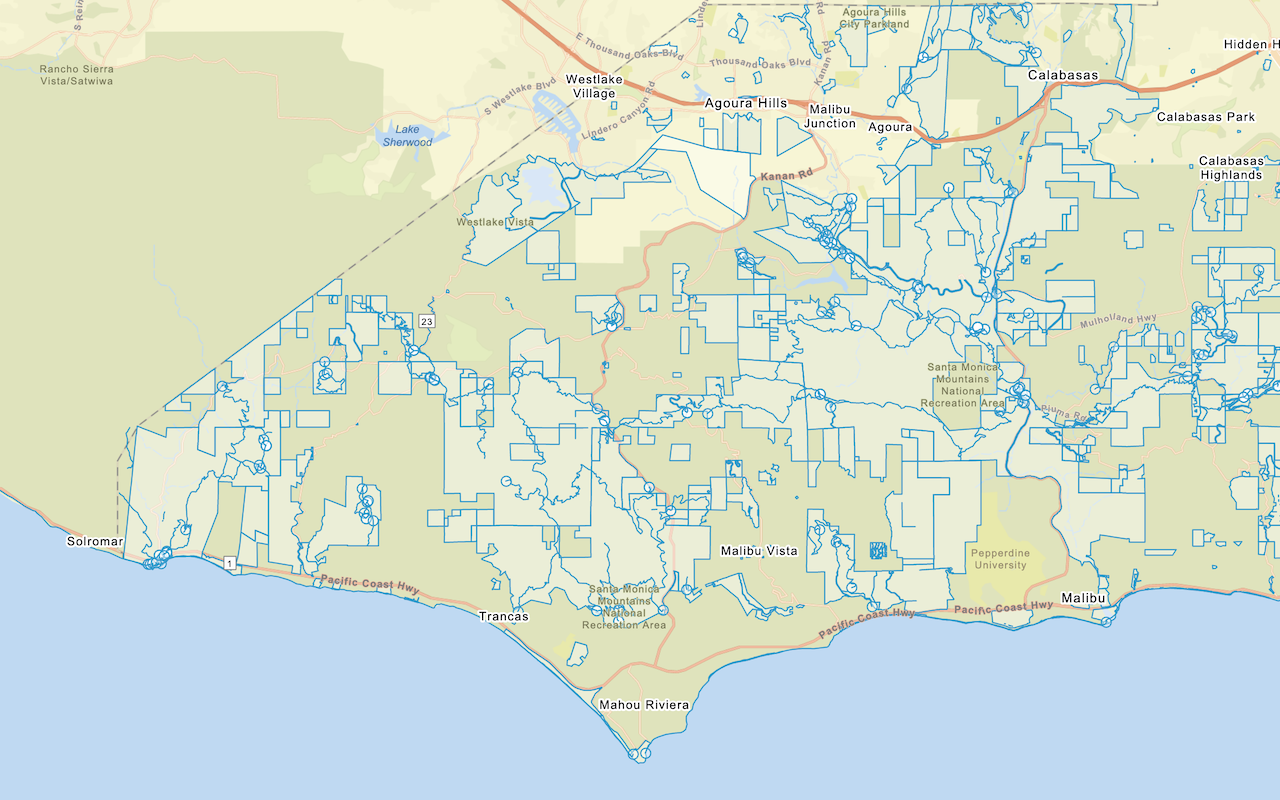
Add a feature layer
Add features from feature layers to a map.
Style a feature layer
Use data-driven styling to apply symbol colors and styles to feature layers.