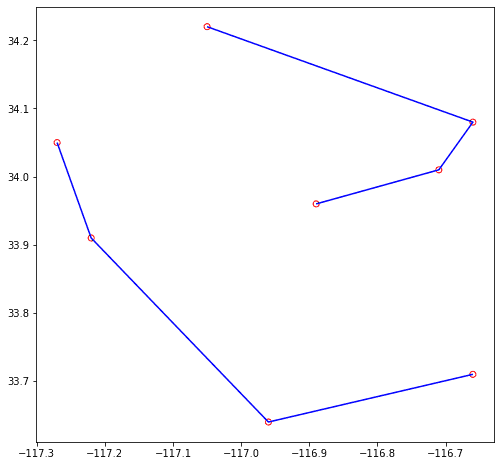
ST_Aggr_Linestring operates on a grouped DataFrame and returns linestrings created from the points in each
group. You can group your DataFrame using DataFrame.groupBy()
or with a GROUP BY clause in a SQL statement.
Points in each group will be connected in the order defined by a numeric column specified with order.
| Function | Syntax |
|---|---|
| Python | aggr |
| SQL | ST |
| Scala | aggr |
For more details, go to the GeoAnalytics Engine API reference for aggr_linestring.
Python and SQL Examples
from geoanalytics.sql import functions as ST
data = [
("POINT (-117.22 33.91)", 1, 1),
("POINT (-117.27 34.05)", 1, 0),
("POINT (-116.96 33.64)", 1, 2),
("POINT (-116.66 33.71)", 1, 3),
("POINT (-116.89 33.96)", 2, 0),
("POINT (-116.71 34.01)", 2, 1),
("POINT (-117.05 34.22)", 2, 3),
("POINT (-116.66 34.08)", 2, 2)
]
df = spark.createDataFrame(data, ["wkt", "id", "order"]) \
.withColumn("point", ST.point_from_text("wkt", srid=4326))
agg_df = df.groupBy("id").agg(ST.aggr_linestring("point", order_by="order").alias("linestring"))
ax = df.st.plot("point", facecolor="none", edgecolor="red", figsize=(15, 8))
agg_df.st.plot("linestring", ax=ax, facecolor="none", edgecolor="blue")
Scala Example
Scala
import com.esri.geoanalytics.sql.{functions => ST}
import org.apache.spark.sql.{functions => F}
case class PointRow(wkt: String, id: Integer, order: Integer)
val data = Seq(PointRow("POINT (-117.22 33.91)", 1, 1),
PointRow("POINT (-117.27 34.05)", 1, 0),
PointRow("POINT (-116.96 33.64)", 1, 2),
PointRow("POINT (-116.66 33.71)", 1, 3),
PointRow("POINT (-116.89 33.96)", 2, 0),
PointRow("POINT (-116.71 34.01)", 2, 1),
PointRow("POINT (-117.05 34.22)", 2, 3),
PointRow("POINT (-116.66 34.08)", 2, 2))
val df = spark.createDataFrame(data)
.withColumn("point", ST.pointFromText($"wkt", F.lit(4326)))
val aggDF = df.groupBy($"id").agg(ST.aggrLinestring($"point", $"order").alias("linestring"))
aggDF.show(truncate = false)Result
+---+-----------------------------------------------------------------------------+
|id |linestring |
+---+-----------------------------------------------------------------------------+
|1 |{"paths":[[[-117.27,34.05],[-117.22,33.91],[-116.96,33.64],[-116.66,33.71]]]}|
|2 |{"paths":[[[-116.89,33.96],[-116.71,34.01],[-116.66,34.08],[-117.05,34.22]]]}|
+---+-----------------------------------------------------------------------------+Version table
| Release | Notes |
|---|---|
1.2.0 | Python and SQL functions introduced |
1.5.0 | Scala function introduced |