ST_Centroid takes a geometry column and returns a point column that represents the centroid of each input geometry. The result point is not guaranteed to be on the surface of the geometry.
| Function | Syntax |
|---|---|
| Python | centroid(geometry) |
| SQL | ST |
| Scala | centroid(geometry) |
For more details, go to the GeoAnalytics Engine API reference for centroid.
This function implements the OpenGIS Simple Features Implementation Specification for SQL 1.2.1.
Python and SQL Examples
from geoanalytics.sql import functions as ST
data = [
("POINT (10 30)",),
("MULTIPOINT (0 0, 5 5, 0 5)", ),
("LINESTRING (15 15, 10 15, 12 2)", ),
("POLYGON ((20 30, 18 28, 22 35, 40 20))", )
]
df = spark.createDataFrame(data, ["wkt"])\
.select(ST.geom_from_text("wkt").alias("geometry"))
df = df.withColumn("centroid",ST.centroid("geometry"))
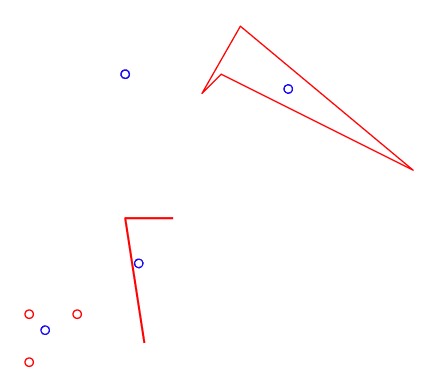
ax = df.st.plot("geometry", facecolor="none", edgecolor="red")
df.st.plot("centroid", ax=ax, facecolor="none", edgecolor="blue")
Scala Example
Scala
import com.esri.geoanalytics.sql.{functions => ST}
case class GeometryRow(wkt: String)
val data = Seq(GeometryRow("POINT (10 30)"),
GeometryRow("MULTIPOINT (0 0, 5 5, 0 5)"),
GeometryRow("LINESTRING (15 15, 10 15, 12 2)"),
GeometryRow("POLYGON ((20 30, 18 28, 22 35, 40 20))"))
val df = spark.createDataFrame(data)
.select(ST.geomFromText($"wkt").alias("geometry"))
.withColumn("centroid",ST.centroid($"geometry"))
df.select("centroid").show(truncate = false)Result
+-----------------------------------------------+
|centroid |
+-----------------------------------------------+
|{"x":10,"y":30} |
|{"x":1.6666666666666667,"y":3.3333333333333335}|
|{"x":11.413156069491516,"y":10.290342967796567}|
|{"x":26.984126984126984,"y":28.460317460317462}|
+-----------------------------------------------+Version table
| Release | Notes |
|---|---|
1.0.0 | Python and SQL functions introduced |
1.5.0 | Scala function introduced |