Bins to Raster converts square bins (typically the result of spatial aggregation) into a tiled raster stored as a SQL raster column. Each bin is rasterized to a single raster pixel, and one or more numeric bin attributes are written as raster pixel values. Each row in the output DataFrame represents one raster tile.

This tool is useful when summarizing spatial data within bins and converting the bins to raster format for integration with other raster datasets and workflows.
Usage notes
-
The input DataFrame must contain a bin column. Only square bins are supported. You can create square bins using square binning functions such as ST_SquareBin and ST_SquareBins. All bins are rasterized using the bin size defined during bin generation. The cell size is the same as the bin size.
-
Use
.setto specify one or more columns whose values will be written into the output raster. Each specified column becomes one raster band in the output, and the band order in the output raster matches the order of columns passed to the setter. Columns must be numeric.Band Value Columns() If a bin's band value is
NULL, the corresponding raster cell value is written asNounless a band default value is provided. The defaultData Novalue is 0.Data -
Use
.setto specify the number of columns and rows in each raster tile. Tiles are laid out on a global grid that always starts from the originTile Size() (0, 0)in raster coordinates. The tool builds the global grid first, and outputs only the subset of tiles that intersect the spatial extent of the input bins. -
The
.setsetter specifies the data type in the output raster cells. If it is not provided, the tool uses a default pixel type inferred from the input DataFrame. The selected pixel type is applied to all bands in the output raster and affects value precision and supported value range.Pixel Type() Supported pixel types are
uint1,uint2,uint4,uint8,uint16,uint32,int8,int16,int32,float32, andfloat64. Choose a pixel type that can represent the expected range of values for the band value columns to avoid overflow or loss of precision. -
You can optionally use
.setto set default values for each output raster band when a raster cell does not receive a value from any bin or when the input value isBands Default() NULL. One default value must be provided for each band specified in.set, and the order of the default values must match the band order.Band Value Columns() If a default value is provided, it is written to the raster cell instead of
Nofor that band. Default values must be compatible with selected pixel type.Data
Limitations
- Raster tiles are aligned to a global grid anchored at the origin
(0, 0)and may extend beyond the extents of the bin geometries. - Only square bins are supported.
- The tool does not perform spatial aggregation and only converts existing binning results to rasters.
Results
The tool returns a DataFrame containing raster tiles generated from the input DataFrame containing spatial binning results.
| Field | Description |
|---|---|
raster | A raster tile generated from the input DataFrame with bin geometries. Each row in the output represents a single raster tile, and together the tiles form the complete coverage for the area intersecting the input bins. |
Performance notes
Improve the performance of the Bins to Raster tool by doing one or more of the following:
-
Only analyze the records in your area of interest. You can pick the records of interest by using one of the following SQL functions:
- ST_Intersection—Clip to an area of interest represented by a polygon. This will modify your input records.
- ST_BboxIntersects—Select records that intersect an envelope.
- ST_EnvIntersects—Select records having an evelope that intersects the envelope of another geometry.
- ST_Intersects—Select records that intersect another dataset or area of intersect represented by a polygon.
- Larger bins will perform better than smaller bins.
Similar capabilities
Similar tools:
Syntax
For more details, go to the GeoAnalytics Engine API reference for bins to raster.
| Setter (Python) | Setter (Scala) | Description | Required |
|---|---|---|---|
run(dataframe) | run(input) | Runs the Bins to Raster tool using the provided DataFrame with square bins. | Yes |
set | set | Sets the bin column. | Yes |
set | set | Sets one or more numeric columns whose values will be written to raster bands. One band is created per column. | Yes |
set | set | Sets the tile size in number of columns and rows for the output rasters. Each output row is one tile of the size specified. | Yes |
set | set | Sets default values for each output raster band. The order of the default values matches the order of the band value columns. | No |
set | set | Sets pixel data type. Choose from uint1, uint2, uint4, uint8, uint16, uint32, int8, int16, int32, float32, and float64. | No |
Examples
Run Bins to Raster
# Imports
from geoanalytics.tools import BinsToRaster
from geoanalytics.sql import functions as ST
from pyspark.sql import functions as F
# Path to the school data
data_path = "https://services1.arcgis.com/Ua5sjt3LWTPigjyD/arcgis/rest/services/Public_School_Location_201819/FeatureServer/0"
# Summarizing the count of public schools in the US into bins
df = spark.read.format("feature-service").load(data_path)\
.where(ST.bbox_intersects("shape",xmin=-127.62,xmax=23.73,ymin=-64.08,ymax=50.59))\
.withColumn("bin", ST.square_bin("shape", 1))\
.groupBy("bin").count()\
.withColumn("count", F.col("count").cast("int"))
# Run the Bins to Raster tool to convert bins into rasters
rasters = BinsToRaster()\
.setBinColumn("bin")\
.setBandValueColumns("count")\
.setTileSize(16, 16)\
.run(df)
rasters.show(5)+--------------------+
| raster|
+--------------------+
|SqlRaster(1x16x16...|
|SqlRaster(1x16x16...|
|SqlRaster(1x16x16...|
|SqlRaster(1x16x16...|
|SqlRaster(1x16x16...|
+--------------------+
only showing top 5 rowsPlot results
# Visualize the rasters
result_plot = rasters.rt.plot(figsize=(14, 14), basemap="light", cmap = "Reds")
result_plot.set_title("Aggregate the count of public schools into square bins and rasterize the bins")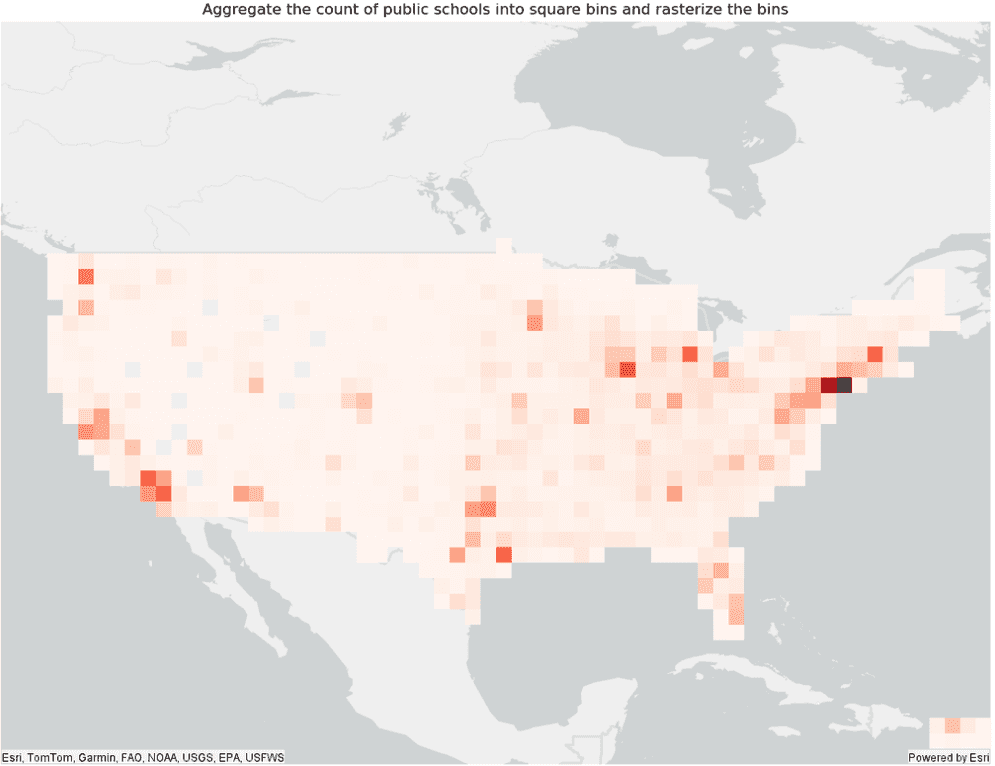
Version table
| Release | Notes |
|---|---|
2.0.0 | Python tool introduced |
2.0.0 | Scala tool introduced |