Geometry to Raster converts point, line, or polygon geometries into a tiled raster stored as a SQL raster column. The tool converts one or more columns into raster bands using a specified cell size and tile size. Each row in the output DataFrame represents one raster tile.

Usage notes
-
The input DataFrame must contain a geometry column with point, line, or polygon geometries. All geometries are converted to rasters defined by the cell size and tile size.
-
.setspecifies one or more attribute columns whose values will be written into the output rasters. Each specified column becomes one raster band in the output, and the band order in the output raster matches the order of columns passed to the setter. Columns must be numeric.Band Value Columns() When multiple geometries contribute to the same raster pixel (for example, multiple points in one pixel or overlapping polygons), the tool selects one geometry for the pixel value.
If a geometry's band value is
NULL, the corresponding raster pixel value is assignedNo. When multiple geometries contribute to the same cell,Data NULLvalues are ignored if at least one non-NULLvalue exists. -
Use
.setto specify how many columns and rows each tile contains. Tiles are laid out on a global grid that always starts from the originTile Size() (0, 0)in raster coordinates. The tool builds the global grid first, and outputs only the subset of tiles that intersect the input geometry. Because of this, tiles will not "start" at the geometry boundary, and are aligned to a global grid anchored at(0, 0)instead of the input geometry's extent. -
Use
.setto define the spatial resolution of the output raster in the units of the input coordinate system. Smaller cell sizes produce higher-resolution rasters with more details, and larger cell sizes produce lower-resolution rasters with fewer cells and more generalized results. Cells along feature boundaries may be assigned different values depending on the cell size.Cell Size() -
The
.setparameter specifies the data type in the output raster pixels. If it is not provided, the tool uses a default pixel type inferred from the input geometry DataFrame. The selected pixel type is applied to all bands in the output raster and affects value precision and supported value range.Pixel Type() Supported pixel types are
uint1,uint2,uint4,uint8,uint16,uint32,int8,int16,int32,float32, andfloat64. The short version of pixel type is also supported. For example,u1can be used instead ofuint1orf32instead offloat32. Also, the pixel type representation is bit-based. For example,u1is one bit and not one byte, which means that it uses one bit per pixel. Choose a pixel type that can represent the expected range of values for the band value columns to avoid overflow or loss of precision. -
You can optionally use
.setto set default values to use for each output raster band when a raster pixel does not receive a value from any input geometry or when the input band value isBands Default() NULL. One default value must be provided for each band specified in.set, and the order of the default values must match the band order.Band Value Columns() If a default value is provided, it is written to the raster cell instead of
Nofor that band. If band default is not set, cells with no contributing features orData NULLvalues are written asNo. Default values must be compatible with selected pixel type. The defaultData Novalue is 0.Data -
When multiple geometries contribute to the same pixel, use
.setto set how the tool assigns a value to the pixel. The default assignment type isCell Assignment Type() any, which assigns the value from any geometry contributing to the pixel in the input DataFrame. You can choose other assignment types listed in the table below.Options Description AnyAssigns any value among contributing geometries to the pixel. MinAssigns the minimum value among contributing geometries to the pixel. MaxAssigns the maximum value among contributing geometries to the pixel. MeanAssigns the mean value among contributing geometries to the pixel. SumAssigns the sum value among contributing geometries to the pixel. CountAssigns the number of valid values from contributing geometries and assign to the pixel. RangeAssigns the range of valid values from contributing geometries to the pixel. StandardDeviation Calculates the standard deviation among contributing geometries and assigns to the pixel. VarianceCalculates the variance among contributing geometries and assigns to the pixel. PriorityField Selects the contributing geometry with the highest value in a specified priority field and uses its value for the pixel. MaxLength (Lines only) Selects the line contributing the greatest length within the pixel and uses its value. MaxArea (Polygons only) Selects the polygon contributing the greatest area within the pixel and uses its value. CellCenter (Polygons only) Uses the polygon that contains the pixel center to determine the pixel value.
Limitations
- Raster tiles are aligned to a global grid anchored at the origin
(0, 0). The boundaries are not aligned to the input geometry extent, and the spatial extent of tiles may be beyond the geometry boundary.
Results
The tool returns a DataFrame containing raster tiles generated from the input geometries.
| Field | Description |
|---|---|
raster | A raster tile generated from the input geometries. Each row in the output represents a single raster tile, and together the tiles form the complete coverage for the area intersecting the input geometries. |
Performance notes
Improve the performance of the Geometry to Raster tool by doing one or more of the following:
-
Only analyze the records in your area of interest. You can pick the records of interest by using one of the following SQL functions:
- ST_Intersection—Clip to an area of interest represented by a polygon. This will modify your input records.
- ST_BboxIntersects—Select records that intersect an envelope.
- ST_EnvIntersects—Select records having an evelope that intersects the envelope of another geometry.
- ST_Intersects—Select records that intersect another dataset or area of intersect represented by a polygon.
- Larger cell size will perform better than smaller cell size.
Similar capabilities
Similar tools:
Syntax
For more details, go to the GeoAnalytics Engine API reference for geometry to raster.
| Setter (Python) | Setter (Scala) | Description | Required |
|---|---|---|---|
run(dataframe) | run(input) | Runs the Geometry to Raster tool using the provided DataFrame with geometry. | Yes |
set | set | Sets one or more columns whose values will be written to raster bands. One band is created per column. | Yes |
set | set | Sets the cell size in map units for the output rasters. | Yes |
set | set | Sets the tile size in number of columns and rows for the output rasters. Each output row is one tile of the size. | Yes |
set | set | Sets default values for each output raster band. The order of the default values matches the order of the band value columns. | No |
set | set | Sets pixel data type. Choose from uint1, uint2, uint4, uint8, uint16, uint32, int8, int16, int32, float32, and float64. | No |
set | set | Sets how a value is assigned to a pixel when multiple geometries contribute to the pixel. Choose from Any (default), Min, Max, Mean, Sum, Count, Range, Standard, Variance, Priority, Max, Max, and Cell. | No |
Examples
Run Geometry to Raster
# Imports
from geoanalytics.tools import GeometryToRaster
from geoanalytics.sql import functions as ST
from geoanalytics.raster import functions as RT
from pyspark.sql import functions as F
# Path to the Massachusetts population data
data_path = "https://services.arcgis.com/P3ePLMYs2RVChkJx/ArcGIS/rest/services/USA_Census_Tracts/FeatureServer/0"
# Create the geometry DataFrame
df = spark.read.format("feature-service").load(data_path)\
.filter(F.col("STATE_ABBR") == "MA")\
.withColumn("shape", ST.transform("shape", 2249))
# Run the Geometry to Raster tool
rasters = GeometryToRaster()\
.setCellSize(100, 100)\
.setTileSize(1024, 1024)\
.setBandValueColumns("POPULATION")\
.run(df)
rasters.show(5)+--------------------+
| raster|
+--------------------+
|SqlRaster(1x1024x...|
|SqlRaster(1x1024x...|
|SqlRaster(1x1024x...|
|SqlRaster(1x1024x...|
|SqlRaster(1x1024x...|
+--------------------+
only showing top 5 rowsPlot results
# Visualize the rasters
result_plot = rasters.rt.plot(figsize=(14,14), basemap="light")
result_plot = rasters.select(RT.extent("raster", 2249)).st.plot(ax=result_plot, facecolor="none", edgecolor="red")
result_plot.set_title("Rasterizing the population at the census tract level in Massachusetts")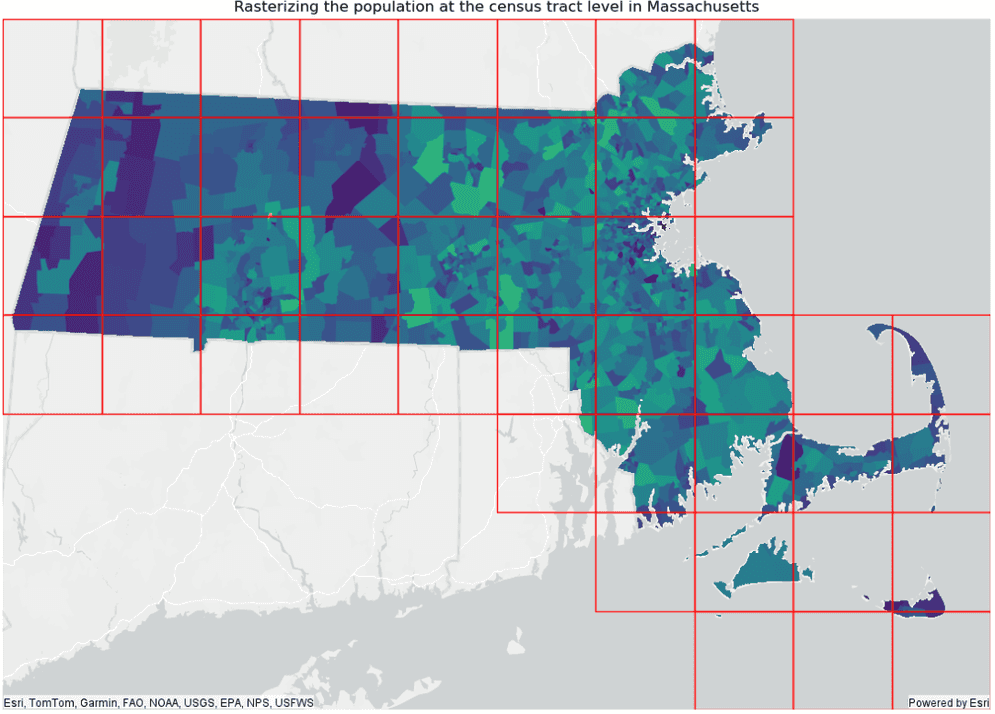
Version table
| Release | Notes |
|---|---|
2.0.0 | Python tool introduced |
2.0.0 | Scala tool introduced |