Snaps input track points to lines. The time-enabled point data must include observations that represent an instant in time. Traversable lines with fields indicating the from and to nodes are required for analysis.

Usage notes
- The following table outlines terminology for Snap Tracks:
| Term | Description |
|---|---|
| Track | A sequence of observations that are time enabled with time type instant. Observations are determined to be in the sequence by a track identifier field and are ordered by time. For example, a city could have a fleet of snowplow trucks that record their location every 10 minutes. The vehicle ID could represent the distinct tracks. |
| Observation | A point in a track. |
| Node | Nodes are the end vertices of lines used to indicate the direction of the line. The start of the line is the "from node" and the end of the line is the "to node". |
| Connectivity | Connectivity describes how lines are connected to represent a traversable network. Lines are connected based on their from node and to node values. Lines that cannot be reached by a point, based on connectivity, will not be considered a match. |
| Traversable | Lines are traversable if they are connected by common nodes. For example, if the from node of line A is the same as the to node for line B, they are traversable. |
-
The input DataFrame must contain time-enabled point observations that represent an instant in time. Track observations that do not have a valid timestamp will be excluded from analysis.
-
The input line DataFrame must contain fields with the following connectivity information and must be specified in the
setparameter:Connectivity Fields() - From node—The node that the travel along a line is moving away from.
- To node—The node that the travel along a line is moving to.
-
The spatial reference of the
pointsparameter value must be the same as the spatial reference of the_dataframe linesparameter value. If the datasets have different spatial references, transform and project one or both of the input DataFrames to the same spatial reference. If the spatial references are not the same, the tool will fail._dataframe -
You can specify one or more fields to identify tracks using
set. Tracks are represented by the unique combination of one or more track fields. For example, if theTrack Fields() vehicleandID Destinationfields are used as track identifiers, the observationsI,D007 21 First Ave.andI,D007 15 Main Streetwould be in different tracks since they have different values for theDestinationfield. -
Tracks must have more than one observation to be used in analysis. Tracks with only one observation will not be matched.
-
Point to line matches are made with the following considerations:
- The observation is within the search distance from a line. This is the minimum requirement. Observations will not be matched if they do not meet the search distance condition.
- The observation can traverse the lines based on their connectivity.
- The observation is travelling in a direction supported by the line. This is an optional condition that will be
made if you specify values for the
setparameter. Results that meet this optional condition will be more accurate.Direction Field Matching()
-
Use the
setparameter to specify the maximum distance allowed between an observation and a line. For example, if you know the accuracy of the GPS points is approximately 100 meters, specify 100 meters for the search distance.Search Distance()
-
Distances are calculated using the geodetic distance method by default when your input geometries are not projected. To override this default behavior, use
set. It is recommended that you use geodetic distance in the following circumstances:Distance Method() -
Tracks cross the antimeridian—When using the geodetic method, input DataFrames that cross the antimeridian will have tracks that correctly cross the antimeridian. Your input DataFrame or processing spatial reference must be set to a spatial reference that supports wrapping around the antimeridian, for example, a global projection such as World Cylindrical Equal Area.
-
Your DataFrame is not in a local projection—If your input DataFrame is in a local projection, use the planar distance method. For example, use the planar method to examine trace events within a single state. Your input DataFrame or processing spatial reference must be set to a spatial reference local to your dataset.
-
- You must use
setif your input data is in a projected coordinate system.Distance Method()
-
To include additional line attributes in the results, specify the field names using
set. These fields will not be used for analytical purposes and are included for your own use. You cannot include geometry fields in the output result.Append Fields() -
Use the
setparameter to define the supported directions for each line. For example, a line record has a field named direction with values T (backward), F (forward), B (both), and "" (none). Direction matching is optional but is recommended for accurate results. If no direction matching is specified, the line is assumed to be bidirectional.Direction Field Matching() -
You can split tracks in the following ways:
-
set- Splits tracks based on a time between input observations. Applying a time split breaks up any track when input data is farther apart than the specified time. For example, if you have five observations with the same track identifier and the times ofTime Split() [01and set a time split of 2 hours, any observations that are measured more than 2 hours apart will be split. In this example, the result would be a track with:00, 02 :00, 03 :30, 06 :00, 06 :30] [01and:00, 02 :00, 03 :30] [06, because the difference between 03:30 and 6:00 is greater than 2 hours.:00, 06 :30] -
set- Splits tracks based on defined time intervals. Applying a time boundary split segments tracks at a defined interval. For example, if you set the time boundary to 1 day, starting at 9:00 a.m. on January 1, 1990, each track will be truncated at 9:00 a.m. every day. This split accelerates computing time, as it creates smaller tracks for analysis. If splitting by a recurring time boundary makes sense for your analysis, it is recommended for big data processing.Time Boundary Split() -
set- Splits tracks based on a distance between input observations. Applying a distance split breaks up any track when input data is farther apart than the specified distance. For example, if you set a distance split of 5 kilometers, sequential observations greater than 5 kilometers apart will be part of a different track.Distance Split()
-
-
You can apply none, one, two, or three split options at the same time.
-
The tool returns points snapped to the nearest location along the line it matched. The lines are not returned. The unique identifier of the line dataset will be available for matched results. The unique identifier field is specified using the
setparameter. You can identify the matched-to lines by referencing this field.Connectivity Fields()
Results
The tool outputs snapped points and includes the following fields:
| Field | Description |
|---|---|
Match | Indicates whether the observation was matched to a line. Values are M for matched observations and U for unmatched observations. |
Orig | The x-coordinate of the input observation. Coordinates are stored in the units of the output spatial reference. |
Orig | The y-coordinate of the input observation. Coordinates are stored in the units of the output spatial reference. |
Match | The x-coordinate of the matched result on the line. Coordinates are stored in the units of the output spatial reference. |
Match | The y-coordinate of the matched result on the line. Coordinates are stored in the units of the output spatial reference. |
Match | The distance between the origin location and the matched location for an observation. Distances are calculated based on the distance method selected (geodetic or planar). Values are recorded in meters. |
Date | The time stamp of the observation. |
Performance notes
Improve the performance of Snap Tracks by doing one or more of the following:
-
Only analyze the records in your area of interest. You can pick the records of interest by using one of the following SQL functions:
- ST_Intersection—Clip to an area of interest represented by a polygon. This will modify your input records.
- ST_BboxIntersects—Select records that intersect an envelope.
- ST_EnvIntersects—Select records having an evelope that intersects the envelope of another geometry.
- ST_Intersects—Select records that intersect another dataset or area of intersect represented by a polygon.
- Use the planar method instead of geodetic.
- Select a smaller search distance.
- Split your tracks using one of the splitting options.
setwill have the biggest performance gains.Time Boundarysplit()
Similar functions
Syntax
For more details, go to the GeoAnalytics Engine API reference for snap tracks.
| Setter (Python) | Setter (Scala) | Description | Required |
|---|---|---|---|
run(points | run(points, lines) | Runs the Snap Tracks tool using the provided observations and lines. | Yes |
set | set | One or more fields from the input line DataFrame that will be included in the output result. | No |
set | set | The line DataFrame fields that will be used to define the connectivity of the input lines. | Yes |
set | set | The line field and attribute values that will be used to define the direction of the input line features. | No |
set | set | Sets the method used to calculate distances between track observations. There are two methods to choose from: ' or '. See Usage notes for the default option. | Required when track observations have projected coordinates. |
set | set | Sets the distance used to split tracks. Any observations in the input DataFrame that are in the same track and are farther apart than this distance will be split into a new track. If both the distance split and the time split are used, the track is split when at least one condition is met. | No |
set | set | Sets the result type. Options are ' (default) or '. | No |
set | set | The maximum distance allowed between a point and any line to be considered a match. | Yes |
set | set | Sets boundaries to limit calculations to defined spans of time. | No |
set | set | Sets the time duration used to split tracks. | No |
set | set | Sets one or more fields used to identify distinct tracks. | Yes |
Examples
Run Snap Tracks
# Imports
from geoanalytics.tools import SnapTracks
# URLs to Somerville track observation samples and streets
fs_obs_url = "https://services1.arcgis.com/36PP9fe9l4BSnArw/arcgis/rest/services/Somerville_Track_Demo/FeatureServer/0"
fs_streets_url = "https://services1.arcgis.com/36PP9fe9l4BSnArw/arcgis/rest/services/Somerville_Track_Demo/FeatureServer/1"
# Create a DataFrame for the observations, and for the streets
df_obs = spark.read.format("feature-service").load(fs_obs_url)
df_streets = spark.read.format("feature-service").load(fs_streets_url)
# Snap tracks using the device ID as the track identifier (one track in this example), and snap within 10 meters
result = SnapTracks() \
.setTrackFields("device_id") \
.setSearchDistance(search_distance=10, search_distance_unit="Meters") \
.setDistanceMethod(distance_method="Geodetic") \
.setConnectivityFields(from_node="to_node", to_node="from_node") \
.setDirectionFieldMatching(direction_field="dirtravel", forward_value="FT",
backward_value="", both_value="", none_value="") \
.setOutputMode(output_mode="AllPoints") \
.run(df_obs, df_streets)
# Show 5 of the resulting snapped points and some of the fields generated by the Snap Tracks tool
result.select("OrigX", "OrigY", "MatchX", "MatchY", "MatchDistance", "MatchStatus").show(5)+------------------+------------------+------------------+------------------+------------------+-----------+
| OrigX| OrigY| MatchX| MatchY| MatchDistance|MatchStatus|
+------------------+------------------+------------------+------------------+------------------+-----------+
|-71.13089616399998| 42.40652350400006|-71.13087437825094| 42.40650913907218|2.4005357841483566| M|
|-71.13105933099996| 42.40627649000004|-71.13103734123595| 42.40626199055026|2.4230211177628846| M|
|-71.13125732199995|42.406016547000036|-71.13121679850428|42.405989826913796| 4.465237342078937| M|
|-71.13166744799997| 42.40603550700007| -71.1316405003088| 42.4059621003707| 8.450473655268105| M|
|-71.13199188199997| 42.40616438300003|-71.13200194392499| 42.4061444057002|2.3686538197215783| M|
+------------------+------------------+------------------+------------------+------------------+-----------+
only showing top 5 rowsPlot results
# Plots the map using the extent of the point data, plus some small adjustment to show all points
points_extent = result.st.get_extent()
adj = 0.0002
# Add the streets, original observations points, and snapped points to the plot
lines_ax = df_streets.st.plot(aspect="equal", color="grey", figsize=(16,10))
points_ax = df_obs.st.plot(ax=lines_ax, color="red", label='Input observations')
points_ax.set(xlim=((points_extent.min_x-adj), points_extent.max_x+adj),
ylim=(points_extent.min_y-adj, points_extent.max_y+adj))
points_ax = result.st.plot(ax=points_ax, color="green",legend = True,
label='Snapped results', basemap="light")
leg = points_ax.legend(loc=2)
points_ax.set_title("Observations and snapped results");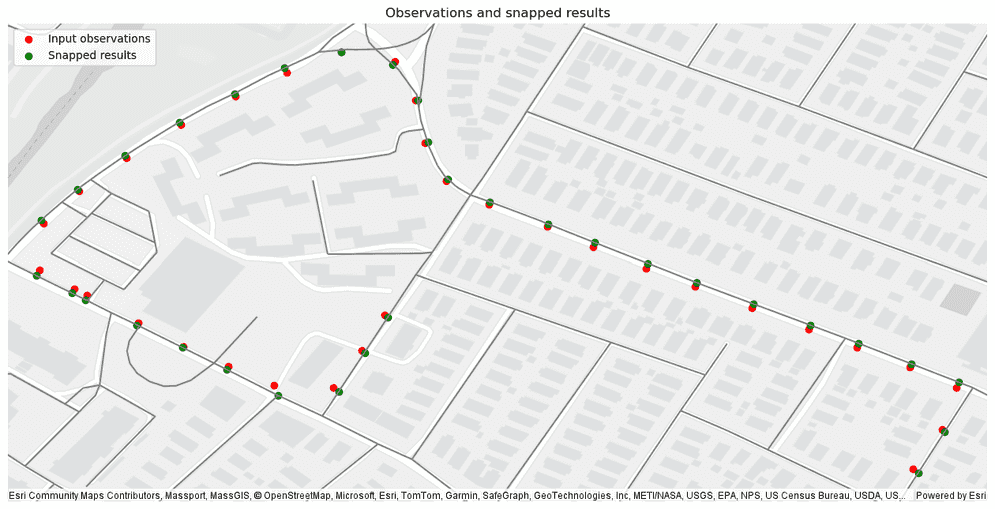
Version table
| Release | Notes |
|---|---|
1.1.0 | Python tool introduced |
1.6.0 | Scala tool introduced |