This tutorial demonstrates how to read and write raster datasets. GeoAnalytics Engine supports reading the following raster file formats:
- GTiff
- JPEG
- PNG
You can write a raster column to the same formats for data storage or export to other systems.
Additional details and parameters that can be used to configure reading and writing raster data can be found in the Raster data source documentation.
Read TIF data
Prepare your input raster
-
In this tutorial, we will use a small multiband image from the United States Geological Survey's National Agriculture Image Program (NAIP). Note that the image provided for use is a clipped piece of a larger NAIP image. The file when unzipped contains both a TIF and TFW file.
The file can be downloaded here.
Python Python Scala Use dark colors for code blocks Copy # raster dataset location raster_data_loc = r"data\m_4209351_se_15_030_20230902_clip.tif"
Set up the workspace
- Import the required modules.
Python Python Scala Use dark colors for code blocks Copy # Import the required modules import geoanalytics from geoanalytics.sql import functions as ST from geoanalytics.raster import functions as RT geoanalytics.auth(username="user1", password="p@ssword")
Read from your raster file
-
You can read directly with the
rasterformat option.This will result in a DataFrame with all of the raster data stored in a raster column. Larger raster datasets will be broken into multiple tiles (DataFrame rows) to improve performance.
Python Python Scala Use dark colors for code blocks Copy # Read the raster into a DataFrame df_raster = spark.read.format("raster").load(raster_data_loc) -
Reading in a raster creates a dataframe with two columns -
- Path to the input file/tile
- Raster information
Python Python Scala Use dark colors for code blocks Copy # Show the schema of your Dataframe df_raster.printSchema()ResultUse dark colors for code blocks Copy root |-- path: string (nullable = true) |-- raster: raster (nullable = true) -
Look at those details in the table.
The first table below shows a truncated element for each of the tiles that were created, while the next cell after shows details for one tile in a more readable format.
Python Python Scala Use dark colors for code blocks Copy df_raster.show()ResultUse dark colors for code blocks Copy +--------------------+--------------------+ | path| raster| +--------------------+--------------------+ |file:/C:/_data/ra...|SqlRaster(4x1024x...| |file:/C:/_data/ra...|SqlRaster(4x1024x...| |file:/C:/_data/ra...|SqlRaster(4x1024x...| |file:/C:/_data/ra...|SqlRaster(4x1024x...| |file:/C:/_data/ra...|SqlRaster(4x935x1...| |file:/C:/_data/ra...|SqlRaster(4x1024x...| |file:/C:/_data/ra...|SqlRaster(4x1024x...| |file:/C:/_data/ra...|SqlRaster(4x1024x...| |file:/C:/_data/ra...|SqlRaster(4x1024x...| |file:/C:/_data/ra...|SqlRaster(4x935x8...| +--------------------+--------------------+Python Python Scala Use dark colors for code blocks Copy df_raster.show(1, vertical=True, truncate=False)ResultUse dark colors for code blocks Copy -RECORD 0---------------------------------------------------------------------- path | file:/C:/_workbooks/raster/data/m_4209351_se_15_030_20230902_clip.tif raster | SqlRaster(4x1024x1024, UInt8) only showing top 1 row -
Look at one tile to see size and confirm that it is 1024x1024.
Python Python Scala Use dark colors for code blocks Copy df_raster.limit(1).select( RT.num_columns("raster"), RT.num_rows("raster")).show(truncate=False)ResultUse dark colors for code blocks Copy +------------------+---------------+ |NumColumns(raster)|NumRows(raster)| +------------------+---------------+ |1024 |1024 | +------------------+---------------+ -
Change the tile sizes of the raster.
Python Python Scala Use dark colors for code blocks Copy # read in the same raster file with larger tile sizes df_raster_small_tile = spark.read.format("raster")\ .option("tileColumns", 2048)\ .option("tileRows", 2048)\ .load(raster_data_loc) # show the table df_raster_small_tile.show() # show the tile size # note that in this dataset example there are fewer than 2048 rows in the input, so the tiles only have 1910 rows) df_raster_small_tile.select( RT.num_columns("raster"), RT.num_rows("raster")).show(truncate=False)ResultUse dark colors for code blocks Copy +--------------------+--------------------+ | path| raster| +--------------------+--------------------+ |file:/C:/_workboo...|SqlRaster(4x2048x...| |file:/C:/_workboo...|SqlRaster(4x2048x...| |file:/C:/_workboo...|SqlRaster(4x935x1...| +--------------------+--------------------+ +------------------+---------------+ |NumColumns(raster)|NumRows(raster)| +------------------+---------------+ |2048 |1910 | |2048 |1910 | |935 |1910 | +------------------+---------------+ -
By default, rasters are loaded as a reference file path to a raster, using the
materializeoption, the pixels of the raster are loaded as byte data and stored in memory.Python Python Scala Use dark colors for code blocks Copy df_materialize = spark.read.format("raster").option("materialize", True).load(raster_data_loc)
Read JPEG data
When reading raster data in JPG format, there is usually a world file (.tfw) stored along with the JPG file to georeference the pixel values stored in the JPG file. When the .tfw file is not present, loading in a raster from JPG requires extra steps to set the spatial reference and extent before performing any raster analysis.
Read from your raster file
-
Read in raster from JPG file.
Python Python Scala Use dark colors for code blocks Copy df = spark.read.format("raster") \ .load(r"data\m_4209351_se_15_030_20230902_clip.jpg") \ .groupBy().agg(RT.merge(F.collect_list("raster")).alias("raster")) # merge all tiles into one raster -
Check the spatial reference of the input raster read from JPEG. Note that the spatial reference ID is returned as NULL as expected.
Python Python Scala Use dark colors for code blocks Copy df.select(RT.info("raster").srid).show()ResultUse dark colors for code blocks Copy +-----------------+ |Info(raster).srid| +-----------------+ | NULL| +-----------------+ -
Set spatial reference and spatial extent of the raster.
Python Python Scala Use dark colors for code blocks Copy # set sr and spatial extent df_updated = df.select(RT.set_extent(RT.srid("raster", 26915), 444822.9, 4666574.399999999, 446332.2, 4667147.399999999).alias("raster"))Python Python Scala Use dark colors for code blocks Copy # get sr and spatial extent df_updated.select(RT.info("raster").srid).show() df_updated.select(RT.info("raster").extent).show(truncate=False)ResultUse dark colors for code blocks Copy +-----------------+ |Info(raster).srid| +-----------------+ | 26915| +-----------------+ +----------------------------------------------------------+ |Info(raster).extent | +----------------------------------------------------------+ |[444822.9, 4666574.399999999, 446332.2, 4667147.399999999]| +----------------------------------------------------------+ -
Plot the raster
PythonUse dark colors for code blocks Copy df_updated.rt.plot(cmap="cividis", alpha=0.8)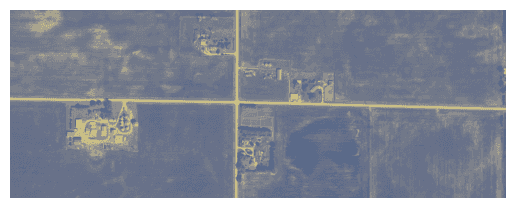
Read from image services
Image services hosted on ArcGIS Online can be loaded as raster datasets.
The URL for an image service layer hosted in ArcGIS Online typically resembles the following pattern: https
Read from your hosted raster
When loading a public image service layer, you can pass the URL without options gis or token:
spark.read.format("image-service").load(URL)When loading a secured image service layer, a GIS connection or token will be required. For example:
geoanalytics.register_gis("myGIS", username="username", password="password")
spark.read.format("image-service").option("gis", "myGIS").load(URL)Write shapefiles
In this section we demonstrate writing to a raster.
Output raster datasets can be written as:
- GTiff
- JPEG
- PNG
Output files can be written to:
- Any file system that your Spark environment can write to (e.g., local environment, Azure blob, S3, etc.)
- ArcGIS Online
Write TIF data
Use a defined dataset to create a DataFrame and write it to TIF.
-
Check that we have a spatial reference assigned.
Python Python Scala Use dark colors for code blocks Copy df_raster.limit(1).select(RT.srid("raster")).show() -
By default, write outputs to TIF.
Python Python Scala Use dark colors for code blocks Copy df_raster\ .write.options(noDataPolicy = "best-effort").format("raster")\ .save(r"raster\raster_output")We will end up with one .tif for each row in our DataFrame.
-
Read back in the data.
Python Python Scala Use dark colors for code blocks Copy df_raster_readback = spark.read.format("raster").load(r"raster\raster_output") df_raster_readback.show()ResultUse dark colors for code blocks Copy +--------------------+--------------------+ | path| raster| +--------------------+--------------------+ |file:/C:/_workboo...|SqlRaster(4x1024x...| |file:/C:/_workboo...|SqlRaster(4x1024x...| |file:/C:/_workboo...|SqlRaster(4x1024x...| |file:/C:/_workboo...|SqlRaster(4x1024x...| |file:/C:/_workboo...|SqlRaster(4x935x1...| |file:/C:/_workboo...|SqlRaster(4x1024x...| |file:/C:/_workboo...|SqlRaster(4x1024x...| |file:/C:/_workboo...|SqlRaster(4x1024x...| |file:/C:/_workboo...|SqlRaster(4x1024x...| |file:/C:/_workboo...|SqlRaster(4x935x8...| +--------------------+--------------------+ -
Double-check the properties of the raster.
Python Python Scala Use dark colors for code blocks Copy df_raster_readback.limit(1).select(RT.extent("raster"), RT.cell_size_x("raster"), RT.cell_size_y("raster"), RT.num_bands("raster"), RT.num_columns("raster"), RT.num_rows("raster"), RT.pixel_type("raster"), RT.srid("raster"))\ .show(vertical=True,truncate=False)ResultUse dark colors for code blocks Copy -RECORD 0------------------------------------------------------------------------------------------------------------------------------------------------------------------------------------------------ Extent(raster) | {"rings":[[[444822.9,4666840.199999999],[444822.9,4667147.399999999],[445130.10000000003,4667147.399999999],[445130.10000000003,4666840.199999999],[444822.9,4666840.199999999]]]} CellSizeX(raster) | 0.30000000000001137 CellSizeY(raster) | 0.3000000000001819 NumBands(raster) | 4 NumColumns(raster) | 1024 NumRows(raster) | 1024 PixelType(raster) | UInt8 Srid(raster) | 26915
Merge tiles to create a single raster output
Let's look at an example to merge all of our individual tiles into a single raster for output.
We will use RT and collect to combine the rows.
-
Merge tiles to combine rows.
Python Python Scala Use dark colors for code blocks Copy # using RT_Merge to combine the tiles import pyspark.sql.functions as F df_raster_merge = df_raster.agg(RT.merge(F.collect_list("raster")).alias("raster")) # just one row now df_raster_merge.show()ResultUse dark colors for code blocks Copy +--------------------+ | raster| +--------------------+ |SqlRaster(4x5031x...| +--------------------+ -
Write it out, and we just get one .tif (+ auxiliary files).
Python Python Scala Use dark colors for code blocks Copy df_raster_merge\ .write.options(noDataPolicy = "best-effort").format("raster")\ .save(r"raster\raster_output_merge")
Write to ArcGIS Online
Rasters can also be written to ArcGIS Online as Image Services.
-
You will need to authenticate with ArcGIS Online first.
Python Python Scala Use dark colors for code blocks Copy # authenticate with AGOL geoanalytics.register_gis("myGIS", "https://arcgis.com", username="username", password="password")Python Python Scala Use dark colors for code blocks Copy # write to image service df_raster_merge.write.format("image-service") \ .option("gis", "myGIS") \ .option("serviceName", "write_raster_test") \ .option("fieldName", "raster") \ .save()
We can see the result in the "My Content" tab in ArcGIS Online.

And we can then map the result using the online map.

What's next?
Learn about how to read in other data types or analyze your data through raster functions and analysis tools: