Learn how to display point, line, and polygon graphics
You typically use graphics
In this tutorial, you display points, lines, and polygons on a map as graphics
Prerequisites
Before starting this tutorial:
-
You need an ArcGIS Location Platform or ArcGIS Online account.
-
Confirm that your system meets the minimum system requirements.
-
An IDE for Java.
Steps
Open a Java project with Gradle
-
To start this tutorial, complete the Display a map tutorial, or download and unzip the Display a map solution into a new folder.
-
Open the build.gradle file as a project in IntelliJ IDEA.
-
If you downloaded the solution, get an access token and set the API key.
An API key
An API key is a long-lived access token created using API key credentials. They are valid for up to one year and are typically embedded directly into client applications. gives your app access to secure resourcesA secure resource is any item or service in an ArcGIS that requires an ArcGIS account and authentication to access. Examples include ArcGIS Location Services, and items and data services in an ArcGIS portal. used in this tutorial.-
Go to the Create an API key tutorial to obtain a new API key access token
An access token is an authorization string that provides access to secure ArcGIS content, data, and services. Its capabilities are determined by the privileges it supports. It is obtained by implementing API key authentication, User authentication, or App authentication. using your ArcGIS Location PlatformAn ArcGIS Location Platform account, formerly known as an ArcGIS Developer account, is an identity associated with an ArcGIS Location Platform subscription. or ArcGIS OnlineAn ArcGIS Online account, also known as an ArcGIS Organization account, is an identity associated with an ArcGIS Online subscription. It can be used to access ArcGIS tools and develop applications with ArcGIS location services for an organization. account. Ensure that the following privilegePrivileges are a set of permissions assigned to ArcGIS accounts, developer credentials, and applications that grant access to secure resources and functionality in ArcGIS. is enabled: Location services > Basemaps > Basemap styles service. Copy the access token as it will be used in the next step. -
In IntelliJ IDEA’s Project tool window, open src/main/java/com.example.app and double-click App.
-
In the
start()method, set the API key property on theArcGISRuntimeEnvironmentwith your access tokenAn access token is an authorization string that provides access to secure ArcGIS content, data, and services. Its capabilities are determined by the privileges it supports. It is obtained by implementing API key authentication, User authentication, or App authentication. . Replace YOUR_ACCESS_TOKEN with your copied access token. Be sure to surround your access token with double quotes as it is a string.App.javaArcGISRuntimeEnvironment.setApiKey("YOUR_ACCESS_TOKEN");
-
Add import statements
Add import statements to reference the API classes.
-
In IntelliJ IDEA’s Project tool window, open src/main/java/com.example.app and double-click App.
-
Add the following imports above the existing imports:
App.javaimport com.esri.arcgisruntime.geometry.Point;import com.esri.arcgisruntime.geometry.PointCollection;import com.esri.arcgisruntime.geometry.Polygon;import com.esri.arcgisruntime.geometry.Polyline;import com.esri.arcgisruntime.geometry.SpatialReferences;import com.esri.arcgisruntime.mapping.view.Graphic;import com.esri.arcgisruntime.mapping.view.GraphicsOverlay;import com.esri.arcgisruntime.symbology.SimpleFillSymbol;import com.esri.arcgisruntime.symbology.SimpleLineSymbol;import com.esri.arcgisruntime.symbology.SimpleMarkerSymbol;import com.esri.arcgisruntime.ArcGISRuntimeEnvironment;import com.esri.arcgisruntime.mapping.ArcGISMap;import com.esri.arcgisruntime.mapping.BasemapStyle;import com.esri.arcgisruntime.mapping.Viewpoint;import com.esri.arcgisruntime.mapping.view.MapView;
Add a graphics overlay
A graphics overlay
-
In the
start()method, create a newGraphicsOverlayand add it to themapView.App.java68 collapsed lines// Copyright 2020 Esri// Licensed under the Apache License, Version 2.0 (the "License");// you may not use this file except in compliance with the License.// You may obtain a copy of the License at//// http://www.apache.org/licenses/LICENSE-2.0//// Unless required by applicable law or agreed to in writing, software// distributed under the License is distributed on an "AS IS" BASIS,// WITHOUT WARRANTIES OR CONDITIONS OF ANY KIND, either express or implied.// See the License for the specific language governing permissions and// limitations under the License.package com.example.app;import com.esri.arcgisruntime.geometry.Point;import com.esri.arcgisruntime.geometry.PointCollection;import com.esri.arcgisruntime.geometry.Polygon;import com.esri.arcgisruntime.geometry.Polyline;import com.esri.arcgisruntime.geometry.SpatialReferences;import com.esri.arcgisruntime.mapping.view.Graphic;import com.esri.arcgisruntime.mapping.view.GraphicsOverlay;import com.esri.arcgisruntime.symbology.SimpleFillSymbol;import com.esri.arcgisruntime.symbology.SimpleLineSymbol;import com.esri.arcgisruntime.symbology.SimpleMarkerSymbol;import com.esri.arcgisruntime.ArcGISRuntimeEnvironment;import com.esri.arcgisruntime.mapping.ArcGISMap;import com.esri.arcgisruntime.mapping.BasemapStyle;import com.esri.arcgisruntime.mapping.Viewpoint;import com.esri.arcgisruntime.mapping.view.MapView;import javafx.application.Application;import javafx.scene.Scene;import javafx.scene.layout.StackPane;import javafx.scene.paint.Color;import javafx.stage.Stage;public class App extends Application {private MapView mapView;public static void main(String[] args) {Application.launch(args);}@Overridepublic void start(Stage stage) {// set the title and size of the stage and show itstage.setTitle("Add a point line and polygon tutorial");stage.setWidth(800);stage.setHeight(700);stage.show();// create a JavaFX scene with a stack pane as the root node// and add it to the sceneStackPane stackPane = new StackPane();Scene scene = new Scene(stackPane);stage.setScene(scene);ArcGISRuntimeEnvironment.setApiKey("YOUR_ACCESS_TOKEN");// create a map view to display the map and add it to the stack panemapView = new MapView();stackPane.getChildren().add(mapView);ArcGISMap map = new ArcGISMap(BasemapStyle.ARCGIS_TOPOGRAPHIC);// set the map on the map viewmapView.setMap(map);mapView.setViewpoint(new Viewpoint(34.02700, -118.80543, 72223.819286));// create a graphics overlay and add it to the map viewGraphicsOverlay graphicsOverlay = new GraphicsOverlay();mapView.getGraphicsOverlays().add(graphicsOverlay);4 collapsed lines}}
Add a point graphic
A point graphic
-
Create a
Point,SimpleMarkerSymbol, andSimpleLineSymbol.-
To create the
Point, provide longitude and latitude coordinates, and aSpatialReference. Use theSpatialReferences.getWgs84()convenience getter. -
To create the
SimpleMarkerSymbol, provide the shape that makes up the symbolA symbol defines the properties used to display a geometry or text. , the interior color of the symbol, and the size of the area to place the symbol in. -
To create the
SimpleLineSymbol, provide the pattern that makes up the area of the symbol, the interior color of the symbol, and the thickness of the symbol in density-independent pixels (i.e. dp). -
Set the outline of the
SimpleMarkerSymbolusing itssetOutline()method and passing in theSimpleLineSymbol.App.java72 collapsed lines// Copyright 2020 Esri// Licensed under the Apache License, Version 2.0 (the "License");// you may not use this file except in compliance with the License.// You may obtain a copy of the License at//// http://www.apache.org/licenses/LICENSE-2.0//// Unless required by applicable law or agreed to in writing, software// distributed under the License is distributed on an "AS IS" BASIS,// WITHOUT WARRANTIES OR CONDITIONS OF ANY KIND, either express or implied.// See the License for the specific language governing permissions and// limitations under the License.package com.example.app;import com.esri.arcgisruntime.geometry.Point;import com.esri.arcgisruntime.geometry.PointCollection;import com.esri.arcgisruntime.geometry.Polygon;import com.esri.arcgisruntime.geometry.Polyline;import com.esri.arcgisruntime.geometry.SpatialReferences;import com.esri.arcgisruntime.mapping.view.Graphic;import com.esri.arcgisruntime.mapping.view.GraphicsOverlay;import com.esri.arcgisruntime.symbology.SimpleFillSymbol;import com.esri.arcgisruntime.symbology.SimpleLineSymbol;import com.esri.arcgisruntime.symbology.SimpleMarkerSymbol;import com.esri.arcgisruntime.ArcGISRuntimeEnvironment;import com.esri.arcgisruntime.mapping.ArcGISMap;import com.esri.arcgisruntime.mapping.BasemapStyle;import com.esri.arcgisruntime.mapping.Viewpoint;import com.esri.arcgisruntime.mapping.view.MapView;import javafx.application.Application;import javafx.scene.Scene;import javafx.scene.layout.StackPane;import javafx.scene.paint.Color;import javafx.stage.Stage;public class App extends Application {private MapView mapView;public static void main(String[] args) {Application.launch(args);}@Overridepublic void start(Stage stage) {// set the title and size of the stage and show itstage.setTitle("Add a point line and polygon tutorial");stage.setWidth(800);stage.setHeight(700);stage.show();// create a JavaFX scene with a stack pane as the root node// and add it to the sceneStackPane stackPane = new StackPane();Scene scene = new Scene(stackPane);stage.setScene(scene);ArcGISRuntimeEnvironment.setApiKey("YOUR_ACCESS_TOKEN");// create a map view to display the map and add it to the stack panemapView = new MapView();stackPane.getChildren().add(mapView);ArcGISMap map = new ArcGISMap(BasemapStyle.ARCGIS_TOPOGRAPHIC);// set the map on the map viewmapView.setMap(map);mapView.setViewpoint(new Viewpoint(34.02700, -118.80543, 72223.819286));// create a graphics overlay and add it to the map viewGraphicsOverlay graphicsOverlay = new GraphicsOverlay();mapView.getGraphicsOverlays().add(graphicsOverlay);// create a point geometry with a location and spatial referencePoint point = new Point(-118.80657463861, 34.0005930608889, SpatialReferences.getWgs84());// create an opaque orange point symbol with a opaque blue outline symbolSimpleMarkerSymbol simpleMarkerSymbol =new SimpleMarkerSymbol(SimpleMarkerSymbol.Style.CIRCLE, Color.ORANGE, 10);SimpleLineSymbol blueOutlineSymbol =new SimpleLineSymbol(SimpleLineSymbol.Style.SOLID, Color.BLUE, 2);simpleMarkerSymbol.setOutline(blueOutlineSymbol);3 collapsed lines}}
-
-
Create a
Graphicwith thepointandsimpleMarkerSymbol. Display theGraphicby adding it to thegraphicsOverlay’s graphics collection withGraphicsOverlay.getGraphics().Point graphics support a number of symbol types such as
SimpleMarkerSymbol,PictureMarkerSymbolandTextSymbol. Learn more about theSymbolclass in the API Reference documentation.App.java84 collapsed lines// Copyright 2020 Esri// Licensed under the Apache License, Version 2.0 (the "License");// you may not use this file except in compliance with the License.// You may obtain a copy of the License at//// http://www.apache.org/licenses/LICENSE-2.0//// Unless required by applicable law or agreed to in writing, software// distributed under the License is distributed on an "AS IS" BASIS,// WITHOUT WARRANTIES OR CONDITIONS OF ANY KIND, either express or implied.// See the License for the specific language governing permissions and// limitations under the License.package com.example.app;import com.esri.arcgisruntime.geometry.Point;import com.esri.arcgisruntime.geometry.PointCollection;import com.esri.arcgisruntime.geometry.Polygon;import com.esri.arcgisruntime.geometry.Polyline;import com.esri.arcgisruntime.geometry.SpatialReferences;import com.esri.arcgisruntime.mapping.view.Graphic;import com.esri.arcgisruntime.mapping.view.GraphicsOverlay;import com.esri.arcgisruntime.symbology.SimpleFillSymbol;import com.esri.arcgisruntime.symbology.SimpleLineSymbol;import com.esri.arcgisruntime.symbology.SimpleMarkerSymbol;import com.esri.arcgisruntime.ArcGISRuntimeEnvironment;import com.esri.arcgisruntime.mapping.ArcGISMap;import com.esri.arcgisruntime.mapping.BasemapStyle;import com.esri.arcgisruntime.mapping.Viewpoint;import com.esri.arcgisruntime.mapping.view.MapView;import javafx.application.Application;import javafx.scene.Scene;import javafx.scene.layout.StackPane;import javafx.scene.paint.Color;import javafx.stage.Stage;public class App extends Application {private MapView mapView;public static void main(String[] args) {Application.launch(args);}@Overridepublic void start(Stage stage) {// set the title and size of the stage and show itstage.setTitle("Add a point line and polygon tutorial");stage.setWidth(800);stage.setHeight(700);stage.show();// create a JavaFX scene with a stack pane as the root node// and add it to the sceneStackPane stackPane = new StackPane();Scene scene = new Scene(stackPane);stage.setScene(scene);ArcGISRuntimeEnvironment.setApiKey("YOUR_ACCESS_TOKEN");// create a map view to display the map and add it to the stack panemapView = new MapView();stackPane.getChildren().add(mapView);ArcGISMap map = new ArcGISMap(BasemapStyle.ARCGIS_TOPOGRAPHIC);// set the map on the map viewmapView.setMap(map);mapView.setViewpoint(new Viewpoint(34.02700, -118.80543, 72223.819286));// create a graphics overlay and add it to the map viewGraphicsOverlay graphicsOverlay = new GraphicsOverlay();mapView.getGraphicsOverlays().add(graphicsOverlay);// create a point geometry with a location and spatial referencePoint point = new Point(-118.80657463861, 34.0005930608889, SpatialReferences.getWgs84());// create an opaque orange point symbol with a opaque blue outline symbolSimpleMarkerSymbol simpleMarkerSymbol =new SimpleMarkerSymbol(SimpleMarkerSymbol.Style.CIRCLE, Color.ORANGE, 10);SimpleLineSymbol blueOutlineSymbol =new SimpleLineSymbol(SimpleLineSymbol.Style.SOLID, Color.BLUE, 2);simpleMarkerSymbol.setOutline(blueOutlineSymbol);// create a graphic with the point geometry and symbolGraphic pointGraphic = new Graphic(point, simpleMarkerSymbol);// add the point graphic to the graphics overlaygraphicsOverlay.getGraphics().add(pointGraphic);4 collapsed lines}} -
Run the app. Ensure to run the app as a Gradle task and not as an application in your IDE. In the Gradle tool window, under Tasks > application, double-click run.
You should see a point graphic in Point Dume State Beach.
Add a line graphic
A line graphic
Polylines have one or more distinct parts. Each part is a sequence of points. For a continuous line, you can use the Polyline constructor to create a polyline with just one part. To create a polyline with more than one part, use a PolylineBuilder.
-
Create a
PolylineandSimpleLineSymbol.-
To create the
Polyline, create a newPointCollection(com.esri.arcgisruntime.geometry.SpatialReference)with aSpatialReferenceand add newPointobjects to it. -
To create the
SimpleLineSymbol, provide the shape that makes up the symbolA symbol defines the properties used to display a geometry or text. , the interior color of the symbol, and the size of the area to place the symbol in.
Polyline graphics support a number of symbol types such as
SimpleLineSymbolandTextSymbol. Learn more aboutSymbolin the API Reference documentation.App.java89 collapsed lines// Copyright 2020 Esri// Licensed under the Apache License, Version 2.0 (the "License");// you may not use this file except in compliance with the License.// You may obtain a copy of the License at//// http://www.apache.org/licenses/LICENSE-2.0//// Unless required by applicable law or agreed to in writing, software// distributed under the License is distributed on an "AS IS" BASIS,// WITHOUT WARRANTIES OR CONDITIONS OF ANY KIND, either express or implied.// See the License for the specific language governing permissions and// limitations under the License.package com.example.app;import com.esri.arcgisruntime.geometry.Point;import com.esri.arcgisruntime.geometry.PointCollection;import com.esri.arcgisruntime.geometry.Polygon;import com.esri.arcgisruntime.geometry.Polyline;import com.esri.arcgisruntime.geometry.SpatialReferences;import com.esri.arcgisruntime.mapping.view.Graphic;import com.esri.arcgisruntime.mapping.view.GraphicsOverlay;import com.esri.arcgisruntime.symbology.SimpleFillSymbol;import com.esri.arcgisruntime.symbology.SimpleLineSymbol;import com.esri.arcgisruntime.symbology.SimpleMarkerSymbol;import com.esri.arcgisruntime.ArcGISRuntimeEnvironment;import com.esri.arcgisruntime.mapping.ArcGISMap;import com.esri.arcgisruntime.mapping.BasemapStyle;import com.esri.arcgisruntime.mapping.Viewpoint;import com.esri.arcgisruntime.mapping.view.MapView;import javafx.application.Application;import javafx.scene.Scene;import javafx.scene.layout.StackPane;import javafx.scene.paint.Color;import javafx.stage.Stage;public class App extends Application {private MapView mapView;public static void main(String[] args) {Application.launch(args);}@Overridepublic void start(Stage stage) {// set the title and size of the stage and show itstage.setTitle("Add a point line and polygon tutorial");stage.setWidth(800);stage.setHeight(700);stage.show();// create a JavaFX scene with a stack pane as the root node// and add it to the sceneStackPane stackPane = new StackPane();Scene scene = new Scene(stackPane);stage.setScene(scene);ArcGISRuntimeEnvironment.setApiKey("YOUR_ACCESS_TOKEN");// create a map view to display the map and add it to the stack panemapView = new MapView();stackPane.getChildren().add(mapView);ArcGISMap map = new ArcGISMap(BasemapStyle.ARCGIS_TOPOGRAPHIC);// set the map on the map viewmapView.setMap(map);mapView.setViewpoint(new Viewpoint(34.02700, -118.80543, 72223.819286));// create a graphics overlay and add it to the map viewGraphicsOverlay graphicsOverlay = new GraphicsOverlay();mapView.getGraphicsOverlays().add(graphicsOverlay);// create a point geometry with a location and spatial referencePoint point = new Point(-118.80657463861, 34.0005930608889, SpatialReferences.getWgs84());// create an opaque orange point symbol with a opaque blue outline symbolSimpleMarkerSymbol simpleMarkerSymbol =new SimpleMarkerSymbol(SimpleMarkerSymbol.Style.CIRCLE, Color.ORANGE, 10);SimpleLineSymbol blueOutlineSymbol =new SimpleLineSymbol(SimpleLineSymbol.Style.SOLID, Color.BLUE, 2);simpleMarkerSymbol.setOutline(blueOutlineSymbol);// create a graphic with the point geometry and symbolGraphic pointGraphic = new Graphic(point, simpleMarkerSymbol);// add the point graphic to the graphics overlaygraphicsOverlay.getGraphics().add(pointGraphic);// create a point collection with a spatial reference, and add three points to itPointCollection polylinePoints = new PointCollection(SpatialReferences.getWgs84());polylinePoints.add(new Point(-118.821527826096, 34.0139576938577));polylinePoints.add(new Point(-118.814893761649, 34.0080602407843));polylinePoints.add(new Point(-118.808878330345, 34.0016642996246));// create a polyline geometry from the point collectionPolyline polyline = new Polyline(polylinePoints);// create an opaque blue line symbol for the polylineSimpleLineSymbol polylineSymbol =new SimpleLineSymbol(SimpleLineSymbol.Style.SOLID, Color.BLUE, 3);3 collapsed lines}} -
-
Create a
Graphicwith thepolylineandpolylineSymbol. Display theGraphicby adding it to thegraphicsOverlay’s graphics collection withGraphicsOverlay.getGraphics().App.java100 collapsed lines// Copyright 2020 Esri// Licensed under the Apache License, Version 2.0 (the "License");// you may not use this file except in compliance with the License.// You may obtain a copy of the License at//// http://www.apache.org/licenses/LICENSE-2.0//// Unless required by applicable law or agreed to in writing, software// distributed under the License is distributed on an "AS IS" BASIS,// WITHOUT WARRANTIES OR CONDITIONS OF ANY KIND, either express or implied.// See the License for the specific language governing permissions and// limitations under the License.package com.example.app;import com.esri.arcgisruntime.geometry.Point;import com.esri.arcgisruntime.geometry.PointCollection;import com.esri.arcgisruntime.geometry.Polygon;import com.esri.arcgisruntime.geometry.Polyline;import com.esri.arcgisruntime.geometry.SpatialReferences;import com.esri.arcgisruntime.mapping.view.Graphic;import com.esri.arcgisruntime.mapping.view.GraphicsOverlay;import com.esri.arcgisruntime.symbology.SimpleFillSymbol;import com.esri.arcgisruntime.symbology.SimpleLineSymbol;import com.esri.arcgisruntime.symbology.SimpleMarkerSymbol;import com.esri.arcgisruntime.ArcGISRuntimeEnvironment;import com.esri.arcgisruntime.mapping.ArcGISMap;import com.esri.arcgisruntime.mapping.BasemapStyle;import com.esri.arcgisruntime.mapping.Viewpoint;import com.esri.arcgisruntime.mapping.view.MapView;import javafx.application.Application;import javafx.scene.Scene;import javafx.scene.layout.StackPane;import javafx.scene.paint.Color;import javafx.stage.Stage;public class App extends Application {private MapView mapView;public static void main(String[] args) {Application.launch(args);}@Overridepublic void start(Stage stage) {// set the title and size of the stage and show itstage.setTitle("Add a point line and polygon tutorial");stage.setWidth(800);stage.setHeight(700);stage.show();// create a JavaFX scene with a stack pane as the root node// and add it to the sceneStackPane stackPane = new StackPane();Scene scene = new Scene(stackPane);stage.setScene(scene);ArcGISRuntimeEnvironment.setApiKey("YOUR_ACCESS_TOKEN");// create a map view to display the map and add it to the stack panemapView = new MapView();stackPane.getChildren().add(mapView);ArcGISMap map = new ArcGISMap(BasemapStyle.ARCGIS_TOPOGRAPHIC);// set the map on the map viewmapView.setMap(map);mapView.setViewpoint(new Viewpoint(34.02700, -118.80543, 72223.819286));// create a graphics overlay and add it to the map viewGraphicsOverlay graphicsOverlay = new GraphicsOverlay();mapView.getGraphicsOverlays().add(graphicsOverlay);// create a point geometry with a location and spatial referencePoint point = new Point(-118.80657463861, 34.0005930608889, SpatialReferences.getWgs84());// create an opaque orange point symbol with a opaque blue outline symbolSimpleMarkerSymbol simpleMarkerSymbol =new SimpleMarkerSymbol(SimpleMarkerSymbol.Style.CIRCLE, Color.ORANGE, 10);SimpleLineSymbol blueOutlineSymbol =new SimpleLineSymbol(SimpleLineSymbol.Style.SOLID, Color.BLUE, 2);simpleMarkerSymbol.setOutline(blueOutlineSymbol);// create a graphic with the point geometry and symbolGraphic pointGraphic = new Graphic(point, simpleMarkerSymbol);// add the point graphic to the graphics overlaygraphicsOverlay.getGraphics().add(pointGraphic);// create a point collection with a spatial reference, and add three points to itPointCollection polylinePoints = new PointCollection(SpatialReferences.getWgs84());polylinePoints.add(new Point(-118.821527826096, 34.0139576938577));polylinePoints.add(new Point(-118.814893761649, 34.0080602407843));polylinePoints.add(new Point(-118.808878330345, 34.0016642996246));// create a polyline geometry from the point collectionPolyline polyline = new Polyline(polylinePoints);// create an opaque blue line symbol for the polylineSimpleLineSymbol polylineSymbol =new SimpleLineSymbol(SimpleLineSymbol.Style.SOLID, Color.BLUE, 3);// create a polyline graphic with the polyline geometry and symbolGraphic polylineGraphic = new Graphic(polyline, polylineSymbol);// add the polyline graphic to the graphics overlaygraphicsOverlay.getGraphics().add(polylineGraphic);4 collapsed lines}} -
Run the app. Ensure to run the app as a Gradle task and not as an application in your IDE. In the Gradle tool window, under Tasks > application, double-click run.
You should see a point and a line graphic along Westward Beach.
Add a polygon graphic
A polygon graphic
Polygons have one or more distinct parts. Each part is a sequence of points describing a closed boundary. For a single area with no holes, you can use the Polygon constructor to create a polygon with just one part. To create a polygon with more than one part, use a PolygonBuilder.
-
Create a
PolygonandSimpleFillSymbol.-
To create the
Polygon, create a newPointCollection(com.esri.arcgisruntime.geometry.SpatialReference)with aSpatialReferenceand add newPointobjects to it. -
To create the
SimpleFillSymbol, provide the shape that makes up the symbolA symbol defines the properties used to display a geometry or text. , the interior color of the symbol, and the size of the area to place the symbol in.
Polygon graphics support a number of symbol types such as
SimpleFillSymbol,PictureFillSymbol,SimpleMarkerSymbol, andTextSymbol. Learn more aboutSymbolin the API Reference documentation.App.java107 collapsed lines// Copyright 2020 Esri// Licensed under the Apache License, Version 2.0 (the "License");// you may not use this file except in compliance with the License.// You may obtain a copy of the License at//// http://www.apache.org/licenses/LICENSE-2.0//// Unless required by applicable law or agreed to in writing, software// distributed under the License is distributed on an "AS IS" BASIS,// WITHOUT WARRANTIES OR CONDITIONS OF ANY KIND, either express or implied.// See the License for the specific language governing permissions and// limitations under the License.package com.example.app;import com.esri.arcgisruntime.geometry.Point;import com.esri.arcgisruntime.geometry.PointCollection;import com.esri.arcgisruntime.geometry.Polygon;import com.esri.arcgisruntime.geometry.Polyline;import com.esri.arcgisruntime.geometry.SpatialReferences;import com.esri.arcgisruntime.mapping.view.Graphic;import com.esri.arcgisruntime.mapping.view.GraphicsOverlay;import com.esri.arcgisruntime.symbology.SimpleFillSymbol;import com.esri.arcgisruntime.symbology.SimpleLineSymbol;import com.esri.arcgisruntime.symbology.SimpleMarkerSymbol;import com.esri.arcgisruntime.ArcGISRuntimeEnvironment;import com.esri.arcgisruntime.mapping.ArcGISMap;import com.esri.arcgisruntime.mapping.BasemapStyle;import com.esri.arcgisruntime.mapping.Viewpoint;import com.esri.arcgisruntime.mapping.view.MapView;import javafx.application.Application;import javafx.scene.Scene;import javafx.scene.layout.StackPane;import javafx.scene.paint.Color;import javafx.stage.Stage;public class App extends Application {private MapView mapView;public static void main(String[] args) {Application.launch(args);}@Overridepublic void start(Stage stage) {// set the title and size of the stage and show itstage.setTitle("Add a point line and polygon tutorial");stage.setWidth(800);stage.setHeight(700);stage.show();// create a JavaFX scene with a stack pane as the root node// and add it to the sceneStackPane stackPane = new StackPane();Scene scene = new Scene(stackPane);stage.setScene(scene);ArcGISRuntimeEnvironment.setApiKey("YOUR_ACCESS_TOKEN");// create a map view to display the map and add it to the stack panemapView = new MapView();stackPane.getChildren().add(mapView);ArcGISMap map = new ArcGISMap(BasemapStyle.ARCGIS_TOPOGRAPHIC);// set the map on the map viewmapView.setMap(map);mapView.setViewpoint(new Viewpoint(34.02700, -118.80543, 72223.819286));// create a graphics overlay and add it to the map viewGraphicsOverlay graphicsOverlay = new GraphicsOverlay();mapView.getGraphicsOverlays().add(graphicsOverlay);// create a point geometry with a location and spatial referencePoint point = new Point(-118.80657463861, 34.0005930608889, SpatialReferences.getWgs84());// create an opaque orange point symbol with a opaque blue outline symbolSimpleMarkerSymbol simpleMarkerSymbol =new SimpleMarkerSymbol(SimpleMarkerSymbol.Style.CIRCLE, Color.ORANGE, 10);SimpleLineSymbol blueOutlineSymbol =new SimpleLineSymbol(SimpleLineSymbol.Style.SOLID, Color.BLUE, 2);simpleMarkerSymbol.setOutline(blueOutlineSymbol);// create a graphic with the point geometry and symbolGraphic pointGraphic = new Graphic(point, simpleMarkerSymbol);// add the point graphic to the graphics overlaygraphicsOverlay.getGraphics().add(pointGraphic);// create a point collection with a spatial reference, and add three points to itPointCollection polylinePoints = new PointCollection(SpatialReferences.getWgs84());polylinePoints.add(new Point(-118.821527826096, 34.0139576938577));polylinePoints.add(new Point(-118.814893761649, 34.0080602407843));polylinePoints.add(new Point(-118.808878330345, 34.0016642996246));// create a polyline geometry from the point collectionPolyline polyline = new Polyline(polylinePoints);// create an opaque blue line symbol for the polylineSimpleLineSymbol polylineSymbol =new SimpleLineSymbol(SimpleLineSymbol.Style.SOLID, Color.BLUE, 3);// create a polyline graphic with the polyline geometry and symbolGraphic polylineGraphic = new Graphic(polyline, polylineSymbol);// add the polyline graphic to the graphics overlaygraphicsOverlay.getGraphics().add(polylineGraphic);// create a point collection with a spatial reference, and add five points to itPointCollection polygonPoints = new PointCollection(SpatialReferences.getWgs84());polygonPoints.add(new Point(-118.818984489994, 34.0137559967283));polygonPoints.add(new Point(-118.806796597377, 34.0215816298725));polygonPoints.add(new Point(-118.791432890735, 34.0163883241613));polygonPoints.add(new Point(-118.795966865355, 34.0085648646355));polygonPoints.add(new Point(-118.808558110679, 34.0035027131376));// create a polygon geometry from the point collectionPolygon polygon = new Polygon(polygonPoints);// create an orange-red fill symbol with 20% transparency and the opaque blue simple line symbolSimpleFillSymbol polygonFillSymbol =new SimpleFillSymbol(SimpleFillSymbol.Style.SOLID, Color.web("#FF4500", .8), blueOutlineSymbol);3 collapsed lines}} -
-
Create a
Graphicwith thepolygongeometry andpolygonSymbol. Display theGraphicby adding it to thegraphicsOverlay’s graphics collection withGraphicsOverlay.getGraphics().App.java120 collapsed lines// Copyright 2020 Esri// Licensed under the Apache License, Version 2.0 (the "License");// you may not use this file except in compliance with the License.// You may obtain a copy of the License at//// http://www.apache.org/licenses/LICENSE-2.0//// Unless required by applicable law or agreed to in writing, software// distributed under the License is distributed on an "AS IS" BASIS,// WITHOUT WARRANTIES OR CONDITIONS OF ANY KIND, either express or implied.// See the License for the specific language governing permissions and// limitations under the License.package com.example.app;import com.esri.arcgisruntime.geometry.Point;import com.esri.arcgisruntime.geometry.PointCollection;import com.esri.arcgisruntime.geometry.Polygon;import com.esri.arcgisruntime.geometry.Polyline;import com.esri.arcgisruntime.geometry.SpatialReferences;import com.esri.arcgisruntime.mapping.view.Graphic;import com.esri.arcgisruntime.mapping.view.GraphicsOverlay;import com.esri.arcgisruntime.symbology.SimpleFillSymbol;import com.esri.arcgisruntime.symbology.SimpleLineSymbol;import com.esri.arcgisruntime.symbology.SimpleMarkerSymbol;import com.esri.arcgisruntime.ArcGISRuntimeEnvironment;import com.esri.arcgisruntime.mapping.ArcGISMap;import com.esri.arcgisruntime.mapping.BasemapStyle;import com.esri.arcgisruntime.mapping.Viewpoint;import com.esri.arcgisruntime.mapping.view.MapView;import javafx.application.Application;import javafx.scene.Scene;import javafx.scene.layout.StackPane;import javafx.scene.paint.Color;import javafx.stage.Stage;public class App extends Application {private MapView mapView;public static void main(String[] args) {Application.launch(args);}@Overridepublic void start(Stage stage) {// set the title and size of the stage and show itstage.setTitle("Add a point line and polygon tutorial");stage.setWidth(800);stage.setHeight(700);stage.show();// create a JavaFX scene with a stack pane as the root node// and add it to the sceneStackPane stackPane = new StackPane();Scene scene = new Scene(stackPane);stage.setScene(scene);ArcGISRuntimeEnvironment.setApiKey("YOUR_ACCESS_TOKEN");// create a map view to display the map and add it to the stack panemapView = new MapView();stackPane.getChildren().add(mapView);ArcGISMap map = new ArcGISMap(BasemapStyle.ARCGIS_TOPOGRAPHIC);// set the map on the map viewmapView.setMap(map);mapView.setViewpoint(new Viewpoint(34.02700, -118.80543, 72223.819286));// create a graphics overlay and add it to the map viewGraphicsOverlay graphicsOverlay = new GraphicsOverlay();mapView.getGraphicsOverlays().add(graphicsOverlay);// create a point geometry with a location and spatial referencePoint point = new Point(-118.80657463861, 34.0005930608889, SpatialReferences.getWgs84());// create an opaque orange point symbol with a opaque blue outline symbolSimpleMarkerSymbol simpleMarkerSymbol =new SimpleMarkerSymbol(SimpleMarkerSymbol.Style.CIRCLE, Color.ORANGE, 10);SimpleLineSymbol blueOutlineSymbol =new SimpleLineSymbol(SimpleLineSymbol.Style.SOLID, Color.BLUE, 2);simpleMarkerSymbol.setOutline(blueOutlineSymbol);// create a graphic with the point geometry and symbolGraphic pointGraphic = new Graphic(point, simpleMarkerSymbol);// add the point graphic to the graphics overlaygraphicsOverlay.getGraphics().add(pointGraphic);// create a point collection with a spatial reference, and add three points to itPointCollection polylinePoints = new PointCollection(SpatialReferences.getWgs84());polylinePoints.add(new Point(-118.821527826096, 34.0139576938577));polylinePoints.add(new Point(-118.814893761649, 34.0080602407843));polylinePoints.add(new Point(-118.808878330345, 34.0016642996246));// create a polyline geometry from the point collectionPolyline polyline = new Polyline(polylinePoints);// create an opaque blue line symbol for the polylineSimpleLineSymbol polylineSymbol =new SimpleLineSymbol(SimpleLineSymbol.Style.SOLID, Color.BLUE, 3);// create a polyline graphic with the polyline geometry and symbolGraphic polylineGraphic = new Graphic(polyline, polylineSymbol);// add the polyline graphic to the graphics overlaygraphicsOverlay.getGraphics().add(polylineGraphic);// create a point collection with a spatial reference, and add five points to itPointCollection polygonPoints = new PointCollection(SpatialReferences.getWgs84());polygonPoints.add(new Point(-118.818984489994, 34.0137559967283));polygonPoints.add(new Point(-118.806796597377, 34.0215816298725));polygonPoints.add(new Point(-118.791432890735, 34.0163883241613));polygonPoints.add(new Point(-118.795966865355, 34.0085648646355));polygonPoints.add(new Point(-118.808558110679, 34.0035027131376));// create a polygon geometry from the point collectionPolygon polygon = new Polygon(polygonPoints);// create an orange-red fill symbol with 20% transparency and the opaque blue simple line symbolSimpleFillSymbol polygonFillSymbol =new SimpleFillSymbol(SimpleFillSymbol.Style.SOLID, Color.web("#FF4500", .8), blueOutlineSymbol);// create a polygon graphic from the polygon geometry and symbolGraphic polygonGraphic = new Graphic(polygon, polygonFillSymbol);// add the polygon graphic to the graphics overlaygraphicsOverlay.getGraphics().add(polygonGraphic);14 collapsed lines}/*** Stops and releases all resources used in application.*/@Overridepublic void stop() {if (mapView != null) {mapView.dispose();}}} -
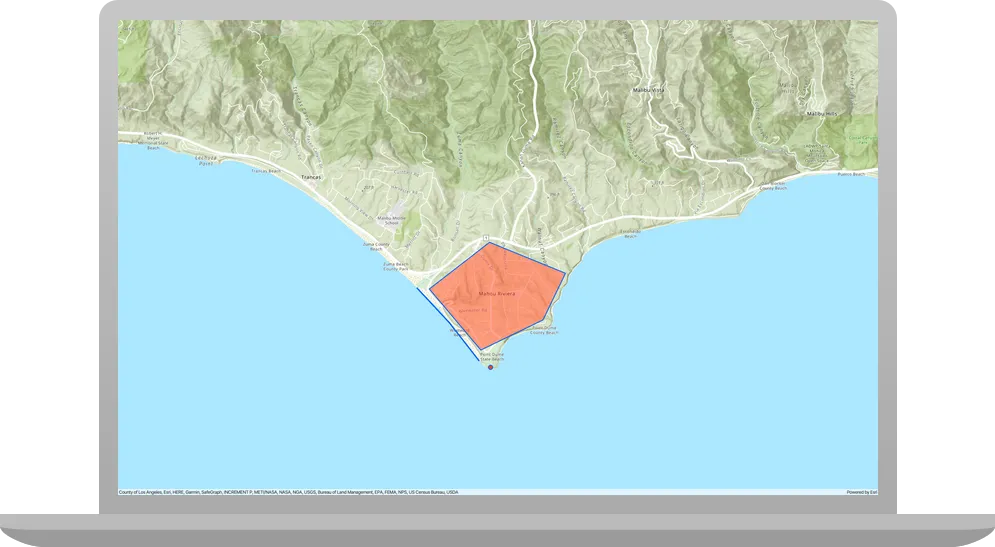
Run the app. Ensure to run the app as a Gradle task and not as an application in your IDE. In the Gradle tool window, under Tasks > application, double-click run.
You should see a point, line, and polygon graphic around Mahou Riviera in the Santa Monica Mountains.
What’s next?
Learn how to use additional API features, ArcGIS location services, and ArcGIS tools in these tutorials: