Analyze visibility in a scene view

Visibility analysis means determining which areas or specific features are visible from a hypothetical observer (with location, heading, field of view, and so on). This can help answer questions such as: Which apartments have a view of the beach? Which areas of the forest are visible from a car driving through it? Does anything block the view between my office window and my parking spot?

For evaluating visibility in a scene view, this API provides Viewshed and LineOfSight classes. Viewshed analysis highlights areas in the scene that are visible for a given observer, while line of sight shows which segments are visible along a line drawn between an observer and a target location. In either type of analysis, the observer may be moving or stationary. For visibility analysis, elevation surfaces, scene layers (buildings, for example), and 3D graphics (such as models) are considered obstructions to visibility. Billboarded (flat) graphics, such as text and simple graphics are not considered in the analysis. Visibility analysis is reactive, meaning that as data are added to (or removed from) the scene, visibility is reevaluated and updated dynamically in the display.

Scene analyses versus geoprocessing

This API includes Analysis and AnalysisOverlay classes to provide fast and dynamic (but strictly visual) analysis results in a scene view. The Analysis classes (including the visibility analysis classes described in this topic) allow you to define analyses to be performed using data in the current scene, then render results that are updated dynamically as layers are added or removed, features are updated, camera position changes, and so on. Analysis results are displayed using an analysis overlay. For more information about working with analysis overlays, see Manage analysis with analysis overlays.

Scene analyses produce results that are strictly visual, rendered dynamically and quickly by the GPU. As analyses are evaluated, results are rendered in the scene view for display only. This is ideal for use cases that require interactive and visual evaluation of results that change frequently. However, no features (such as graphics) or output geometry are produced, so use cases such as persisting result shapes or performing hit tests with other features are not supported.

Scene analysis uses the data currently available in the scene view to perform analysis (evaluate visibility, for example) and then quickly render the result. Because the data in the scene view changes according to the level of detail (distance of the camera to the surface, in other words), the analysis results may change as you interact with the scene view (for example, zoom in or out, change camera tilt, and so on). Resolution of surface elevation data varies according to level of detail, and for visibility analysis will affect the result, as shown in the following image.

An animation showing how when the position of the obsever changes, the viewshed changes as well.

Geoprocessing provides another way to perform analysis using a suite of specialized GIS analysis tools running on a service. The results returned from geoprocessing vary by task, but may include a map image, output features, raster images, data files, and so on. Geoprocessing usually gives you the ability to access the resulting features (or geometry) from the task, allowing you to save your results or use them for further analysis (find all the points inside the visible area, for example). Geoprocessing generally requires several inputs from the client, and takes some time to execute and return results from the server.

As a general guide, scene analysis allows you to interactively explore data visually, but lacks accuracy and does not provide tangible results. Geoprocessing provides better accuracy, gives you more control over the analysis, and can provide result features or geometry, but is not well suited for quickly and interactively exploring a variety of scenarios.

Here are samples that illustrate viewshed analysis using both techniques:

Viewshed analysis

Viewsheds are a type of visibility analysis that show the visible and obstructed areas within a directed field of view. Viewshed analysis shows you the areas of the scene that are visible from a given observer, determined by the terrain (represented by an elevation surface), buildings, and other 3D features (represented by scene layers, graphics, and so on), and the properties of the observer.

The 3D shape inside which visibility is evaluated is called the frustum. The frustum is defined by the observer's location, horizontal and vertical angles of vision, heading, pitch, and so on. You can think of the frustum as the full volume being evaluated within the observer's field of vision.

A diagram of a frustrum and the settings that define it

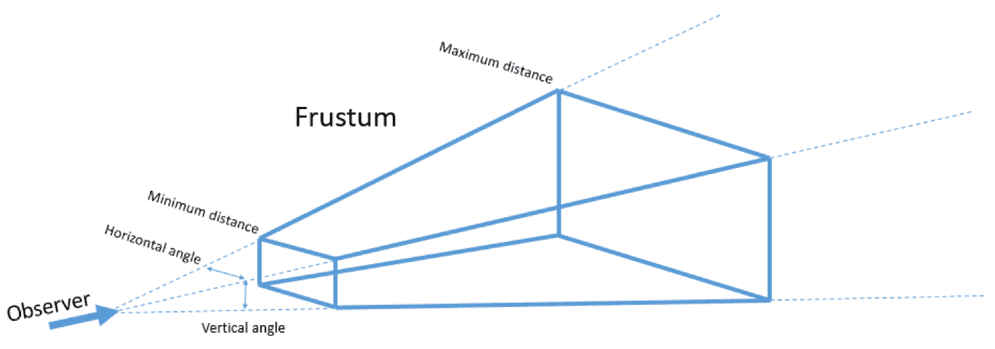
The following properties define the frustum:

  • Heading - a value in degrees (azimuth) that defines the direction of the observer's line of vision. This is the direction of the center of the frustum. The value is normalized to between 0 - 360.
  • Minimum distance — the distance (meters) from the observer at which viewshed analysis begins.
  • Maximum distance — the distance (meters) from the observer beyond which the viewshed is not evaluated.
  • Horizontal angle — an angle that defines the observer's horizontal field of vision. The angle is split evenly on the right and left sides of the heading. This value must be greater than zero to produce a valid frustum, and no greater than the maximum of 360 degrees.
  • Vertical angle — an angle that defines the observer's vertical field of vision. The angle is split evenly on the top and bottom sides of the heading. This value must be greater than zero to produce a valid frustum, and no greater than the maximum of 360 degrees.
  • Pitch — the angle of the observer's tilt relative to the surface. Pitch does not affect the shape of the frustum, but tilts it relative to the surface. Pitch values must be between 0 (looking straight down toward the center of the earth) and 180 (looking straight up).

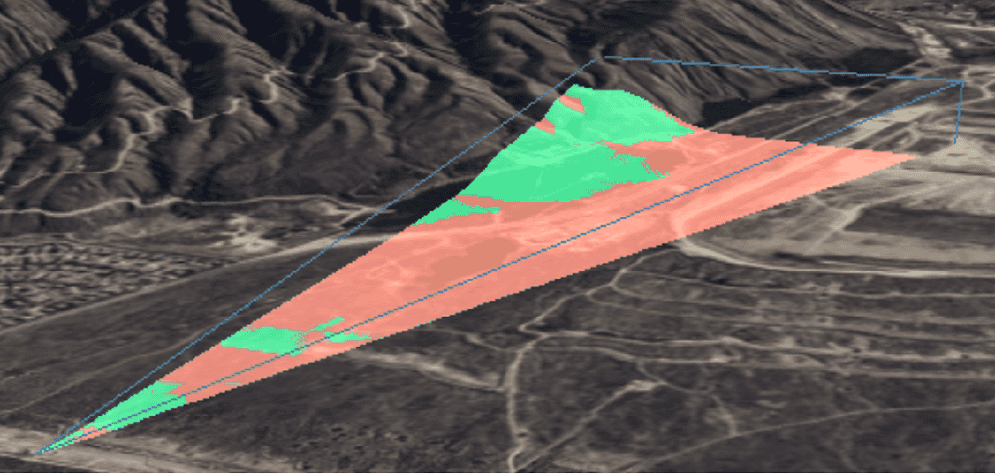
The frustum can be displayed as part of the viewshed analysis result, which may be helpful for troubleshooting or verifying the observer properties. A property of the analysis allows you to toggle the visibility of the frustum on or off. The default frustum outline symbol is a fully opaque blue line, but you can specify a custom color if you like. The frustum color you provide will be applied to all viewshed analyses in the scene view.

Viewshed results are displayed as two visual classes in the scene view: one representing visible areas, and one representing areas of obstructed visibility. By default, these are rendered green and red respectively, but you can specify your own colors. Areas that are not symbolized for visibility are outside of the frustum and therefore not evaluated. In the image below, the green areas are visible and the red areas are obstructed. Everything else is outside of the frustum.

A scene view showing the viewshed result for a portion of the city

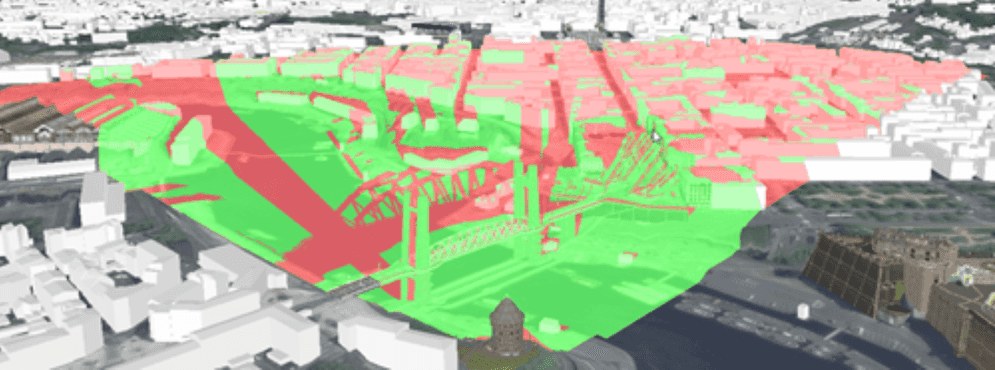
As with the frustum color, the colors you provide for visible and obstructed areas will be applied to all viewshed analyses in your scene view. These colors cannot be set individually on each analysis, in other words. If adding several viewshed analyses to your scene view, transparency in your visibility colors will help visualize overlapping areas by making them appear darker.

The observer for viewshed analysis can be represented by a point (x, y, and z coordinate values) or by a GeoElement with point geometry.

Location viewshed

Use the LocationViewshed to define the observer using a point location. You also need to provide heading, pitch, and roll, the vertical and horizontal angles of vision, and minimum/maximum distance of the viewshed analysis to define the frustum. You can dynamically update the observer for the viewshed using a camera object that encapsulates these properties of an observer.

To add LocationViewshed analysis to your scene view:

  1. Create a new location viewshed. In the constructor, pass values that define the observer (frustum): location, heading, pitch, horizontal and vertical angles, and the minimum and maximum distance. Optionally, you could create a camera to represent the observer, and pass that to the constructor along with minimum and maximum distance.

    Use dark colors for code blocksCopy
    1
    2
    3
    4
    5
    6
    7
    8
    9
    10
    11
    12
    13
    14
    15
    16
    17
    18
    19
    20
    21
    22
    23
    24
    25
    26
    27
    28
    29
    30
    31
    32
    33
    34
    35
    36
    37
    38
    39
    40
    41
    42
    43
    44
    45
    46
    47
    48
    49
    50
    51
    52
    53
    54
    55
    56
    57
    58
    59
    60
    61
    62
    63
    64
    65
    66
    67
    68
    69
    70
    71
    72
    73
    74
    75
    76
    77
    78
    79
    80
    81
    82
    83
    84
    85
    86
    87
    88
    89
    90
    91
    92
    93
    94
    95
    96
    97
    98
    99
    100
    101
    102
    103
    104
    105
    106
    107
    108
    109
    110
    111
    112
    113
    114
    115
    116
    117
    118
    119
    120
    121
    122
    123
    124
    125
    126
    127
    128
    129
    130
    131
    132
    133
    134
    135
    136
    137
    138
    139
    140
    141
    142
    143
    144
    145
    146
    147
    148
    149
    150
    151
    152
    153
    154
    155
    156
    157
    158
    159
    160
    161
    162
    163
    164
    165
    166
    167
    168
    169
    170
    171
    172
    173
    174
    175
    176
    177
    178
    179
    180
    181
    182
    183
    184
    185
    186
    187
    188
    189
    190
    191
    192
    193
    194
    195
    196
    197
    198
    199
    200
    201
    202
    203
    204
    205
    206
    207
    208
    209
    210
    211
    212
    213
    214
    215
    216
    217
    218
    219
    220
    221
    222
    223
    224
    225
    226
    227
    228
    229
    230
    231
    232
    233
    234
    235
    236
    237
    238
    239
    // Create a point for the observer location.
    Point observerPoint = new Point(-117.1979, 34.1409, 500.0, SpatialReferences.getWgs84());
    
    // Define the heading, pitch, and roll.
    double headingAzmuth = 270.0;
    double pitchAngle = 75.0;
    double rollAngle = 0.0;
    
    // Define horizontal/vertical field of vision and minimum/maximum distance
    // for visibility (meters).
    double horizontalViewAngle = 82.5;
    double verticalViewAngle = 80.0;
    double minViewDistanceMeters = 0.0;
    double maxViewDistanceMeters = 2000.0;
    
    // Create a location viewshed analysis with values that define the frustum.
    LocationViewshed viewFromLocation =
            new LocationViewshed(
                    observerPoint, headingAzmuth, pitchAngle, horizontalViewAngle,
                    verticalViewAngle, minViewDistanceMeters, maxViewDistanceMeters
            );
    
  2. Optional: Assign custom colors for analysis results: visible areas, obstructed areas, and frustum. To show the frustum in the results, set the frustum outline visibility to true.

    Use dark colors for code blocksCopy
    1
    2
    3
    4
    5
    6
    7
    8
    9
    10
    11
    12
    13
    14
    15
    16
    17
    18
    19
    20
    21
    22
    23
    24
    25
    26
    27
    28
    29
    30
    31
    32
    33
    34
    35
    36
    37
    38
    39
    40
    41
    42
    43
    44
    45
    46
    47
    48
    49
    50
    51
    52
    53
    54
    55
    56
    57
    58
    59
    60
    61
    62
    63
    64
    65
    66
    67
    68
    69
    70
    71
    72
    73
    74
    75
    76
    77
    78
    79
    80
    81
    82
    83
    84
    85
    86
    87
    88
    89
    90
    91
    92
    93
    94
    95
    96
    97
    98
    99
    100
    101
    102
    103
    104
    105
    106
    107
    108
    109
    110
    111
    112
    113
    114
    115
    116
    117
    118
    119
    120
    121
    122
    123
    124
    125
    126
    127
    128
    129
    130
    131
    132
    133
    134
    135
    136
    137
    138
    139
    140
    141
    142
    143
    144
    145
    146
    147
    148
    149
    150
    151
    152
    153
    154
    155
    156
    157
    158
    159
    160
    161
    162
    163
    164
    165
    166
    167
    168
    169
    170
    171
    172
    173
    174
    175
    176
    177
    178
    179
    180
    181
    182
    183
    184
    185
    186
    187
    188
    189
    190
    191
    192
    193
    194
    195
    196
    197
    198
    199
    200
    201
    202
    203
    204
    205
    206
    207
    208
    209
    210
    211
    212
    213
    214
    215
    216
    217
    218
    219
    220
    221
    222
    223
    224
    225
    226
    227
    228
    229
    230
    231
    232
    233
    234
    235
    236
    237
    238
    239
    // Define new colors for the frustum outline and for visible/obstructed areas
    // in the viewshed result.
    Color visibleColor = Color.GREEN;
    Color obstructedColor = Color.RED;
    Color frustumColor = Color.STEELBLUE;
    
    // These properties apply to all viewshed analyses in the scene view.
    Viewshed.setVisibleColor(visibleColor);
    Viewshed.setObstructedColor(obstructedColor);
    Viewshed.setFrustumOutlineColor(frustumColor);
    
    // Show the frustum outline for this analysis.
    viewFromLocation.setFrustumOutlineVisible(true);
    
  3. Add the analysis to an AnalysisOverlay to display the results, as described in Manage analysis with analysis overlays.

    Use dark colors for code blocksCopy
    1
    2
    3
    4
    5
    6
    7
    8
    9
    10
    11
    12
    13
    14
    15
    16
    17
    18
    19
    20
    21
    22
    23
    24
    25
    26
    27
    28
    29
    30
    31
    32
    33
    34
    35
    36
    37
    38
    39
    40
    41
    42
    43
    44
    45
    46
    47
    48
    49
    50
    51
    52
    53
    54
    55
    56
    57
    58
    59
    60
    61
    62
    63
    64
    65
    66
    67
    68
    69
    70
    71
    72
    73
    74
    75
    76
    77
    78
    79
    80
    81
    82
    83
    84
    85
    86
    87
    88
    89
    90
    91
    92
    93
    94
    95
    96
    97
    98
    99
    100
    101
    102
    103
    104
    105
    106
    107
    108
    109
    110
    111
    112
    113
    114
    115
    116
    117
    118
    119
    120
    121
    122
    123
    124
    125
    126
    127
    128
    129
    130
    131
    132
    133
    134
    135
    136
    137
    138
    139
    140
    141
    142
    143
    144
    145
    146
    147
    148
    149
    150
    151
    152
    153
    154
    155
    156
    157
    158
    159
    160
    161
    162
    163
    164
    165
    166
    167
    168
    169
    170
    171
    172
    173
    174
    175
    176
    177
    178
    179
    180
    181
    182
    183
    184
    185
    186
    187
    188
    189
    190
    191
    192
    193
    194
    195
    196
    197
    198
    199
    200
    201
    202
    203
    204
    205
    206
    207
    208
    209
    210
    211
    212
    213
    214
    215
    216
    217
    218
    219
    220
    221
    222
    223
    224
    225
    226
    227
    228
    229
    230
    231
    232
    233
    234
    235
    236
    237
    238
    239
    // Add the viewshed to an analysis overlay.
    AnalysisOverlay analysisOverlay = new AnalysisOverlay();
    analysisOverlay.getAnalyses().add(viewFromLocation);
    
    // Add the overlay to the scene view.
    sceneView.getAnalysisOverlays().add(analysisOverlay);
    
  4. You may update the analysis after it's associated with your scene view by changing the observer position or result colors. A convenience method allows you to update the observer using a camera.

    Use dark colors for code blocksCopy
    1
    2
    3
    4
    5
    6
    7
    8
    9
    10
    11
    12
    13
    14
    15
    16
    17
    18
    19
    20
    21
    22
    23
    24
    25
    26
    27
    28
    29
    30
    31
    32
    33
    34
    35
    36
    37
    38
    39
    40
    41
    42
    43
    44
    45
    46
    47
    48
    49
    50
    51
    52
    53
    54
    55
    56
    57
    58
    59
    60
    61
    62
    63
    64
    65
    66
    67
    68
    69
    70
    71
    72
    73
    74
    75
    76
    77
    78
    79
    80
    81
    82
    83
    84
    85
    86
    87
    88
    89
    90
    91
    92
    93
    94
    95
    96
    97
    98
    99
    100
    101
    102
    103
    104
    105
    106
    107
    108
    109
    110
    111
    112
    113
    114
    115
    116
    117
    118
    119
    120
    121
    122
    123
    124
    125
    126
    127
    128
    129
    130
    131
    132
    133
    134
    135
    136
    137
    138
    139
    140
    141
    142
    143
    144
    145
    146
    147
    148
    149
    150
    151
    152
    153
    154
    155
    156
    157
    158
    159
    160
    161
    162
    163
    164
    165
    166
    167
    168
    169
    170
    171
    172
    173
    174
    175
    176
    177
    178
    179
    180
    181
    182
    183
    184
    185
    186
    187
    188
    189
    190
    191
    192
    193
    194
    195
    196
    197
    198
    199
    200
    201
    202
    203
    204
    205
    206
    207
    208
    209
    210
    211
    212
    213
    214
    215
    216
    217
    218
    219
    220
    221
    222
    223
    224
    225
    226
    227
    228
    229
    230
    231
    232
    233
    234
    235
    236
    237
    238
    239
    // Update with camera.
    viewFromLocation.updateFromCamera(newObserverCamera);
    
A scene view showing a location viewshed and the frustrum.

GeoElement viewshed

You may want to see a viewshed for an observer whose location, heading, or pitch update frequently. For example, you may want to display a viewshed for the pilot of a search plane as it flies over the terrain. As an element representing the aircraft changes its position in the scene view, you'd like the viewshed result to update accordingly. This can be accomplished using GeoElementViewshed scene analysis, which takes a GeoElement (of point geometry type) to define the observer's position. Since the viewshed is based on the geoelement, any change in its position (location, heading, pitch, and so on) will update the viewshed result. You can also specify offset values for the observer relative to the element. This is useful for more accurately representing an observer position inside a moving craft, for example.

To add a GeoElementViewshed analysis to your scene view:

  1. Create a point geoelement to represent the observer in the viewshed. Add the element to the scene view.

  2. Create a new GeoElementViewshed. In the constructor, define the observer by passing in the geoelement, horizontal and vertical field of view, minimum and maximum distance, and heading and pitch offsets.

    Use dark colors for code blocksCopy
    1
    2
    3
    4
    5
    6
    7
    8
    9
    10
    11
    12
    13
    14
    15
    16
    17
    18
    19
    20
    21
    22
    23
    24
    25
    26
    27
    28
    29
    30
    31
    32
    33
    34
    35
    36
    37
    38
    39
    40
    41
    42
    43
    44
    45
    46
    47
    48
    49
    50
    51
    52
    53
    54
    55
    56
    57
    58
    59
    60
    61
    62
    63
    64
    65
    66
    67
    68
    69
    70
    71
    72
    73
    74
    75
    76
    77
    78
    79
    80
    81
    82
    83
    84
    85
    86
    87
    88
    89
    90
    91
    92
    93
    94
    95
    96
    97
    98
    99
    100
    101
    102
    103
    104
    105
    106
    107
    108
    109
    110
    111
    112
    113
    114
    115
    116
    117
    118
    119
    120
    121
    122
    123
    124
    125
    126
    127
    128
    129
    130
    131
    132
    133
    134
    135
    136
    137
    138
    139
    140
    141
    142
    143
    144
    145
    146
    147
    148
    149
    150
    151
    152
    153
    154
    155
    156
    157
    158
    159
    160
    161
    162
    163
    164
    165
    166
    167
    168
    169
    170
    171
    172
    173
    174
    175
    176
    177
    178
    179
    180
    181
    182
    183
    184
    185
    186
    187
    188
    189
    190
    191
    192
    193
    194
    195
    196
    197
    198
    199
    200
    201
    202
    203
    204
    205
    206
    207
    208
    209
    210
    211
    212
    213
    214
    215
    216
    217
    218
    219
    220
    221
    222
    223
    224
    225
    226
    227
    228
    229
    230
    231
    232
    233
    234
    235
    236
    237
    238
    239
    // Define horizontal/vertical field of vision and minimum/maximum distance
    // for visibility (meters).
    double horizontalViewAngle = 40.0;
    double verticalViewAngle = 60.0;
    double minViewDistanceMeters = 0.0;
    double maxViewDistanceMeters = 5000.0;
    
    // Define pitch and heading offsets (if any).
    double headingOffset = 0.0;
    double pitchOffset = 0.0;
    
    // Create the viewshed analysis using a geo element, graphic in this example,
    // to define the observer.
    GeoElementViewshed viewFromPlane =
            new GeoElementViewshed(planeGraphic,
                            horizontalViewAngle, verticalViewAngle,
                            minViewDistanceMeters, maxViewDistanceMeters,
                            headingOffset, pitchOffset);
    
  3. Optional: Define offset values to define the X, Y, and Z location of the observer relative to the element. These offsets are defined in meters using a coordinate system relative to the center of the object, where X is to the right or left, Y is forward or back, and Z is up and down. To place an observer in the driver's seat of a car, for example, you might place her 60 centimeters from the left of the car center, 70 centimeters forward from center, and 40 centimeters above the center. These offset values would be (-0.6, 0.7, 0.4).

    Use dark colors for code blocksCopy
    1
    2
    3
    4
    5
    6
    7
    8
    9
    10
    11
    12
    13
    14
    15
    16
    17
    18
    19
    20
    21
    22
    23
    24
    25
    26
    27
    28
    29
    30
    31
    32
    33
    34
    35
    36
    37
    38
    39
    40
    41
    42
    43
    44
    45
    46
    47
    48
    49
    50
    51
    52
    53
    54
    55
    56
    57
    58
    59
    60
    61
    62
    63
    64
    65
    66
    67
    68
    69
    70
    71
    72
    73
    74
    75
    76
    77
    78
    79
    80
    81
    82
    83
    84
    85
    86
    87
    88
    89
    90
    91
    92
    93
    94
    95
    96
    97
    98
    99
    100
    101
    102
    103
    104
    105
    106
    107
    108
    109
    110
    111
    112
    113
    114
    115
    116
    117
    118
    119
    120
    121
    122
    123
    124
    125
    126
    127
    128
    129
    130
    131
    132
    133
    134
    135
    136
    137
    138
    139
    140
    141
    142
    143
    144
    145
    146
    147
    148
    149
    150
    151
    152
    153
    154
    155
    156
    157
    158
    159
    160
    161
    162
    163
    164
    165
    166
    167
    168
    169
    170
    171
    172
    173
    174
    175
    176
    177
    178
    179
    180
    181
    182
    183
    184
    185
    186
    187
    188
    189
    190
    191
    192
    193
    194
    195
    196
    197
    198
    199
    200
    201
    202
    203
    204
    205
    206
    207
    208
    209
    210
    211
    212
    213
    214
    215
    216
    217
    218
    219
    220
    221
    222
    223
    224
    225
    226
    227
    228
    229
    230
    231
    232
    233
    234
    235
    236
    237
    238
    239
    // Apply x, y, z offsets (meters) to accurately place the observer.
    viewFromPlane.setOffsetX(2.5);
    viewFromPlane.setOffsetY(0.0);
    viewFromPlane.setOffsetZ(1.0);
    
  4. Optional: Provide custom colors for analysis results: visible areas, obstructed areas, and frustum. To show the frustum in the results, set the frustum outline visibility to true.

    Use dark colors for code blocksCopy
    1
    2
    3
    4
    5
    6
    7
    8
    9
    10
    11
    12
    13
    14
    15
    16
    17
    18
    19
    20
    21
    22
    23
    24
    25
    26
    27
    28
    29
    30
    31
    32
    33
    34
    35
    36
    37
    38
    39
    40
    41
    42
    43
    44
    45
    46
    47
    48
    49
    50
    51
    52
    53
    54
    55
    56
    57
    58
    59
    60
    61
    62
    63
    64
    65
    66
    67
    68
    69
    70
    71
    72
    73
    74
    75
    76
    77
    78
    79
    80
    81
    82
    83
    84
    85
    86
    87
    88
    89
    90
    91
    92
    93
    94
    95
    96
    97
    98
    99
    100
    101
    102
    103
    104
    105
    106
    107
    108
    109
    110
    111
    112
    113
    114
    115
    116
    117
    118
    119
    120
    121
    122
    123
    124
    125
    126
    127
    128
    129
    130
    131
    132
    133
    134
    135
    136
    137
    138
    139
    140
    141
    142
    143
    144
    145
    146
    147
    148
    149
    150
    151
    152
    153
    154
    155
    156
    157
    158
    159
    160
    161
    162
    163
    164
    165
    166
    167
    168
    169
    170
    171
    172
    173
    174
    175
    176
    177
    178
    179
    180
    181
    182
    183
    184
    185
    186
    187
    188
    189
    190
    191
    192
    193
    194
    195
    196
    197
    198
    199
    200
    201
    202
    203
    204
    205
    206
    207
    208
    209
    210
    211
    212
    213
    214
    215
    216
    217
    218
    219
    220
    221
    222
    223
    224
    225
    226
    227
    228
    229
    230
    231
    232
    233
    234
    235
    236
    237
    238
    239
    // Define new colors for the frustum outline and for visible/obstructed areas
    // in the viewshed result.
    Color visibleColor = Color.GREEN;
    Color obstructedColor = Color.RED;
    Color frustumColor = Color.STEELBLUE;
    
    // These are static properties on the Viewshed base class that apply to all
    // viewshed analyses in the scene view.
    Viewshed.setVisibleColor(visibleColor);
    Viewshed.setObstructedColor(obstructedColor);
    Viewshed.setFrustumOutlineColor(frustumColor);
    
    // Show the frustum outline for this analysis.
    viewFromPlane.setFrustumOutlineVisible(true);
    
  5. Add the analysis to an analysis overlay to display the results, as described in Manage analysis with analysis overlays.

    Use dark colors for code blocksCopy
    1
    2
    3
    4
    5
    6
    7
    8
    9
    10
    11
    12
    13
    14
    15
    16
    17
    18
    19
    20
    21
    22
    23
    24
    25
    26
    27
    28
    29
    30
    31
    32
    33
    34
    35
    36
    37
    38
    39
    40
    41
    42
    43
    44
    45
    46
    47
    48
    49
    50
    51
    52
    53
    54
    55
    56
    57
    58
    59
    60
    61
    62
    63
    64
    65
    66
    67
    68
    69
    70
    71
    72
    73
    74
    75
    76
    77
    78
    79
    80
    81
    82
    83
    84
    85
    86
    87
    88
    89
    90
    91
    92
    93
    94
    95
    96
    97
    98
    99
    100
    101
    102
    103
    104
    105
    106
    107
    108
    109
    110
    111
    112
    113
    114
    115
    116
    117
    118
    119
    120
    121
    122
    123
    124
    125
    126
    127
    128
    129
    130
    131
    132
    133
    134
    135
    136
    137
    138
    139
    140
    141
    142
    143
    144
    145
    146
    147
    148
    149
    150
    151
    152
    153
    154
    155
    156
    157
    158
    159
    160
    161
    162
    163
    164
    165
    166
    167
    168
    169
    170
    171
    172
    173
    174
    175
    176
    177
    178
    179
    180
    181
    182
    183
    184
    185
    186
    187
    188
    189
    190
    191
    192
    193
    194
    195
    196
    197
    198
    199
    200
    201
    202
    203
    204
    205
    206
    207
    208
    209
    210
    211
    212
    213
    214
    215
    216
    217
    218
    219
    220
    221
    222
    223
    224
    225
    226
    227
    228
    229
    230
    231
    232
    233
    234
    235
    236
    237
    238
    239
    // Add the viewshed to an analysis overlay.
    analysisOverlay.getAnalyses().add(viewFromPlane);
    

As the position of the geoelement changes, the viewshed results will update accordingly.

An animation showing how when the position of the obsever changes, the viewshed changes as well.

Line-of-sight analysis

Line of sight analysis shows visibility along a line drawn between an observer and a target location. The result shows which segments of the line can be seen by the observer and which segments are blocked by an obstruction. In the image below, the cyan segment of the line is the portion of the sight line that is not blocked, while the magenta segments are obstructed by the terrain (and therefore not visible).

A scene view with line-of-sight analysis between two locations

In addition to visible and obstructed line segments, you may see portions of the line that have an unknown visibility state. These are lines drawn in gray to indicate that visibility cannot be reliably evaluated with the currently available data. For example, visibility may become unknown if the camera position is changed such that the target and/or observer for the line of sight are no longer displayed. In that situation, data outside the visible display may have been unloaded from the scene. The unloaded data may have contained obstructions to the line of sight that are no longer present. Obstructed lines, however, may still render as obstructed when the target or observer moves off the display, since the obstruction is assumed to still exist even if the data have unloaded.

A line of sight analysis represents a single line from observer to target. To make sight lines from multiple vantage points, you must create multiple analysis instances. A group of related line of site analyses (for the same observer, for example) can be managed in a single analysis overlay (see Manage analysis with analysis overlays).

Location line of sight

Use the LocationLineOfSight to define the observer and target using point locations. You can then handle target visibility changes to receive a notification each time the target becomes visible or obstructed from the observer.

To add a LocationLineOfSight analysis to your scene view:

  1. Create map points to define the location of the observer and target in the line of sight analysis.

    Use dark colors for code blocksCopy
    1
    2
    3
    4
    5
    6
    7
    8
    9
    10
    11
    12
    13
    14
    15
    16
    17
    18
    19
    20
    21
    22
    23
    24
    25
    26
    27
    28
    29
    30
    31
    32
    33
    34
    35
    36
    37
    38
    39
    40
    41
    42
    43
    44
    45
    46
    47
    48
    49
    50
    51
    52
    53
    54
    55
    56
    57
    58
    59
    60
    61
    62
    63
    64
    65
    66
    67
    68
    69
    70
    71
    72
    73
    74
    75
    76
    77
    78
    79
    80
    81
    82
    83
    84
    85
    86
    87
    88
    89
    90
    91
    92
    93
    94
    95
    96
    97
    98
    99
    100
    101
    102
    103
    104
    105
    106
    107
    108
    109
    110
    111
    112
    113
    114
    115
    116
    117
    118
    119
    120
    121
    122
    123
    124
    125
    126
    127
    128
    129
    130
    131
    132
    133
    134
    135
    136
    137
    138
    139
    140
    141
    142
    143
    144
    145
    146
    147
    148
    149
    150
    151
    152
    153
    154
    155
    156
    157
    158
    159
    160
    161
    162
    163
    164
    165
    166
    167
    168
    169
    170
    171
    172
    173
    174
    175
    176
    177
    178
    179
    180
    181
    182
    183
    184
    185
    186
    187
    188
    189
    190
    191
    192
    193
    194
    195
    196
    197
    198
    199
    200
    201
    202
    203
    204
    205
    206
    207
    208
    209
    210
    211
    212
    213
    214
    215
    216
    217
    218
    219
    220
    221
    222
    223
    224
    225
    226
    227
    228
    229
    230
    231
    232
    233
    234
    235
    236
    237
    238
    239
    // Location of the observer.
    Point observerPoint = new Point(-117.33, 33.56, 500.0, SpatialReferences.getWgs84());
    
    // Location of the target.
    Point targetPoint = new Point(-117.53, 33.76, 750.0, SpatialReferences.getWgs84());
    
  2. Create a new LocationLineOfSight. In the constructor, provide the points that define the observer and target.

    Use dark colors for code blocksCopy
    1
    2
    3
    4
    5
    6
    7
    8
    9
    10
    11
    12
    13
    14
    15
    16
    17
    18
    19
    20
    21
    22
    23
    24
    25
    26
    27
    28
    29
    30
    31
    32
    33
    34
    35
    36
    37
    38
    39
    40
    41
    42
    43
    44
    45
    46
    47
    48
    49
    50
    51
    52
    53
    54
    55
    56
    57
    58
    59
    60
    61
    62
    63
    64
    65
    66
    67
    68
    69
    70
    71
    72
    73
    74
    75
    76
    77
    78
    79
    80
    81
    82
    83
    84
    85
    86
    87
    88
    89
    90
    91
    92
    93
    94
    95
    96
    97
    98
    99
    100
    101
    102
    103
    104
    105
    106
    107
    108
    109
    110
    111
    112
    113
    114
    115
    116
    117
    118
    119
    120
    121
    122
    123
    124
    125
    126
    127
    128
    129
    130
    131
    132
    133
    134
    135
    136
    137
    138
    139
    140
    141
    142
    143
    144
    145
    146
    147
    148
    149
    150
    151
    152
    153
    154
    155
    156
    157
    158
    159
    160
    161
    162
    163
    164
    165
    166
    167
    168
    169
    170
    171
    172
    173
    174
    175
    176
    177
    178
    179
    180
    181
    182
    183
    184
    185
    186
    187
    188
    189
    190
    191
    192
    193
    194
    195
    196
    197
    198
    199
    200
    201
    202
    203
    204
    205
    206
    207
    208
    209
    210
    211
    212
    213
    214
    215
    216
    217
    218
    219
    220
    221
    222
    223
    224
    225
    226
    227
    228
    229
    230
    231
    232
    233
    234
    235
    236
    237
    238
    239
    LocationLineOfSight locationLineOfSight = new LocationLineOfSight(observerPoint, targetPoint);
    
  3. Optional: Assign custom colors for the visible and obstructed line segments in the analysis results. The colors you assign will be used for all line of sight analyses in the scene view.

    Use dark colors for code blocksCopy
    1
    2
    3
    4
    5
    6
    7
    8
    9
    10
    11
    12
    13
    14
    15
    16
    17
    18
    19
    20
    21
    22
    23
    24
    25
    26
    27
    28
    29
    30
    31
    32
    33
    34
    35
    36
    37
    38
    39
    40
    41
    42
    43
    44
    45
    46
    47
    48
    49
    50
    51
    52
    53
    54
    55
    56
    57
    58
    59
    60
    61
    62
    63
    64
    65
    66
    67
    68
    69
    70
    71
    72
    73
    74
    75
    76
    77
    78
    79
    80
    81
    82
    83
    84
    85
    86
    87
    88
    89
    90
    91
    92
    93
    94
    95
    96
    97
    98
    99
    100
    101
    102
    103
    104
    105
    106
    107
    108
    109
    110
    111
    112
    113
    114
    115
    116
    117
    118
    119
    120
    121
    122
    123
    124
    125
    126
    127
    128
    129
    130
    131
    132
    133
    134
    135
    136
    137
    138
    139
    140
    141
    142
    143
    144
    145
    146
    147
    148
    149
    150
    151
    152
    153
    154
    155
    156
    157
    158
    159
    160
    161
    162
    163
    164
    165
    166
    167
    168
    169
    170
    171
    172
    173
    174
    175
    176
    177
    178
    179
    180
    181
    182
    183
    184
    185
    186
    187
    188
    189
    190
    191
    192
    193
    194
    195
    196
    197
    198
    199
    200
    201
    202
    203
    204
    205
    206
    207
    208
    209
    210
    211
    212
    213
    214
    215
    216
    217
    218
    219
    220
    221
    222
    223
    224
    225
    226
    227
    228
    229
    230
    231
    232
    233
    234
    235
    236
    237
    238
    239
    Color visibleColor = Color.GREEN;
    Color obstructedColor = Color.RED;
    
    LineOfSight.setVisibleColor(visibleColor);
    LineOfSight.setObstructedColor(obstructedColor);
    
  4. Add the analysis to an analysis overlay to display the results, as described in Manage analysis with analysis overlays.

    Use dark colors for code blocksCopy
    1
    2
    3
    4
    5
    6
    7
    8
    9
    10
    11
    12
    13
    14
    15
    16
    17
    18
    19
    20
    21
    22
    23
    24
    25
    26
    27
    28
    29
    30
    31
    32
    33
    34
    35
    36
    37
    38
    39
    40
    41
    42
    43
    44
    45
    46
    47
    48
    49
    50
    51
    52
    53
    54
    55
    56
    57
    58
    59
    60
    61
    62
    63
    64
    65
    66
    67
    68
    69
    70
    71
    72
    73
    74
    75
    76
    77
    78
    79
    80
    81
    82
    83
    84
    85
    86
    87
    88
    89
    90
    91
    92
    93
    94
    95
    96
    97
    98
    99
    100
    101
    102
    103
    104
    105
    106
    107
    108
    109
    110
    111
    112
    113
    114
    115
    116
    117
    118
    119
    120
    121
    122
    123
    124
    125
    126
    127
    128
    129
    130
    131
    132
    133
    134
    135
    136
    137
    138
    139
    140
    141
    142
    143
    144
    145
    146
    147
    148
    149
    150
    151
    152
    153
    154
    155
    156
    157
    158
    159
    160
    161
    162
    163
    164
    165
    166
    167
    168
    169
    170
    171
    172
    173
    174
    175
    176
    177
    178
    179
    180
    181
    182
    183
    184
    185
    186
    187
    188
    189
    190
    191
    192
    193
    194
    195
    196
    197
    198
    199
    200
    201
    202
    203
    204
    205
    206
    207
    208
    209
    210
    211
    212
    213
    214
    215
    216
    217
    218
    219
    220
    221
    222
    223
    224
    225
    226
    227
    228
    229
    230
    231
    232
    233
    234
    235
    236
    237
    238
    239
    // Add the line of sight to the analysis overlay.
    analysisOverlay.getAnalyses().add(locationLineOfSight);
    
  5. Optional: Handle an event to know when target visibility changes.

    Use dark colors for code blocksCopy
    1
    2
    3
    4
    5
    6
    7
    8
    9
    10
    11
    12
    13
    14
    15
    16
    17
    18
    19
    20
    21
    22
    23
    24
    25
    26
    27
    28
    29
    30
    31
    32
    33
    34
    35
    36
    37
    38
    39
    40
    41
    42
    43
    44
    45
    46
    47
    48
    49
    50
    51
    52
    53
    54
    55
    56
    57
    58
    59
    60
    61
    62
    63
    64
    65
    66
    67
    68
    69
    70
    71
    72
    73
    74
    75
    76
    77
    78
    79
    80
    81
    82
    83
    84
    85
    86
    87
    88
    89
    90
    91
    92
    93
    94
    95
    96
    97
    98
    99
    100
    101
    102
    103
    104
    105
    106
    107
    108
    109
    110
    111
    112
    113
    114
    115
    116
    117
    118
    119
    120
    121
    122
    123
    124
    125
    126
    127
    128
    129
    130
    131
    132
    133
    134
    135
    136
    137
    138
    139
    140
    141
    142
    143
    144
    145
    146
    147
    148
    149
    150
    151
    152
    153
    154
    155
    156
    157
    158
    159
    160
    161
    162
    163
    164
    165
    166
    167
    168
    169
    170
    171
    172
    173
    174
    175
    176
    177
    178
    179
    180
    181
    182
    183
    184
    185
    186
    187
    188
    189
    190
    191
    192
    193
    194
    195
    196
    197
    198
    199
    200
    201
    202
    203
    204
    205
    206
    207
    208
    209
    210
    211
    212
    213
    214
    215
    216
    217
    218
    219
    220
    221
    222
    223
    224
    225
    226
    227
    228
    229
    230
    231
    232
    233
    234
    235
    236
    237
    238
    239
    locationLineOfSight.addTargetVisibilityChangedListener(e -> {
        // Code here to update UI.
    });
    

Location line of sight is generally used for evaluating visibility between a fixed observer and target, although those locations could be updated. Other factors in the scene view could also change the target visibility, such as adding or removing 3D features or updating surface data.

GeoElement line of sight

A more dynamic approach for evaluating line of sight is to use a GeoElementLineOfSight analysis. This analyzes visibility between point geoelements that represent the observer and target. As the position of these elements is updated (from a GPS feed, for example), the line of sight result will also be updated. As with the LocationLineOfSight analysis, you can handle target visibility changes to receive a notification each time the target becomes visible or obstructed. In the following image, for example, the target geoelement is selected when it becomes visible and unselected when it is obstructed.

An animation showing how a target geoelement is automatically selected when visible and deselected when not visible.

To add a GeoElementLineOfSight analysis to your scene view:

  1. Create a new GeoElementLineOfSight. In the constructor, define the observer and target by passing in geoelements (with point geometry) that define their location.

    Use dark colors for code blocksCopy
    1
    2
    3
    4
    5
    6
    7
    8
    9
    10
    11
    12
    13
    14
    15
    16
    17
    18
    19
    20
    21
    22
    23
    24
    25
    26
    27
    28
    29
    30
    31
    32
    33
    34
    35
    36
    37
    38
    39
    40
    41
    42
    43
    44
    45
    46
    47
    48
    49
    50
    51
    52
    53
    54
    55
    56
    57
    58
    59
    60
    61
    62
    63
    64
    65
    66
    67
    68
    69
    70
    71
    72
    73
    74
    75
    76
    77
    78
    79
    80
    81
    82
    83
    84
    85
    86
    87
    88
    89
    90
    91
    92
    93
    94
    95
    96
    97
    98
    99
    100
    101
    102
    103
    104
    105
    106
    107
    108
    109
    110
    111
    112
    113
    114
    115
    116
    117
    118
    119
    120
    121
    122
    123
    124
    125
    126
    127
    128
    129
    130
    131
    132
    133
    134
    135
    136
    137
    138
    139
    140
    141
    142
    143
    144
    145
    146
    147
    148
    149
    150
    151
    152
    153
    154
    155
    156
    157
    158
    159
    160
    161
    162
    163
    164
    165
    166
    167
    168
    169
    170
    171
    172
    173
    174
    175
    176
    177
    178
    179
    180
    181
    182
    183
    184
    185
    186
    187
    188
    189
    190
    191
    192
    193
    194
    195
    196
    197
    198
    199
    200
    201
    202
    203
    204
    205
    206
    207
    208
    209
    210
    211
    212
    213
    214
    215
    216
    217
    218
    219
    220
    221
    222
    223
    224
    225
    226
    227
    228
    229
    230
    231
    232
    233
    234
    235
    236
    237
    238
    239
    // Create a line of sight and define the observer and target with point geo elements.
    GeoElementLineOfSight goodGuyBadGuyLOS =
            new GeoElementLineOfSight(friendlyGraphic, hostileGraphic);
    
  2. Optional: Define offset values to apply to the observer and/or target locations (x, y, z). These offsets are defined in meters using a coordinate system relative to the center of the object, where X is to the right or left, Y is forward or back, and Z is up and down. To place an observer in the driver's seat of a car, for example, you might place her 60 centimeters from the left of the car center, 70 centimeters forward from center, and 40 centimeters above the center. These offset values would be (-0.6, 0.7, 0.4).

    Use dark colors for code blocksCopy
    1
    2
    3
    4
    5
    6
    7
    8
    9
    10
    11
    12
    13
    14
    15
    16
    17
    18
    19
    20
    21
    22
    23
    24
    25
    26
    27
    28
    29
    30
    31
    32
    33
    34
    35
    36
    37
    38
    39
    40
    41
    42
    43
    44
    45
    46
    47
    48
    49
    50
    51
    52
    53
    54
    55
    56
    57
    58
    59
    60
    61
    62
    63
    64
    65
    66
    67
    68
    69
    70
    71
    72
    73
    74
    75
    76
    77
    78
    79
    80
    81
    82
    83
    84
    85
    86
    87
    88
    89
    90
    91
    92
    93
    94
    95
    96
    97
    98
    99
    100
    101
    102
    103
    104
    105
    106
    107
    108
    109
    110
    111
    112
    113
    114
    115
    116
    117
    118
    119
    120
    121
    122
    123
    124
    125
    126
    127
    128
    129
    130
    131
    132
    133
    134
    135
    136
    137
    138
    139
    140
    141
    142
    143
    144
    145
    146
    147
    148
    149
    150
    151
    152
    153
    154
    155
    156
    157
    158
    159
    160
    161
    162
    163
    164
    165
    166
    167
    168
    169
    170
    171
    172
    173
    174
    175
    176
    177
    178
    179
    180
    181
    182
    183
    184
    185
    186
    187
    188
    189
    190
    191
    192
    193
    194
    195
    196
    197
    198
    199
    200
    201
    202
    203
    204
    205
    206
    207
    208
    209
    210
    211
    212
    213
    214
    215
    216
    217
    218
    219
    220
    221
    222
    223
    224
    225
    226
    227
    228
    229
    230
    231
    232
    233
    234
    235
    236
    237
    238
    239
    // Apply some offsets (values are meters).
    goodGuyBadGuyLOS.setObserverOffsetX(1.0);
    goodGuyBadGuyLOS.setObserverOffsetY(2.0);
    goodGuyBadGuyLOS.setTargetOffsetX(1.0);
    goodGuyBadGuyLOS.setTargetOffsetZ(4.5);
    
  3. Optional: Assign custom colors for visible and obstructed line segments in the analysis results. These are green and red by default.

    Use dark colors for code blocksCopy
    1
    2
    3
    4
    5
    6
    7
    8
    9
    10
    11
    12
    13
    14
    15
    16
    17
    18
    19
    20
    21
    22
    23
    24
    25
    26
    27
    28
    29
    30
    31
    32
    33
    34
    35
    36
    37
    38
    39
    40
    41
    42
    43
    44
    45
    46
    47
    48
    49
    50
    51
    52
    53
    54
    55
    56
    57
    58
    59
    60
    61
    62
    63
    64
    65
    66
    67
    68
    69
    70
    71
    72
    73
    74
    75
    76
    77
    78
    79
    80
    81
    82
    83
    84
    85
    86
    87
    88
    89
    90
    91
    92
    93
    94
    95
    96
    97
    98
    99
    100
    101
    102
    103
    104
    105
    106
    107
    108
    109
    110
    111
    112
    113
    114
    115
    116
    117
    118
    119
    120
    121
    122
    123
    124
    125
    126
    127
    128
    129
    130
    131
    132
    133
    134
    135
    136
    137
    138
    139
    140
    141
    142
    143
    144
    145
    146
    147
    148
    149
    150
    151
    152
    153
    154
    155
    156
    157
    158
    159
    160
    161
    162
    163
    164
    165
    166
    167
    168
    169
    170
    171
    172
    173
    174
    175
    176
    177
    178
    179
    180
    181
    182
    183
    184
    185
    186
    187
    188
    189
    190
    191
    192
    193
    194
    195
    196
    197
    198
    199
    200
    201
    202
    203
    204
    205
    206
    207
    208
    209
    210
    211
    212
    213
    214
    215
    216
    217
    218
    219
    220
    221
    222
    223
    224
    225
    226
    227
    228
    229
    230
    231
    232
    233
    234
    235
    236
    237
    238
    239
    // Define colors.
    Color visibleColor = Color.GREEN;
    Color obstructedColor = Color.RED;
    
    // These are static properties that apply to all lines of sight in the scene view.
    LineOfSight.setVisibleColor(visibleColor);
    LineOfSight.setObstructedColor(obstructedColor);
    LineOfSight.setLineWidth(3);
    
  4. Add the analysis to an analysis overlay to display the results, as described in Manage analysis with analysis overlays.

    Use dark colors for code blocksCopy
    1
    2
    3
    4
    5
    6
    7
    8
    9
    10
    11
    12
    13
    14
    15
    16
    17
    18
    19
    20
    21
    22
    23
    24
    25
    26
    27
    28
    29
    30
    31
    32
    33
    34
    35
    36
    37
    38
    39
    40
    41
    42
    43
    44
    45
    46
    47
    48
    49
    50
    51
    52
    53
    54
    55
    56
    57
    58
    59
    60
    61
    62
    63
    64
    65
    66
    67
    68
    69
    70
    71
    72
    73
    74
    75
    76
    77
    78
    79
    80
    81
    82
    83
    84
    85
    86
    87
    88
    89
    90
    91
    92
    93
    94
    95
    96
    97
    98
    99
    100
    101
    102
    103
    104
    105
    106
    107
    108
    109
    110
    111
    112
    113
    114
    115
    116
    117
    118
    119
    120
    121
    122
    123
    124
    125
    126
    127
    128
    129
    130
    131
    132
    133
    134
    135
    136
    137
    138
    139
    140
    141
    142
    143
    144
    145
    146
    147
    148
    149
    150
    151
    152
    153
    154
    155
    156
    157
    158
    159
    160
    161
    162
    163
    164
    165
    166
    167
    168
    169
    170
    171
    172
    173
    174
    175
    176
    177
    178
    179
    180
    181
    182
    183
    184
    185
    186
    187
    188
    189
    190
    191
    192
    193
    194
    195
    196
    197
    198
    199
    200
    201
    202
    203
    204
    205
    206
    207
    208
    209
    210
    211
    212
    213
    214
    215
    216
    217
    218
    219
    220
    221
    222
    223
    224
    225
    226
    227
    228
    229
    230
    231
    232
    233
    234
    235
    236
    237
    238
    239
    // Add the line of sight to the analysis overlay.
    analysisOverlay.getAnalyses().add(goodGuyBadGuyLOS);
    
  5. Optional: Handle an event to know when target visibility changes.

    Use dark colors for code blocksCopy
    1
    2
    3
    4
    5
    6
    7
    8
    9
    10
    11
    12
    13
    14
    15
    16
    17
    18
    19
    20
    21
    22
    23
    24
    25
    26
    27
    28
    29
    30
    31
    32
    33
    34
    35
    36
    37
    38
    39
    40
    41
    42
    43
    44
    45
    46
    47
    48
    49
    50
    51
    52
    53
    54
    55
    56
    57
    58
    59
    60
    61
    62
    63
    64
    65
    66
    67
    68
    69
    70
    71
    72
    73
    74
    75
    76
    77
    78
    79
    80
    81
    82
    83
    84
    85
    86
    87
    88
    89
    90
    91
    92
    93
    94
    95
    96
    97
    98
    99
    100
    101
    102
    103
    104
    105
    106
    107
    108
    109
    110
    111
    112
    113
    114
    115
    116
    117
    118
    119
    120
    121
    122
    123
    124
    125
    126
    127
    128
    129
    130
    131
    132
    133
    134
    135
    136
    137
    138
    139
    140
    141
    142
    143
    144
    145
    146
    147
    148
    149
    150
    151
    152
    153
    154
    155
    156
    157
    158
    159
    160
    161
    162
    163
    164
    165
    166
    167
    168
    169
    170
    171
    172
    173
    174
    175
    176
    177
    178
    179
    180
    181
    182
    183
    184
    185
    186
    187
    188
    189
    190
    191
    192
    193
    194
    195
    196
    197
    198
    199
    200
    201
    202
    203
    204
    205
    206
    207
    208
    209
    210
    211
    212
    213
    214
    215
    216
    217
    218
    219
    220
    221
    222
    223
    224
    225
    226
    227
    228
    229
    230
    231
    232
    233
    234
    235
    236
    237
    238
    239
    goodGuyBadGuyLOS.addTargetVisibilityChangedListener(e -> {
        // Do something when target is visible.
    });
    
A scene view showing lines of sight for a moving geoelement

Your browser is no longer supported. Please upgrade your browser for the best experience. See our browser deprecation post for more details.