import CSVLayer from "@arcgis/core/layers/CSVLayer.js";const CSVLayer = await $arcgis.import("@arcgis/core/layers/CSVLayer.js");- Since
- ArcGIS Maps SDK for JavaScript 4.1
Overview
The CSVLayer is a point layer based on a CSV file (.csv, .txt). CSV is a plain-text file format used to represent tabular data, including geographic point features (latitude, longitude). Typically the latitude coordinate is the Y value, and the longitude coordinate is the X value. The X, Y coordinates must be stored in SpatialReference.WGS84 in csv feed.
CSVLayer fetches all of its data once and store them on the client-side when it loads. CSVLayer, however, will make server-side requests to fetch updated data if its refreshInterval is set or refresh() method is called. Refer to FeatureLayer's querying your data section to learn more about how to query your csv data, and the data visualization section to learn how to change the CSVLayer's visualization.
Creating a CSVLayer
CSVLayer is created by setting its url property to point to csv feed or to a blob url for in memory csv data. Specify names of your latitude and longitude fields by setting latitudeField and longitudeField properties if the csv data does not contain x, y coordinates in one of the predefined fields. Values of latitude and longitude fields must be stored in WGS84 in csv feed. Hence CSVLayer's spatialReference will default to WGS84. However, you can specify the layer's spatial reference to match the View.spatialReference of the view to improve the performance.
Reference a csv feed URL
To create a CSVLayer instance from a csv feed, you must set the url property to the url of the csv feed. If CSV feeds are not on the same domain as the application, a CORS enabled server or a proxy is required.
const CSVLayer = await $arcgis.import("@arcgis/core/layers/CSVLayer.js");// points to the states layer in a service storing U.S. census dataconst csvLayer = new CSVLayer({ url: "https://earthquake.usgs.gov/earthquakes/feed/v1.0/summary/2.5_week.csv", copyright: "USGS Earthquakes"});map.add(csvLayer); // adds the layer to the mapReference in memory csv data by a blob url
You can also create a CSVLayer from in memory csv data by passing a blob url to the url property of the layer. The following snippet shows how to create a new CSVLayer from a blob url.
// Pass data by a blob url to create a CSV layer.const csv = `name|year|latitude|Longitudeaspen|2020|40.418|20.553birch|2018|-118.123|35.888`;
const blob = new Blob([csv], {  type: "plain/text"});let url = URL.createObjectURL(blob);
const layer = new CSVLayer({  url: url});
Notes
Starting at version 4.28, date fields are stored in the UTC time zone instead of the local time zone of the device. This may cause some date values defined without a time zone offset to be inaccurate.
For example, at version 4.27 and earlier, if your CSV file has date values without the time zone offset such as below, these values would be interpreted in the local time zone of the device.
At 4.28, these values are interpreted in the UTC time zone. The following table shows how dates may be interpreted in 4.27 and 4.28.
| CSV file value | 4.27 and earlier value | 4.28 value |
|---|---|---|
01/01/2021 | Interpreted as 1/1/2022, 12:00 AM in the device's local time zone | 1/1/2022, 12:00 AM in UTC |
01/01/2021 08:00:00 | Interpreted as 1/1/2021 08:00:00 AM in the device's local time zone | 1/1/2021 08:00:00 AM in UTC |
2021/01/01 10:00:00 | Interpreted as 1/1/2021 10:00:00 AM in the device's local time zone | 1/1/2021 10:00:00 AM in UTC |
2021-01-01T00:00:00-08:00 | Interpreted as 1/1/2021, 08:00 AM in UTC time zone | 1/1/2021, 08:00 AM in UTC time zone |
2021-01-01T00:00:00.000Z | Interpreted as 1/1/2021, 08:00 AM in UTC time zone | 1/1/2021, 08:00 AM in UTC time zone |
2021-01-01T00:00Z | Interpreted as 1/1/2021, 08:00 AM in UTC time zone | 1/1/2021, 08:00 AM in UTC time zone |
To ensure the accuracy of date field values, use ISO8601 string date values with the time zone offset (e.g. 2021-01-01T00:00:00-08:00, 2021-01-01T00:00:00.000Z) in your CSV file.
Constructors
Constructor
Parameters
| Parameter | Type | Description | Required |
|---|---|---|---|
| properties | | |
Example
// Typical usagelet layer = new CSVLayer({ // URL to the CSV file url: "https://mydomain.com/files/POIs.csv"});Properties
| Property | Type | Class |
|---|---|---|
| | ||
blendMode inherited | ||
capabilities readonly | | |
| | ||
| | ||
dateFieldsTimeZone readonly | | |
declaredClass readonly inherited | ||
| | ||
"," | " " | ";" | "|" | "\t" | | |
| | ||
displayFilterEnabled inherited | ||
displayFilterInfo inherited | ||
effect inherited | ||
| | ||
featureEffect inherited | ||
featureReduction inherited | ||
Field[] | | |
fieldsIndex readonly | | |
| | ||
| | ||
geometryType readonly | "point" | |
id inherited | ||
isTable readonly | | |
LabelClass[] | null | undefined | | |
| | ||
| | ||
| | ||
listMode inherited | ||
loaded readonly inherited | ||
loadError readonly inherited | ||
loadStatus readonly inherited | "not-loaded" | "loading" | "failed" | "loaded" | |
loadWarnings readonly inherited | any[] | |
| | ||
maxScale inherited | ||
minScale inherited | ||
| | ||
opacity inherited | ||
orderBy inherited | OrderByInfo[] | null | undefined | |
| | ||
parent inherited | Map | Basemap | Ground | GroupLayer | CatalogDynamicGroupLayer | CatalogLayer | null | undefined | |
persistenceEnabled inherited | ||
| | ||
| | ||
PortalItem | null | undefined | | |
refreshInterval inherited | ||
| | ||
| | ||
| | ||
timeExtent inherited | TimeExtent | null | undefined | |
timeInfo inherited | ||
timeOffset inherited | ||
| | ||
trackInfo inherited | ||
type readonly | "csv" | |
uid readonly inherited | ||
| | ||
useViewTime inherited | ||
visibilityTimeExtent inherited | TimeExtent | null | undefined | |
visible inherited |
attributeTableTemplate
- Type
- AttributeTableTemplate | null | undefined
- Since
- ArcGIS Maps SDK for JavaScript 4.31
This property is used to configure the associated layer's FeatureTable. It is meant to configure how the columns display within the table in regard to visibility, column order, and sorting.
This property differs from the FeatureTable's tableTemplate property. The TableTemplate provides more fine-grained control over how the table is rendered within the application by offering more advanced configurations such as custom cell rendering, column formatting, and more. TableTemplate is useful for application-level development that remains within an application. Use the attributeTableTemplate property to access the table's settings across different applications. By using this property, the settings can be saved within a webmap or layer. Please refer to the AttributeTableTemplate and TableTemplate documentation for more information.
blendMode
- Type
- BlendMode
- Since
- ArcGIS Maps SDK for JavaScript 4.16
Blend modes are used to blend layers together to create an interesting effect in a layer, or even to produce what seems like a new layer. Unlike the method of using transparency which can result in a washed-out top layer, blend modes can create a variety of very vibrant and intriguing results by blending a layer with the layer(s) below it.
When blending layers, a top layer is a layer that has a blend mode applied. All layers underneath the top layer are background layers.
The default blending mode is normal where the top layer is simply displayed over the background layer. While this default behavior is perfectly acceptable,
the use of blend modes on layers open up a world of endless possibilities to generate creative maps.
The layers in a GroupLayer are blended together in isolation from the rest of the map.
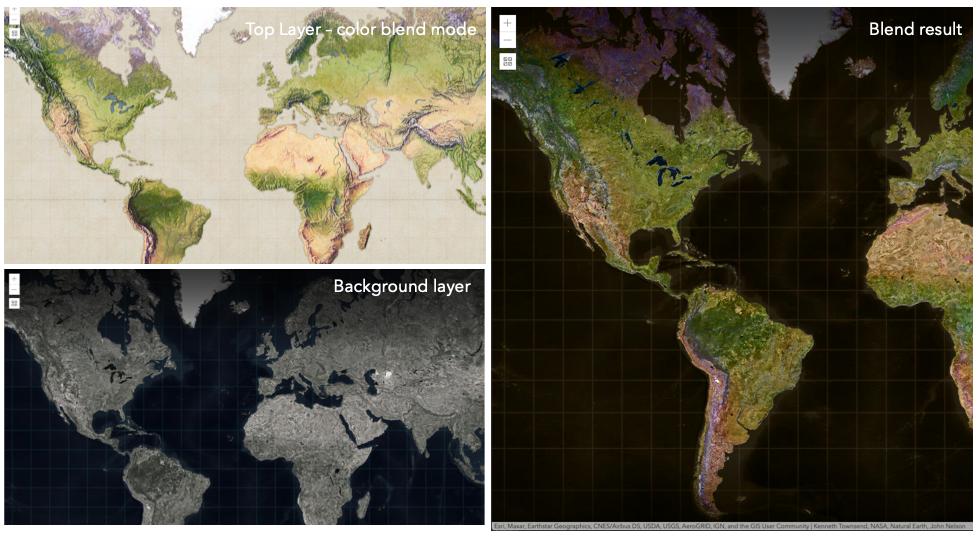
In the following screenshots, the vintage shaded relief
layer is displayed over a firefly world imagery layer. The color blend mode
is applied to the vintage shaded relief and the result looks like a new layer.
Known Limitations
- In 3D SceneViews, the blendMode is supported on BaseTileLayer, ImageryTileLayer, OpenStreetMapLayer, TileLayer, VectorTileLayer, WCSLayer, WebTileLayer, WMTSLayer and GroupLayer.
- When working with GroupLayers in a 3D SceneView, the blendMode is only applied to the sublayers that support it.
- The blendMode is not supported in the Legend.
- See print for known printing limitations.
The following factors will affect the blend result:
- Order of all layers
- Layer opacity
- Opacity of features in layers
- Visibility of layers
- By default, the very bottom layer in a map is drawn on a transparent background. You can change the MapView's background color.
Read More
| Blend mode | Description |
|---|---|
| normal | The top layer is displayed over the background layer. The data of the top layer block the data of background layer where they overlap. |
| average | Takes the mathematical average of top and background layers. Result of average blend mode is often similar to the effect of setting the layer's opacity to 50%. |
Lighten blend modes:
The following blend modes create lighter results than all layers. In lighten blend modes, pure black colors in the top layer become transparent allowing the background layer to show through. White in the top layer will stay unchanged. Any color that is lighter than pure black is going to lighten colors in the top layer to varying degrees all way to pure white.
Lighten blend modes can be useful when lightening dark colors of the top layer or removing black colors from the result.
The plus, lighten and screen modes can be used to brighten layers that have faded or dark colors on a dark background.
| Blend mode | Description |
|---|---|
| lighten | Compares top and background layers and retains the lighter color. Colors in the top layer become transparent if they are darker than the overlapping colors in the background layer allowing the background layer to show through completely. Can be thought of as the opposite of darken blend mode. |
| lighter | Colors in top and background layers are multiplied by their alphas (layer opacity and layer's data opacity. Then the resulting colors are added together. All overlapping midrange colors are lightened in the top layer. The opacity of layer and layer's data will affect the blend result. |
| plus | Colors in top and background layers are added together. All overlapping midrange colors are lightened in the top layer. This mode is also known as add or linear-dodge. |
| screen | Multiplies inverted colors in top and background layers then inverts the colors again. The resulting colors will be lighter than the original color with less contrast. Screen can produce many different levels of brightening depending on the luminosity values of the top layer. Can be thought of as the opposite of the multiply mode. |
| color-dodge | Divides colors in background layer by the inverted top layer. This lightens the background layer depending on the value of the top layer. The brighter the top layer, the more its color affects the background layer. Decreases the contrast between top and background layers resulting in saturated mid-tones and blown highlights. |
Darken blend modes:
The following blend modes create darker results than all layers. In darken blend modes, pure white in the top layer will become transparent allowing the background layer to show through. Black in the top layer will stay unchanged. Any color that is darker than pure white is going to darken a top layer to varying degrees all the way to pure black.
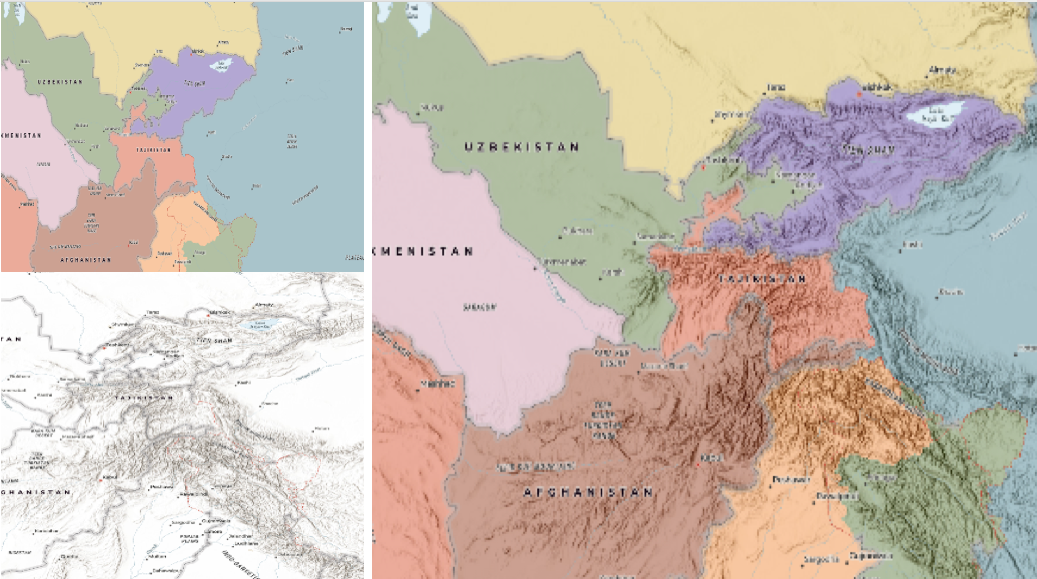
The multiply blend mode is often used to highlight shadows, show contrast, or accentuate an aspect of a map. For example, you can use multiply blend mode on a topographic map
displayed over hillshade when you want to have your elevation show through the topographic layer. See the intro to layer blending sample.
The multiply and darken modes can be used to have dark labels of the basemap to show through top layers. See the darken blending sample.
The color-burn mode works well with colorful top and background layers since it increases saturation in mid-tones. It increases the contrast by tinting pixels in overlapping areas in
top and bottom layers more towards the top layer color. Use this blend mode, when you want an effect with more contrast than multiply or darken.
The following screenshots show how the multiply blend mode used for creating a physical map of the world that shows both boundaries and elevation.
| Blend mode | Description |
|---|---|
| darken | Emphasizes the darkest parts of overlapping layers. Colors in the top layer become transparent if they are lighter than the overlapping colors in the background layer, allowing the background layer to show through completely. |
| multiply | Emphasizes the darkest parts of overlapping layers by multiplying colors of the top layer and the background layer. Midrange colors from top and background layers are mixed together more evenly. |
| color-burn | Intensifies the dark areas in all layers. It increases the contrast between top and background layers, by tinting colors in overlapping area towards the top color. To do this it inverts colors of the background layer, divides the result by colors of the top layer, then inverts the results. |
Contrast blend modes:
The following blend modes create contrast by both lightening the lighter areas and darkening the darker areas in the top layer by using lightening or darkening blend modes to create the blend.
The contrast blend modes will lighten the colors lighter than 50% gray ([128,128,128]), and darken the colors darker than 50% gray. 50% gray will be transparent in the top layer.
Each mode can create a variety of results depending on the colors of top and background layers being blended together.
The overlay blend mode makes its calculations based on the brightness of the colors in the background layer while all of the other contrast blend modes make their calculations based on the brightness of the top layer.
Some of these modes are designed to simulate the effect of shining a light through the top layer, effectively projecting upon the layers beneath it.
Contrast blend modes can be used to increase the contrast and saturation to have more vibrant colors and give a punch to your layers.
For example, you can duplicate a layer and set overlay blend mode on the top layer to increase the contrast and tones of your layer.
You can also add a polygon layer with a white fill symbol over a dark imagery layer and apply soft-light blend mode to increase the brightness in the imagery layer.
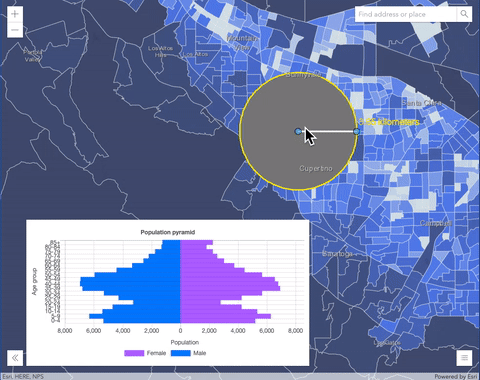
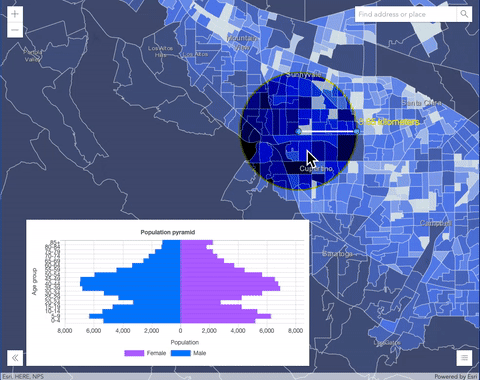
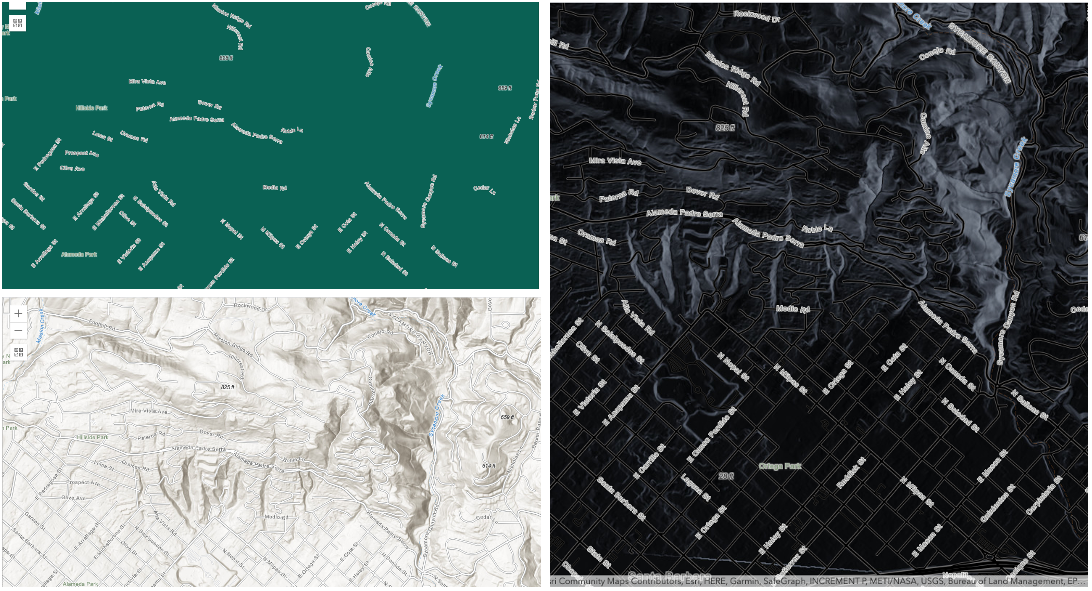
The following screenshots show an effect of the overlay blend mode on a GraphicsLayer. The left image shows when the buffer graphics layer has the normal blend mode.
As you can see, the gray color for the buffer polygon is blocking the intersecting census tracts. The right image shows when the overlay blend mode is applied to the buffer graphics layer.
The overlay blend mode darkens or lightens the gray buffer polygon depending on the colors of the background layer while the census tracts layer is shining through.
See this in action.
| Normal blend mode | Overlay blend mode |
|---|---|
 |  |
| Blend mode | Description |
|---|---|
| overlay | Uses a combination of multiply and screen modes to darken and lighten colors in the top layer with the background layer always shining through. The result is darker color values in the background layer intensify the top layer, while lighter colors in the background layer wash out overlapping areas in the top layer. |
| soft-light | Applies a half strength screen mode to lighter areas and half strength multiply mode to darken areas of the top layer. You can think of the soft-light as a softer version of the overlay mode. |
| hard-light | Multiplies or screens the colors, depending on colors of the top layer. The effect is similar to shining a harsh spotlight on the top layer. |
| vivid-light | Uses a combination of color-burn or color-dodge by increasing or decreasing the contrast, depending on colors in the top layer. |
Component blend modes:
The following blend modes use primary color components, which are hue, saturation and luminosity to blend top and background layers.
You can add a feature layer with a simple renderer over any layer and set hue, saturation, color or luminosity blend mode on this layer. With this technique, you create a brand new looking map.
The following screenshots show where the topo layer is blended with
world hillshade layer with luminosity blend mode.
The result is a drastically different looking map which preserves the brightness of the topo layer while adapting the hue and saturation of the hillshade layer.
| Blend mode | Description |
|---|---|
| hue | Creates an effect with the hue of the top layer and the luminosity and saturation of the background layer. |
| saturation | Creates an effect with the saturation of the top layer and the hue and luminosity of the background layer. 50% gray with no saturation in the background layer will not produce any change. |
| luminosity | Creates effect with the luminosity of the top layer and the hue and saturation of the background layer. Can be thought of as the opposite of color blend mode. |
| color | Creates an effect with the hue and saturation of the top layer and the luminosity of the background layer. Can be thought of as the opposite of luminosity blend mode. |
Composite blend modes:
The following blend modes can be used to mask the contents of top, background or both layers.
Destinationmodes are used to mask the data of the top layer with the data of the background layer.Sourcemodes are used to mask the data of the background layer with the data of the top layer.
The destination-in blend mode can be used to show areas of focus such as earthquakes, animal migration, or point-source pollution by revealing the underlying map,
providing a bird's eye view of the phenomenon. Check out multiple blending and groupLayer blending
samples to see composite blend modes in action.
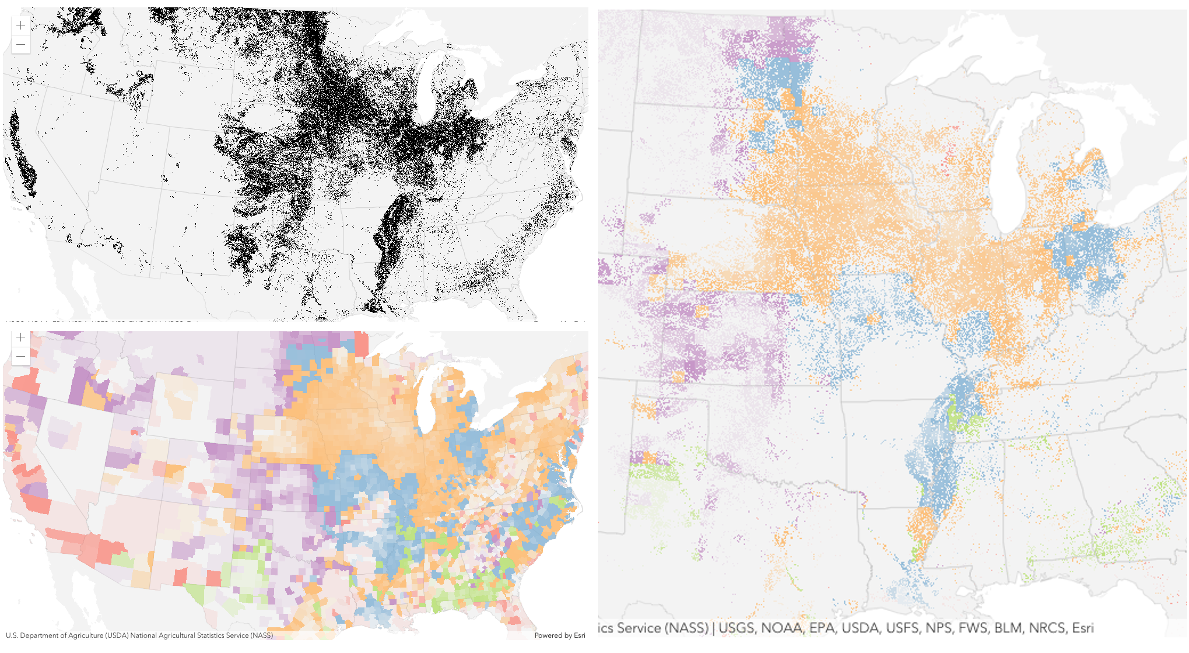
The following screenshots show feature and imagery layers on the left side on their own in the order they are drawn in the view. The imagery layer that contains land cover classification rasters.
The feature layer contains 2007 county crops data. The right image shows the result of layer blending where destination-in blendMode is set on the imagery layer. As you can see, the effect is
very different from the original layers. The blended result shows areas of cultivated crops only (where both imagery and feature layers overlap).
| Blend mode | Description |
|---|---|
| destination-over | Destination/background layer covers the top layer. The top layer is drawn underneath the destination layer. You'll see the top layer peek through wherever the background layer is transparent or has no data. |
| destination-atop | Destination/background layer is drawn only where it overlaps the top layer. The top layer is drawn underneath the background layer. You'll see the top layer peek through wherever the background layer is transparent or has no data. |
| destination-in | Destination/background layer is drawn only where it overlaps with the top layer. Everything else is made transparent. |
| destination-out | Destination/background layer is drawn where it doesn't overlap the top layer. Everything else is made transparent. |
| source-atop | Source/top layer is drawn only where it overlaps the background layer. You will see the background layer peek through where the source layer is transparent or has no data. |
| source-in | Source/top layer is drawn only where it overlaps with the background layer. Everything else is made transparent. |
| source-out | Source/top layer is drawn where it doesn't overlap the background layer. Everything else is made transparent. |
| xor | Top and background layers are made transparent where they overlap. Both layers are drawn normal everywhere else. |
Invert blend modes:
The following blend modes either invert or cancel out colors depending on colors of the background layer.
These blend modes look for variations between top and background layers.
For example, you can use difference or exclusion blend modes on two imagery layers of forest covers to visualize how forest covers changed from one year to another.
The invert blend mode can be used to turn any light basemap into a dark basemap to accommodate those who work in low-light conditions. The following screenshots show
how setting the invert blend mode set on a feature layer with a simple renderer turns the world Hillshade
into a dark themed basemap in no time.
| Blend mode | Description |
|---|---|
| difference | Subtracts the darker of the overlapping colors from the lighter color. When two pixels with the same value are subtracted, the result is black. Blending with black produces no change. Blending with white inverts the colors. This blending mode is useful for aligning layers with similar content. |
| exclusion | Similar to the difference blend mode, except that the resulting image is lighter overall. Overlapping areas with lighter color values are lightened, while darker overlapping color values become transparent. |
| minus | Subtracts colors of the top layer from colors of the background layer making the blend result darker. In the case of negative values, black is displayed. |
| invert | Inverts the background colors wherever the top and background layers overlap. The invert blend mode inverts the layer similar to a photographic negative. |
| reflect | This blend mode creates effects as if you added shiny objects or areas of light in the layer. Black pixels in the background layer are ignored as if they were transparent. |
- See also
- Default value
- "normal"
capabilities
Describes the layer's supported capabilities.
Example
// Once the layer loads, check if the supportsStatistics operations is enabled on the layerawait layer.load();if (layer.capabilities.query.supportsStatistics) {  // query for the sum of the population in all features  let sumPopulation = {    onStatisticField: "POP_2015",  // service field for 2015 population    outStatisticFieldName: "Pop_2015_sum",    statisticType: "sum"  }  let query = layer.createQuery();  query.outStatistics = [ sumPopulation ];  const { features } = await layer.queryFeatures(query);  // display the total population  console.log(`Total Population: ${features.at(0).attributes.Pop_2015_sum}`);
} customParameters
- Type
- CustomParameters | null | undefined
- Since
- ArcGIS Maps SDK for JavaScript 4.22
A list of custom parameters appended to the URL of all resources fetched by the layer.
It's an object with key-value pairs where value is a string.
The layer's refresh() method needs to be called if the customParameters are updated at runtime.
Examples
// set customParameters to request the top 3 earthquakes since 1900.// The USGS earthquakes catalog returns earthquakes with specified query parameters.const csvLayer = new CSVLayer({ url: "https://earthquake.usgs.gov/fdsnws/event/1/query", customParameters: { format: "csv", starttime: "1900-01-01", endtime: "2021-01-01", minmagnitude: "8", orderby:"magnitude", limit: "3" }});// send a custom parameter to your special servicelet layer = new MapImageLayer({ url: serviceUrl, customParameters: { "key": "my-special-key" }}); dateFieldsTimeZone
- Since
- ArcGIS Maps SDK for JavaScript 4.28
The time zone that dates are stored in. Time zone is always UTC for CSVLayer.
This property may be useful when constructing date or time where clauses.
definitionExpression
- Since
- ArcGIS Maps SDK for JavaScript 4.7
The SQL where clause used to filter features on the client. Only the features that satisfy the definition expression are displayed in the View. Setting a definition expression is useful when the dataset is large and you don't want to bring all features to the client for analysis. Definition expressions may be set when a layer is constructed prior to it loading in the view or after it has been added to the map. If the definition expression is set after the layer has been added to the map, the view will automatically refresh itself to display the features that satisfy the new definition expression.
Examples
// Set definition expression in constructor to only display earthquakes magnitude 5.0 and greaterconst layer = new CSVLayer({ url: "https://earthquake.usgs.gov/earthquakes/feed/v1.0/summary/2.5_week.csv", definitionExpression: "mag >= 5"});// Set the definition expression directly on layer instance after it has loadedlayer.definitionExpression = "mag >= 5"; displayFilterEnabled
- Type
- boolean
- Since
- ArcGIS Maps SDK for JavaScript 4.32
Indicates whether the layer's displayFilterInfo is applied when rendering the layer in the view.
If false, the layer's display filter is ignored and all features are rendered without filtering.
To ignore display filters across all layers in the view, set the view's View.displayFilterEnabled
property to false.
- Default value
- true
displayFilterInfo
- Type
- DisplayFilterInfo | null | undefined
- Since
- ArcGIS Maps SDK for JavaScript 4.32
Information related to a display filter associated with a layer. Display filters control which features are visible on the map. They allow you to display a subset of features while retaining access to all features
for querying and analysis. Unlike FeatureLayer.definitionExpression, which filters data at the source level, display filters only affect visibility on the map.
Therefore display filters should be ignored when querying data to present to users.
Display filters can be disabled for all layers in the map by setting the view's View.displayFilterEnabled property to false.
Notes:
To optimize memory usage for rendering, display filters may be appended to the layer's FeatureLayer.definitionExpression when querying the service.
As a result, the filtered features may not be available on the client for executing layer view queries.
To determine if all features are available in the view, check the layer view's FeatureLayerView.hasAllFeaturesInView
property when layer view's FeatureLayerView.dataUpdating is false. If false, the layer view does not have all features in the view
and you should query the layer instead.
Example
// set a scale-dependent display filter on a layerconst layer = new FeatureLayer({ portalItem: { id: "28dbd58ad90e4a47ab0e0334d2b69427" }, minScale: 0, maxScale: 0, outFields: ["*"], // set scale-dependent display filters to declutter the display at different scales. // Show more streams as user zooms in and less as user zooms out. displayFilterInfo: new DisplayFilterInfo({ mode: "scale", filters: [ { title: "streamOrder >= 8", minScale: 0, maxScale: 18_489_297.737236, where: "streamOrder >= 8" }, { title: "streamOrder >= 6", minScale: 18_489_297.737236 maxScale: 9_244_648.868618, where: "streamOrder >= 6" }, { title: "streamOrder >= 4", minScale: 9_244_648.868618, maxScale: 577790.5542885 where: "streamOrder >= 4" }, { title: "all", minScale: 577790.5542885, maxScale: 0 } ] })}); effect
- Since
- ArcGIS Maps SDK for JavaScript 4.18
Effect provides various filter functions that can be performed on the layer to achieve different visual effects similar to
how image filters work. This powerful capability allows you to apply css filter-like
functions to layers to create custom visual effects to enhance the cartographic quality of your maps. This is done by applying the desired
effect to the layer's effect property as a string or an array of objects to set scale dependent effects.
Notes
Set featureEffect property on a layer if different effects need to be applied features that meet or fail a specified filter. If all of the following four properties are applied, then they will be applied in this order: featureEffect, effect, opacity and blendMode.
Known Limitations
- The effect is not supported in 3D SceneViews.
- The effect cannot be applied to a layer with a heatmap renderer.
- The effect is not supported in layers with FeatureLayer.featureReduction of type
clusterenabled. - See print for known printing limitations.
Examples
// the following effect will be applied to the layer at all scales// brightness will be applied first, then hue-rotate followed by contrast// changing order of the effects will change the final resultlayer.effect = "brightness(5) hue-rotate(270deg) contrast(200%)";// set a scale dependent bloom effect on the layerlayer.effect = [ { scale: 36978595, value: "drop-shadow(3px, 3px, 4px)" }, { scale: 18489297, value: "drop-shadow(2px, 2px, 3px)" }, { scale: 4622324, value: "drop-shadow(1px, 1px, 2px)" }]; elevationInfo
- Type
- ElevationInfo | null | undefined
Specifies how features are placed on the vertical axis (z). This property may only be used in a SceneView. See the ElevationInfo sample for an example of how this property may be used.
If the elevation info is not specified, the effective elevation depends on the context and could vary per graphic.
featureEffect
- Type
- FeatureEffect | null | undefined
- Since
- ArcGIS Maps SDK for JavaScript 4.22
The featureEffect can be used to draw attention to features of interest. It allows for the selection of features via a filter, and an includedEffect and excludedEffect are applied to those features that respectively pass or fail the filter requirements.
Notes
- Set the effect property if the effect needs to be applied to the entire layer.
- If the
featureEffectis set on the layer, it will be inherited bylayerView.featureEffectunless the developer overrides it on the layer view. ThelayerView.featureEffectwill take precedence overlayer.featureEffectif both properties are set.- If all of the following four properties are applied, then they will be applied in this order: featureEffect, effect, opacity and blendMode.
Known Limitations
FeatureEffect is not supported in the following scenarios:
- In 3D SceneViews
- When FeatureReductionCluster is enabled
- See print for known printing limitations.
Examples
// gray out features that fall outside of the 3 mile buffer of the mouse's location// by setting feature effect on excluded featureslayer.featureEffect = new FeatureEffect({ filter: new FeatureFilter({ geometry: filterGeometry, spatialRelationship: "intersects", distance: 3, units: "miles" }), excludedEffect: "grayscale(100%) opacity(30%)"});// Apply a drop-shadow feature effect to the features that intersect the borough boundaries,// while applying blur and brightness effects to the features that are excluded from filter criteria.// The resulting map will make it easier to spot if the residents are more likely to experience deprivation// if they live on a borough boundary.const featureFilter = new FeatureFilter({ where: "BoroughEdge='true'"});layer.featureEffect = new FeatureEffect({ filter: featureFilter, includedEffect: "drop-shadow(3px, 3px, 3px, black)", excludedEffect: "blur(1px) brightness(65%)"}); featureReduction
- Type
- FeatureReductionUnion | null | undefined
- Since
- ArcGIS Maps SDK for JavaScript 4.4
Configures the method for reducing the number of features in the view.
By default this property is null, which indicates the layer view should draw every feature.
There are three types of feature reduction: selection, cluster, and binning.
- Selection only applies to points in a SceneView and involves thinning overlapping features so no features intersect on screen. This has been available since version 4.4.
- Cluster groups points, lines, or polygons in a MapView into clusters defined in screen space. Each cluster is a point geometry whose size is proportional to the number of features within the cluster. This has been available since version 4.14.
- Binning spatially groups points, lines, or polygons in a MapView into bins, clearly defining the area aggregating features in map space. Each bin is a polygon geometry typically rendered so its color represents the number of features within the bin. This has been available since version 4.24.
Examples
// clusters features based on their spatial proximity to other featureslayer.featureReduction = { type: "cluster", clusterRadius: 100};// thins features in the viewlayer.featureReduction = { type: "selection"};// Aggregates features to binslayer.featureReduction = { type: "binning", renderer: { type: "simple", // autocasts as new SimpleRenderer() symbol: { type: "simple-fill", // autocasts as new SimpleFillSymbol() outline: { // autocasts as new SimpleLineSymbol() width: 0.5, color: "white" } }, visualVariables: [{ type: "color", field: "aggregateCount", stops: [ { value: 1, color: "white" }, { value: 1000, color: "blue" } ] }] }, popupTemplate: { content: "This bin contains <b>{aggregateCount}</b> features.", fieldInfos: [{ fieldName: "aggregateCount", format: { digitSeparator: true, places: 0 } }] }}; fields
- Type
- Field[]
An array of fields in the layer.
Example
// define each field's schemalet fields = [ new Field({ "name": "ObjectID", "alias": "ObjectID", "type": "oid" }), new Field({ "name": "description", "alias": "Description", "type": "string" }), new Field ({ "name": "title", "alias": "Title", "type": "string" })]; fieldsIndex
- Type
- FieldsIndex<Field>
- Since
- ArcGIS Maps SDK for JavaScript 4.12
A convenient property that can be used to make case-insensitive lookups for a field by name. It can also provide a list of the date fields in a layer.
Example
// lookup a field by name. name is case-insensitiveconst field = layer.fieldsIndex.get("SoMeFiEld");
if (field) {  console.log(field.name); // SomeField}
floorInfo
- Type
- LayerFloorInfo | null | undefined
- Since
- ArcGIS Maps SDK for JavaScript 4.19
When a layer is configured as floor-aware, it has a floorInfo property defined.
A floor-aware layer is a layer that contains indoor GIS data representing features that
can be located on a specific floor of a building.
isTable
- Type
- boolean
- Since
- ArcGIS Maps SDK for JavaScript 4.24
Returns true if the layer is loaded from a non-spatial table in a service. Non-spatial tables do not have
latitudeField and longitudeField columns that represent geographic features.
The geometryType of the layer will be null if the isTable is true.
Non-spatial table instance can be created from the url and the table must be loaded by calling load() method.
labelingInfo
- Type
- LabelClass[] | null | undefined
The label definition for this layer, specified as an array of LabelClass. Use this property to specify labeling properties for the layer such as label expression, placement, and size.
Multiple Label classes with different where clauses can be used to define several
labels with varying styles on the same feature. Likewise, multiple label classes
may be used to label different types of features
Known Limitations
3D SceneViews only support displaying one LabelClass per feature.
labelsVisible
- Type
- boolean
Indicates whether to display labels for this layer. If true, labels will
appear as defined in the labelingInfo property.
Known Limitations
3D SceneViews only support displaying one LabelClass per feature.
- See also
- Default value
- true
legendEnabled
- Type
- boolean
Indicates whether the layer will be included in the legend.
- Default value
- true
listMode
- Type
- LayerListMode
Indicates how the layer should display in the Layer List component. The possible values are listed below.
| Value | Description |
|---|---|
| show | The layer is visible in the table of contents. |
| hide | The layer is hidden in the table of contents. |
| hide-children | If the layer is a GroupLayer, BuildingSceneLayer, KMLLayer, MapImageLayer, SubtypeGroupLayer, TileLayer, or WMSLayer, hide the children layers from the table of contents. |
- Default value
- "show"
loadError
The Error object returned if an error occurred while loading.
loadStatus
- Type
- "not-loaded" | "loading" | "failed" | "loaded"
Represents the status of a load() operation.
| Value | Description |
|---|---|
| not-loaded | The object's resources have not loaded. |
| loading | The object's resources are currently loading. |
| loaded | The object's resources have loaded without errors. |
| failed | The object's resources failed to load. See loadError for more details. |
- Default value
- "not-loaded"
loadWarnings
- Type
- any[]
A list of warnings which occurred while loading.
maxScale
- Type
- number
The maximum scale (most zoomed in) at which the layer is visible in the view.
If the map is zoomed in beyond this scale, the layer will not be visible.
A value of 0 means the layer does not have a maximum scale.
The maxScale value should always be smaller than the minScale value,
and greater than or equal to the service specification.
- Default value
- 0
Examples
// The layer will not be visible when the view is zoomed in beyond a scale of 1:1,000layer.maxScale = 1000;// The layer's visibility is not restricted to a maximum scale.layer.maxScale = 0; minScale
- Type
- number
The minimum scale (most zoomed out) at which the layer is visible in the view.
If the map is zoomed out beyond this scale, the layer will not be visible.
A value of 0 means the layer does not have a minimum scale.
The minScale value should always be larger than the maxScale value,
and lesser than or equal to the service specification.
- Default value
- 0
Examples
// The layer will not be visible when the view is zoomed out beyond a scale of 1:3,000,000layer.minScale = 3000000;// The layer's visibility is not restricted to a minimum scale.layer.minScale = 0; opacity
- Type
- number
The opacity of the layer. This value can range between 1 and 0, where 0 is 100 percent
transparent and 1 is completely opaque.
Known Limitations
In a 3D SceneView, modifying opacity is not supported for DimensionLayer, GaussianSplatLayer, IntegratedMesh3DTilesLayer, IntegratedMeshLayer, LineOfSightLayer, PointCloudLayer, ViewshedLayer, and VoxelLayer.
- Default value
- 1
Example
// Makes the layer 50% transparentlayer.opacity = 0.5; orderBy
- Type
- OrderByInfo[] | null | undefined
- Since
- ArcGIS Maps SDK for JavaScript 4.21
Determines the order in which features are drawn in the view. You can sort features by a field value or the value returned from an Arcade expression in ascending or descending order.
When null (default), features are drawn in the order they are returned from
the service or client.
Known Limitations
- This property only controls feature drawing order in MapView. Configuring feature drawing order in SceneView is not supported.
- This property does not control the drawing order of clusters. It only applies to individual features.
- Feature drawing order configurations defined with Arcade expressions cannot be saved to web maps.
- Currently, you can only sort features by one field or expression.
- See also
Examples
// Features with smaller population values will// be rendered on top of larger features.layer.orderBy = [{ field: "POPULATION"}];// Features with larger population values will// be rendered on top of smaller features.layer.orderBy = [{ field: "POPULATION", order: "descending"}];// Orders features by date in descending order.// The most recent features will be rendered// on top of older features.layer.orderBy = [{ field: "Alarm_Date", order: "descending"}];// Orders features by storm warning duration in descending order.// Warnings with longer durations// be rendered on top of warnings with shorter durations.layer.orderBy = [{ valueExpression: "DateDiff($feature.Watch_End, $feature.Watch_Start, 'hours' )", order: "descending"}];// Orders features by data values used in a size visual variableconst sizeVariable = layer.renderer.visualVariables.find( vv => vv.type === "size");const { field, valueExpression } = sizeVariable;layer.orderBy = [{ field, valueExpression, order: "ascending"}]; parent
- Type
- Map | Basemap | Ground | GroupLayer | CatalogDynamicGroupLayer | CatalogLayer | null | undefined
- Since
- ArcGIS Maps SDK for JavaScript 4.27
The parent to which the layer belongs.
persistenceEnabled
- Type
- boolean
- Default value
- true
popupEnabled
- Type
- boolean
Indicates whether to display popups when features in the layer are clicked. The layer needs to have a popupTemplate to define what
information should be displayed in the popup. Alternatively, a default popup template may be automatically used if
Popup.defaultPopupTemplateEnabled is set to true.
- See also
- Default value
- true
popupTemplate
- Type
- PopupTemplate | null | undefined
The popup template for the layer. When set on the layer, the popupTemplate
allows users to access attributes and display their values in the view's Popup when a feature is selected
using text and/or charts.
A default popup template is automatically used if no popupTemplate has been defined when
Popup.defaultPopupTemplateEnabled
is set to true.
portalItem
- Type
- PortalItem | null | undefined
- Since
- ArcGIS Maps SDK for JavaScript 4.25
The portal item referencing the CSV file from which the CSVLayer is loaded.
Examples
// Initialize CSVLayer by referencing a portalItem id pointing to csv file.const layer = new CSVLayer({ portalItem: { // autocasts as new PortalItem() id: "efda94edccb74f16b47b3d6e5ace9a57" }});// Initialize GeoJSONLayer by referencing a portalItem id pointing to geojson file.const layer = new CSVLayer({ portalItem: new PortalItem({ id: "efda94edccb74f16b47b3d6e5ace9a57", // optionally define the portal, of the item. // if not specified, the default portal defined is used. // see https://developers.arcgis.com/javascript/latest/references/core/config/#portalUrl portal: new Portal({ url: "https://jsapi.maps.arcgis.com/" }) }});// While this example uses FeatureLayer, this same pattern can be// used for other layers that may be loaded from portalItem ids.const layer = new FeatureLayer({ portalItem: { // autocasts as new PortalItem() id: "caa9bd9da1f4487cb4989824053bb847" } // the first layer in the service is returned});// Set hostname when using an on-premise portal (default is ArcGIS Online)// esriConfig.portalUrl = "http://myHostName.esri.com/arcgis";
// While this example uses FeatureLayer, this same pattern can be// used for SceneLayers.const layer = new FeatureLayer({ portalItem: { // autocasts as new PortalItem() id: "8d26f04f31f642b6828b7023b84c2188" }, // loads the third item in the given feature service layerId: 2});// Initialize GeoJSONLayer by referencing a portalItem id pointing to geojson file.const layer = new GeoJSONLayer({ portalItem: new PortalItem({ id: "81e769cd7031482797e1b0768f23c7e1", // optionally define the portal, of the item. // if not specified, the default portal defined is used. // see https://developers.arcgis.com/javascript/latest/references/core/config/#portalUrl portal: new Portal({ url: "https://jsapi.maps.arcgis.com/" }) }});// This snippet loads a table hosted in ArcGIS Online.const table = new FeatureLayer({ portalItem: { // autocasts as esri/portal/PortalItem id: "123f4410054b43d7a0bacc1533ceb8dc" }});
// Before adding the table to the map, it must first be loaded and confirm it is the right type.table.load().then(() => { if (table.isTable) { map.tables.add(table); }});// While this example uses FeatureLayer, this same pattern can be// used for other layers that may be loaded from portalItem ids.const layer = new FeatureLayer({ portalItem: { // autocasts as esri/portal/PortalItem id: "caa9bd9da1f4487cb4989824053bb847", // Set an API key to access a secure portal item configured with API key authentication. apiKey: "APIKEY" }}); refreshInterval
- Type
- number
- Since
- ArcGIS Maps SDK for JavaScript 4.6
Refresh interval of the layer in minutes. Value of 0 indicates no refresh.
- Default value
- 0
Example
// the layer will be refreshed every minute.layer.refreshInterval = 1; renderer
- Type
- RendererUnion | null | undefined
The renderer assigned to the layer. The renderer defines how to visualize each feature in the layer. Depending on the renderer type, features may be visualized with the same symbol, or with varying symbols based on the values of provided attribute fields or functions.
Example
// all features in the layer will be visualized with// a 6pt black marker symbol and a thin, white outlinelayer.renderer = { type: "simple", // autocasts as new SimpleRenderer() symbol: { type: "simple-marker", // autocasts as new SimpleMarkerSymbol() size: 6, color: "black", outline: { // autocasts as new SimpleLineSymbol() width: 0.5, color: "white" } }}; screenSizePerspectiveEnabled
- Type
- boolean
- Since
- ArcGIS Maps SDK for JavaScript 4.4
Apply perspective scaling to screen-size symbols in a SceneView.
When true, screen sized objects such as icons,
labels or callouts integrate
better in the 3D scene by applying a certain perspective projection to the
sizing of features. This only applies when using a SceneView.
layer.screenSizePerspectiveEnabled = true
layer.screenSizePerspectiveEnabled = false
Known Limitations
Screen size perspective is currently not optimized for situations where the camera is very near the ground, or for scenes with visual elements located far from the ground surface. In these cases it may be better to turn off screen size perspective. As screen size perspective changes the size based on distance to the camera, it should be set to false when using size visual variables.
- Default value
- true
spatialReference
- Type
- SpatialReference
- Since
- ArcGIS Maps SDK for JavaScript 4.7
The spatial reference of the layer. The default value is WGS84. This property can be set explicitly to project the longitude and latitude coordinates when the layer parses the CSV file. While not required, explicitly setting the spatial reference of the layer will improve the performance when projecting to a spatial reference other than the one used by the coordinates in the raw data.
Known Limitations
The browser must support WebAssembly if a spatial reference other than WGS84 or Web Mercator is specified.
- See also
Example
const csvLayer = new CSVLayer({ url: "example.csv", spatialReference: { wkid: 5936 }}); timeExtent
- Type
- TimeExtent | null | undefined
- Since
- ArcGIS Maps SDK for JavaScript 4.14
The layer's time extent. When the layer's useViewTime is false, the layer
instructs the view to show data from the layer based on this time extent.
If the useViewTime is true, and both layer and view time extents are set, then features that fall within
the intersection of the view and layer time extents will be displayed.
For example, if the layer's time extent is set to display features between 1970 and 1975 and
the view has a time extent set to 1972-1980, the effective time on the feature layer will be 1972-1975.
Examples
if (!layer.useViewTime) { if (layer.timeExtent) { console.log("Current timeExtent:", layer.timeExtent.start, " - ", layer.timeExtent.end} } else { console.log("The layer will display data within the view's timeExtent."); console.log("Current view.timeExtent:", view.timeExtent.start, " - ", view.timeExtent.end} }}// set the timeExtent on the layer and useViewTime false// In this case, the layer will honor its timeExtent and ignore// the view's timeExtentconst layer = new ImageryLayer({ url: "https://sampleserver6.arcgisonline.com/arcgis/rest/services/ScientificData/SeaTemperature/ImageServer", timeExtent: { start: new Date(2014, 4, 18), end: new Date(2014, 4, 19) }, useViewTime: false});// timeExtent is set on the layer and the view// In this case, the layer will display features that fall// within the intersection of view and layer time extents// features within Jan 1, 1976 - Jan 1, 1981 will be displayedconst view = new MapView({ timeExtent: { start: new Date(1976, 0, 1), end: new Date(2002, 0, 1) }});const layer = new FeatureLayer({ url: myUrl, timeExtent: { start: new Date(1974, 0, 1), end: new Date(1981, 0, 1) }}); timeInfo
- Since
- ArcGIS Maps SDK for JavaScript 4.11
TimeInfo provides information such as date fields that store
start
and end time
for each feature and the fullTimeExtent
for the layer. The timeInfo property, along with its startField and endField properties, must be set at the
time of layer initialization if it is being set for a
CSVLayer,
GeoJSONLayer or
FeatureLayer
initialized from client-side features.
The fullTimeExtent for timeInfo is
automatically calculated based on its startField and endField properties.
The timeInfo parameters cannot be changed after the layer is loaded.
TimeInfo's TimeInfo.startField and endField
can be date, date-only or timestamp-offset field type for FeatureLayer
and MapImageLayer.
Example
// create geojson layer from usgs earthquakes geojson feedconst geojsonLayer = new GeoJSONLayer({ url: "https://earthquake.usgs.gov/earthquakes/feed/v1.0/summary/all_month.geojson", copyright: "USGS Earthquakes", fields: [ { "name": "mag", "type": "double" }, { "name": "place", "type": "string" }, { "name": "time", "type": "date" }, // date field { "name": "depth", "type": "double" } ], // timeInfo can be used to do temporal queries // set the startField and endField. // timeExtent is automatically calculated from the // the start and end date fields // The date values must be in milliseconds number from the UNIX epoch specified in UTC. timeInfo: { startField: "time" }}); timeOffset
- Type
- TimeInterval | null | undefined
- Since
- ArcGIS Maps SDK for JavaScript 4.14
A temporary offset of the time data based on a certain TimeInterval. This allows users to overlay features from two or more time-aware layers with different time extents. For example, if a layer has data recorded for the year 1970, an offset value of 2 years would temporarily shift the data to 1972. You can then overlay this data with data recorded in 1972. A time offset can be used for display purposes only. The query and selection are not affected by the offset.
Example
// Offset a CSV Layer containing hurricanes from 2015 so that they appear in 2019 (+4 years).let layer = new CSVLayer({ url: `hurricanes-and-storms-2015.csv`, timeOffset: { value: 4, unit: "years" }, timeInfo: { startField: "ISO_time" }, renderer: { type: "simple", symbol: { type: "simple-marker", size: 6, color: "red", outline: { width: 0.5, color: "black" } } }}); title
The title of the layer used to identify it in places such as the Legend and LayerList.
When the layer is loaded from a portal item, the title of the portal item will be used. If a layer is loaded as part of a webmap or a webscene, then the title of the layer as stored in the webmap/webscene will be used.
trackInfo
- Since
- ArcGIS Maps SDK for JavaScript 4.32
Allows you to render track data for a layer, including a track line, previous observations, and latest observations.
For trackInfo to work, the layer must have timeInfo defined with a valid
trackIdField.
uid
- Type
- string
- Since
- ArcGIS Maps SDK for JavaScript 4.33
An automatically generated unique identifier assigned to the instance. The unique id is generated each time the application is loaded.
url
The URL of the CSV file.
Examples
const csvLayer = new CSVLayer({ url: "https://earthquake.usgs.gov/earthquakes/feed/v1.0/summary/2.5_week.csv",});// Pass data by a blob url to create a CSV layer.const csv = `name|year|latitude|Longitudeaspen|2020|40.418|20.553birch|2018|-118.123|35.888`;
const blob = new Blob([csv], { type: "plain/text"});let url = URL.createObjectURL(blob);
const layer = new CSVLayer({ url: url}); useViewTime
- Type
- boolean
- Since
- ArcGIS Maps SDK for JavaScript 4.14
Determines if the time enabled layer will update its temporal data based on the view's
timeExtent. When false, the layer will display its temporal
data based on the layer's timeExtent, regardless of changes to the view.
If both view and layer time extents are set while this property is true, then the features that fall within
the intersection of the view and layer time extents will be displayed.
For example, if a layer's time extent is set to display features between 1970 and 1975 and
the view has a time extent set to 1972-1980, the effective time on the feature layer will be 1972-1975.
Changing useViewTime to false does not affect layer's visibilityTimeExtent.
- Default value
- true
Example
if (featureLayer.useViewTime) { console.log("Displaying data between:", view.timeExtent.start, " - ", view.timeExtent.end);} visibilityTimeExtent
- Type
- TimeExtent | null | undefined
- Since
- ArcGIS Maps SDK for JavaScript 4.30
Specifies a fixed time extent during which a layer should be visible. This property can be used to configure a layer that does not have time values stored in an attribute field to work with time. Once configured, the TimeSlider widget will display the layer within the set time extent. In the case that only one of the TimeExtent.start or TimeExtent.end date values are available, the layer remains visible indefinitely in the direction where there is no time value.
Aerial imagery can capture seasonal variations in vegetation, water bodies, and land use patterns. For example, in agricultural regions, aerial imageries taken during different growing seasons provide insights into crop health and productivity. Defining a fixed time extent on imageries from specific time periods provides temporal context and facilitates focused analysis based on specific time periods or events.
visible
- Type
- boolean
Indicates if the layer is visible in the View. When false,
the layer may still be added to a Map
instance that is referenced in a view, but its features will not be visible in the view.
- Default value
- true
Example
// The layer is no longer visible in the viewlayer.visible = false;
// Watch for changes in the layer's visibility// and set the visibility of another layer when it changesreactiveUtils.watch(  () => layer.visible,  (visible) => {    if (visible) {      anotherLayer.visible = true;    } else {      anotherLayer.visible = false;    }  });
Methods
| Method | Signature | Class |
|---|---|---|
fromArcGISServerUrl inherited static | fromArcGISServerUrl(params: string | FromArcGISServerUrlParameters): Promise<Layer> | |
fromPortalItem inherited static | fromPortalItem(params: LayerFromPortalItemParameters): Promise<Layer> | |
cancelLoad inherited | cancelLoad(): this | |
createLayerView inherited | createLayerView<T extends LayerView = LayerView>(view: View<T>, options?: AbortOptions): Promise<T> | |
createPopupTemplate(options?: CreatePopupTemplateOptions): PopupTemplate | null | undefined | | |
createQuery(): Query | | |
destroy inherited | destroy(): void | |
emit inherited | emit<Type extends EventNames<this>>(type: Type, event?: this["@eventTypes"][Type]): boolean | |
fetchAttributionData inherited | fetchAttributionData(): Promise<any> | |
getField(fieldName: string): Field | null | undefined | | |
getFieldDomain(fieldName: string, options?: FieldDomainOptions): DomainUnion | null | undefined | | |
hasEventListener inherited | hasEventListener<Type extends EventNames<this>>(type: Type): boolean | |
isFulfilled inherited | isFulfilled(): boolean | |
isRejected inherited | isRejected(): boolean | |
isResolved inherited | isResolved(): boolean | |
load inherited | load(options?: AbortOptions | null | undefined): Promise<this> | |
on inherited | on<Type extends EventNames<this>>(type: Type, listener: EventedCallback<this["@eventTypes"][Type]>): ResourceHandle | |
queryAttributeBins(binsQuery: AttributeBinsQueryProperties, options?: RequestOptions): Promise<AttributeBinsFeatureSet> | | |
 queryExtent(query?: QueryProperties | null | undefined, options?: RequestOptions): Promise<{
    count: number;
    extent: Extent | null;
}> | | |
queryFeatureCount(query?: QueryProperties | null | undefined, options?: RequestOptions): Promise<number> | | |
queryFeatures(query?: QueryProperties | null | undefined, options?: RequestOptions): Promise<FeatureSet> | | |
queryObjectIds(query?: QueryProperties | null | undefined, options?: RequestOptions): Promise<number[]> | | |
refresh(): void | | |
when inherited | when<TResult1 = this, TResult2 = never>(onFulfilled?: OnFulfilledCallback<this, TResult1> | null | undefined, onRejected?: OnRejectedCallback<TResult2> | null | undefined): Promise<TResult1 | TResult2> |
fromArcGISServerUrl
- Signature
-
fromArcGISServerUrl (params: string | FromArcGISServerUrlParameters): Promise<Layer>
Creates a new layer instance from an ArcGIS Server URL. Depending on the URL, the returned layer type may be a BuildingSceneLayer, CatalogLayer, ElevationLayer, FeatureLayer, GroupLayer, ImageryLayer, ImageryTileLayer, IntegratedMeshLayer, KnowledgeGraphLayer, MapImageLayer, OrientedImageryLayer, PointCloudLayer, SceneLayer, StreamLayer, SubtypeGroupLayer, TileLayer, or VideoLayer.
This is useful when you work with various ArcGIS Server URLs, but you don't necessarily know which layer type(s) they create. This method creates the appropriate layer type for you. In case of a feature service or a scene service, when the URL points to the service and the service has multiple layers, the returned promise will resolve to a GroupLayer.
Beginning with version 4.17, it is possible to load tables from hosted feature services.
This only applies to feature layers, and will successfully load if FeatureLayer.isTable returns true.
The following table details what is returned when loading specific URL types.
| URL | Returns |
|---|---|
| Feature service with one layer | FeatureLayer where FeatureLayer.isTable returns false. |
| Feature service with one table | FeatureLayer where FeatureLayer.isTable returns true. |
| Feature service with more than one layer(s)/table(s) | GroupLayer with layers and tables. |
| Layers with type other than "Feature Layer" are discarded, e.g. Utility Network Layers | N/A |
- See also
Parameters
| Parameter | Type | Description | Required |
|---|---|---|---|
| params | Input parameters for creating the layer. | |
Examples
// This snippet shows how to add a feature layer from an ArcGIS Server URL// Get an ArcGIS Server URL from a custom functionconst arcgisUrl = getLayerUrl();
Layer.fromArcGISServerUrl({  url: arcgisUrl,  properties: {    // set any layer properties here    popupTemplate: new PopupTemplate()  }}).then(function(layer){  // add the layer to the map  map.add(layer);});
// This snippet shows how to add a table from an ArcGIS Server URL// Get an ArcGIS Server URL from a custom functionconst arcgisUrl = getLayerUrl();
Layer.fromArcGISServerUrl({ url: arcgisUrl}).then(function(layer){ // Load the table before it can be used layer.load().then(function() { // Check that it is the right type if (layer.isTable) { // Add table to map's tables collection map.tables.add(layer); } });}); fromPortalItem
- Signature
-
fromPortalItem (params: LayerFromPortalItemParameters): Promise<Layer>
Creates a new layer instance of the appropriate layer class from an ArcGIS Online or ArcGIS Enterprise portal item. If the item points to a feature service with multiple layers, then a GroupLayer is created. If the item points to a service with a single layer, then it resolves to a layer of the same type of class as the service.
Note
- At version 4.29, MediaLayer can be loaded from portal items.
- At version 4.28, GroupLayer and OrientedImageryLayer can be loaded from portal items.
- At version 4.25, CSVLayer and GeoJSONLayer can be loaded from CSV and GeoJSON portal items respectively.
- At version 4.17, it is possible to load tables from feature service items hosted in ArcGIS Online and ArcGIS Enterprise.
This only applies to feature layers, and will successfully load
if FeatureLayer.isTable returns
true.
The following table details what is returned when loading specific item types.
| Item(s) | Returns |
|---|---|
| Feature service with one layer | FeatureLayer where FeatureLayer.isTable returns false. |
| Feature service with one table | FeatureLayer where FeatureLayer.isTable returns true. |
| Feature service with more than one layer(s)/table(s) | GroupLayer with layers and tables. |
| Feature collection with one layer | FeatureLayer where FeatureLayer.isTable returns false. |
| Feature collection with one table | FeatureLayer where FeatureLayer.isTable returns true. |
| Feature collection with more than one layer(s)/table(s) | GroupLayer with layers and tables. |
Known Limitations
- This method does not currently work with OGCFeatureServer portal items.
Parameters
| Parameter | Type | Description | Required |
|---|---|---|---|
| params | The parameters for loading the portal item. | |
Examples
// Create a layer from a specified portal item and add to the mapLayer.fromPortalItem({ portalItem: { // autocasts new PortalItem() id: "8444e275037549c1acab02d2626daaee" }}).then(function(layer){ // add the layer to the map map.add(layer);});// Create a table from a specified portal item and add it to the map's tables collectionLayer.fromPortalItem({ portalItem: { // autocasts new PortalItem() id: "123f4410054b43d7a0bacc1533ceb8dc" // This is a hosted table stored in a feature service }}).then(function(layer) { // Necessary to load the table in order for it to be read correctly layer.load().then(function() { // Confirm this reads as a table if (layer.isTable) { // Add the new table to the map's table collection map.tables.add(layer); } });}); cancelLoad
- Signature
-
cancelLoad (): this
Cancels a load() operation if it is already in progress.
- Returns
- this
createLayerView
- Signature
-
createLayerView <T extends LayerView = LayerView>(view: View<T>, options?: AbortOptions): Promise<T>
Called by the views, such as MapView and SceneView, when the layer is added to the Map.layers collection and a layer view must be created for it. This method is used internally and there is no use case for invoking it directly.
- See also
Parameters
| Parameter | Type | Description | Required |
|---|---|---|---|
| view | The parent view. | | |
| options | An object specifying additional options. See the object specification table below for the required properties of this object. | |
createPopupTemplate
- Signature
-
createPopupTemplate (options?: CreatePopupTemplateOptions): PopupTemplate | null | undefined
Creates a popup template for the layer, populated with all the fields of the layer.
Parameters
| Parameter | Type | Description | Required |
|---|---|---|---|
| options | Options for creating the popup template. | |
- Returns
- PopupTemplate | null | undefined
The popup template, or
nullif the layer does not have any fields.
createQuery
- Signature
-
createQuery (): Query
Creates query parameter object that can be used to fetch features that
satisfy the layer's configurations such as definitionExpression.
It sets the query parameter's Query.outFields property to ["*"].
- Returns
- Query
The query object representing the layer's definition expression and other configurations.
Example
// Get a query object for the layer's current configuration// queryParams.outFields will be set to ["*"] to get values// for all available fields.const queryParams = layer.createQuery();// set a geometry for filtering features by a region of interestqueryParams.geometry = extentForRegionOfInterest;// Add to the layer's current definitionExpressionqueryParams.where = queryParams.where + " AND TYPE = 'Extreme'";
// query the layer with the modified params objectlayer.queryFeatures(queryParams).then(function(results){  // prints the array of result graphics to the console  console.log(results.features);});
destroy
- Signature
-
destroy (): void
- Since
- ArcGIS Maps SDK for JavaScript 4.17
Destroys the layer and any associated resources (including its portalItem, if it is a property on the layer). The layer can no longer be used once it has been destroyed.
The destroyed layer will be removed from its parent object like Map, WebMap, WebScene, Basemap, Ground, or GroupLayer.
- Returns
- void
emit
- Signature
-
emit <Type extends EventNames<this>>(type: Type, event?: this["@eventTypes"][Type]): boolean
- Type parameters
- <Type extends EventNames<this>>
- Since
- ArcGIS Maps SDK for JavaScript 4.5
Emits an event on the instance. This method should only be used when creating subclasses of this class.
getField
- Signature
-
getField (fieldName: string): Field | null | undefined
Returns a Field based on a case-insensitive name search.
- See also
getFieldDomain
- Signature
-
getFieldDomain (fieldName: string, options?: FieldDomainOptions): DomainUnion | null | undefined
Returns the Domain associated with the given field name. The domain can be either a CodedValueDomain or RangeDomain.
Parameters
| Parameter | Type | Description | Required |
|---|---|---|---|
| fieldName | Name of the field. | | |
| options | An object with the following properties. | |
- Returns
- DomainUnion | null | undefined
The Domain associated with the given field name for the given feature.
hasEventListener
- Signature
-
hasEventListener <Type extends EventNames<this>>(type: Type): boolean
- Type parameters
- <Type extends EventNames<this>>
Indicates whether there is an event listener on the instance that matches the provided event name.
Parameters
| Parameter | Type | Description | Required |
|---|---|---|---|
| type | Type | The name of the event. | |
- Returns
- boolean
Returns true if the class supports the input event.
isFulfilled
- Signature
-
isFulfilled (): boolean
isFulfilled() may be used to verify if creating an instance of the class is fulfilled (either resolved or rejected).
If it is fulfilled, true will be returned.
- Returns
- boolean
Indicates whether creating an instance of the class has been fulfilled (either resolved or rejected).
isRejected
- Signature
-
isRejected (): boolean
isRejected() may be used to verify if creating an instance of the class is rejected.
If it is rejected, true will be returned.
- Returns
- boolean
Indicates whether creating an instance of the class has been rejected.
isResolved
- Signature
-
isResolved (): boolean
isResolved() may be used to verify if creating an instance of the class is resolved.
If it is resolved, true will be returned.
- Returns
- boolean
Indicates whether creating an instance of the class has been resolved.
load
- Signature
-
load (options?: AbortOptions | null | undefined): Promise<this>
Loads the resources referenced by this class. This method automatically executes for a View and all of the resources it references in Map if the view is constructed with a map instance.
This method must be called by the developer when accessing a resource that will not be loaded in a View.
The load() method only triggers the loading of the resource the first time it is called. The subsequent calls return the same promise.
It's possible to provide a signal to stop being interested into a Loadable instance load status.
When the signal is aborted, the instance does not stop its loading process, only cancelLoad() can abort it.
on
- Signature
-
on <Type extends EventNames<this>>(type: Type, listener: EventedCallback<this["@eventTypes"][Type]>): ResourceHandle
- Type parameters
- <Type extends EventNames<this>>
Registers an event handler on the instance. Call this method to hook an event with a listener.
Parameters
| Parameter | Type | Description | Required |
|---|---|---|---|
| type | Type | An event or an array of events to listen for. | |
| listener | EventedCallback<this["@eventTypes"][Type]> | The function to call when the event fires. | |
- Returns
- ResourceHandle
Returns an event handler with a
remove()method that should be called to stop listening for the event(s).Property Type Description remove Function When called, removes the listener from the event.
Example
view.on("click", function(event){ // event is the event handle returned after the event fires. console.log(event.mapPoint);}); queryAttributeBins
- Signature
-
queryAttributeBins (binsQuery: AttributeBinsQueryProperties, options?: RequestOptions): Promise<AttributeBinsFeatureSet>
- Since
- ArcGIS Maps SDK for JavaScript 4.32
Executes a AttributeBinsQuery against a the layer, which groups features into bins based on ranges in numeric or date fields, and returns a AttributeBinsFeatureSet containing the series of bins. Please refer to the AttributeBinsQuery document for more detailed information on how to configure the bin parameters.
Binned data can condense complex information into meaningful insight. This query allows you to classify data into meaningful categories and summarize the data within each bin with summary statistics. Binned data can be effectively visualized in histograms (or bar charts), providing clearer insights into data distributions and trends. It can reveal underlying patterns that might be obscured in raw data. For example, bins can show concentrations of values in common ranges.
Notes
The queryAttributeBins() method is unrelated to querying bins in FeatureReductionBinning.
Parameters
| Parameter | Type | Description | Required |
|---|---|---|---|
| binsQuery | Specifies the parameters of the | | |
| options | An object with the following properties. | |
- Returns
- Promise<AttributeBinsFeatureSet>
When resolved, returns a FeatureSet containing a series of bins. Each feature in the AttributeBinsFeatureSet represents a bin. The attributes of each feature contains statistics summarizing the data in the bin, including count, average, standard deviation, etc.
Example
// Query the temperature field in the layer and create a histogram// Analyze temperature data over a year, create 100 bins for different temperature ranges// to assess frequency and identify patterns.const binQuery = new AttributeBinsQuery({  where: "UnitTop = 0",  binParameters: new AutoIntervalBinParameters({    bins: 100,    field: "temp",    start: 0, // lowest temp value to be included in the bin query    end: 30 // highest temp value to be included  })});
layer.queryAttributeBins(query).then((results) => {  const bins = results.features.map((bin) => {    return {      minValue: bin.attributes.lowerBoundary,      maxValue: bin.attributes.upperBoundary,      count: bin.attributes.temperature_count,    };  });
  // get the lower boundary of the first bin  const min = results.features[0].attributes.lowerBoundary;  // get the upper boundary of the last bin  const max = results.features[results.features.length - 1].attributes.upperBoundary;  // calculate the average for the bins  const average = results.features[0].attributes.lowerBoundary + results.features[results.features.length - 1].attributes.upperBoundary) / 2;
  const histogram = new Histogram({    container: "histogramDiv",    bins: bins,    min: min,    max: max,    average: average,    barCreatedFunction:(index, element) => {      element.setAttribute("fill", "#FFA500");      element.setAttribute("opacity", 0.5);    },    labelFormatFunction: (value, type) => {      return (Math.round(value)).toLocaleString();    },    dataLines: [{      value: histogram.min,      label: histogram.min.toLocaleString()    }, {      value: histogram.average,      label: histogram.average.toLocaleString()    }, {      value: histogram.max,      label: histogram.max.toLocaleString()    }]  });});
queryExtent
- Signature
-
 queryExtent (query?: QueryProperties | null | undefined, options?: RequestOptions): Promise<{
    count: number;
    extent: Extent | null;
}>
- Since
- ArcGIS Maps SDK for JavaScript 4.7
Executes a Query against the CSV data and returns the Extent of features that satisfy the query. If no parameters are specified, then the extent and count of all features satisfying the layer's configuration/filters are returned.
Known Limitations
Spatial queries have the same limitations as those listed in the projectOperator documentation. Spatial queries are currently not supported if the layer view has any of the following SpatialReferences:
- GDM 2000 (4742) – Malaysia
- Gusterberg (Ferro) (8042) – Austria/Czech Republic
- ISN2016 (8086) - Iceland
- SVY21 (4757) - Singapore
Parameters
| Parameter | Type | Description | Required |
|---|---|---|---|
| query | Specifies the attributes and spatial filter of the query.
When no parameters are passed to this method, all features in the client are returned. To only return features
visible in the view, set the | | |
| options | An object with the following properties. | |
- Returns
- Promise<{
count: number;
extent: Extent | null;
}>
When resolved, returns the extent and count of the features that satisfy the input query. See the object specification table below for details.
Property Type Description count Number The number of features that satisfy the input query. extent Extent | null The extent of the features that satisfy the query.
Example
// Queries for the extent of all features// zooms to the extentcsvLayer.when(function () { csvLayer.queryExtent().then(function (results) { view.goTo(results.extent); }) .catch(function (error) { console.log(error) });}); queryFeatureCount
- Signature
-
queryFeatureCount (query?: QueryProperties | null | undefined, options?: RequestOptions): Promise<number>
- Since
- ArcGIS Maps SDK for JavaScript 4.7
Executes a Query against the CSV data and returns the number of features that satisfy the query. If no parameters are specified, then the total number of features satisfying the layer's configuration/filters is returned.
Known Limitations
Spatial queries have the same limitations as those listed in the projectOperator documentation. Spatial queries are currently not supported if the layer view has any of the following SpatialReferences:
- GDM 2000 (4742) – Malaysia
- Gusterberg (Ferro) (8042) – Austria/Czech Republic
- ISN2016 (8086) - Iceland
- SVY21 (4757) - Singapore
Parameters
| Parameter | Type | Description | Required |
|---|---|---|---|
| query | Specifies the attributes and spatial filter of the query.
When no parameters are passed to this method, all features in the client are returned. To only return features
visible in the view, set the | | |
| options | An object with the following properties. | |
Example
// returns all features in the CSVLayercsvLayer.queryFeatureCount().then(function (count) { console.log("Feature count: ", count);}).catch(function (error) { console.log(error)}); queryFeatures
- Signature
-
queryFeatures (query?: QueryProperties | null | undefined, options?: RequestOptions): Promise<FeatureSet>
- Since
- ArcGIS Maps SDK for JavaScript 4.7
Executes a Query against the CSV data and returns a FeatureSet once the promise resolves. A FeatureSet contains an array of Graphic features, which can be added to the view's graphics. This array will not be populated if zero results are found.
Known Limitations
Attribute values used in attribute queries executed against CSVLayer are case sensitive. Spatial queries have the same limitations as those listed in the projectOperator documentation. Spatial queries are not currently supported if the layer view has any of the following SpatialReferences:
- GDM 2000 (4742) – Malaysia
- Gusterberg (Ferro) (8042) – Austria/Czech Republic
- ISN2016 (8086) - Iceland
- SVY21 (4757) - Singapore
Parameters
| Parameter | Type | Description | Required |
|---|---|---|---|
| query | Specifies the attributes and spatial filter of the query.
When no parameters are passed to this method, all features in the client are returned. To only return features
visible in the view, set the | | |
| options | An object with the following properties. | |
- Returns
- Promise<FeatureSet>
When resolved, a FeatureSet containing an array of graphic features is returned.
Examples
// Queries for all the featurescsvLayer.queryFeatures().then(function(results){ // prints the array of result graphics to the console console.log(results.features);});// Queries for all the features that matches the where clauselet csvLayer = new CSVLayer({ url: "urlToService"});
csvLayer.load().then(function(){ let query = new Query({ where: "mag > 5", returnGeometry: true });
return csvLayer.queryFeatures(query);}).then(function(results){ displayResults(results);}).catch(function (error) { console.log(error)}); queryObjectIds
- Signature
-
queryObjectIds (query?: QueryProperties | null | undefined, options?: RequestOptions): Promise<number[]>
- Since
- ArcGIS Maps SDK for JavaScript 4.7
Executes a Query against the CSV data and returns an array of Object IDs for features that satisfy the input query. If no parameters are specified, then the Object IDs of all features satisfying the layer's configuration/filters are returned.
Known Limitations
Spatial queries have the same limitations as those listed in the projectOperator documentation. Spatial queries are currently not supported if the layer view has any of the following SpatialReferences:
- GDM 2000 (4742) – Malaysia
- Gusterberg (Ferro) (8042) – Austria/Czech Republic
- ISN2016 (8086) - Iceland
- SVY21 (4757) - Singapore
Parameters
| Parameter | Type | Description | Required |
|---|---|---|---|
| query | Specifies the attributes and spatial filter of the query.
When no parameters are passed to this method, all features in the client are returned. To only return features
visible in the view, set the | | |
| options | An object with the following properties. | |
Examples
// Queries for all the Object IDs of featurescsvLayer.queryObjectIds().then(function(results){ // prints the array of Object IDs to the console console.log(results);});const query = new Query({ where: "state = California"});
//query objectIds of features belonging to CaliforniacsvLayer.queryObjectIds(query).then(function(ids){ console.log(ids); // an array of object IDs}); refresh
- Signature
-
refresh (): void
- Since
- ArcGIS Maps SDK for JavaScript 4.22
Fetches all the data for the layer.
- Returns
- void
Example
// update the customParameters for the query then call// refresh method to fetch new features from the csv feedcsvLayer.customParameters.limit = 10;csvLayer.refresh(); when
- Signature
-
when <TResult1 = this, TResult2 = never>(onFulfilled?: OnFulfilledCallback<this, TResult1> | null | undefined, onRejected?: OnRejectedCallback<TResult2> | null | undefined): Promise<TResult1 | TResult2>
- Since
- ArcGIS Maps SDK for JavaScript 4.6
when() may be leveraged once an instance of the class is created. This method takes two input parameters: an onFulfilled function and an onRejected function.
The onFulfilled executes when the instance of the class loads. The
onRejected executes if the instance of the class fails to load.
Parameters
| Parameter | Type | Description | Required |
|---|---|---|---|
| onFulfilled | OnFulfilledCallback<this, TResult1> | null | undefined | The function to call when the promise resolves. | |
| onRejected | The function to execute when the promise fails. | |
- Returns
- Promise<TResult1 | TResult2>
Returns a new promise for the result of
onFulfilledthat may be used to chain additional functions.
Example
// Although this example uses MapView, any class instance that is a promise may use when() in the same waylet view = new MapView();view.when(function(){ // This function will execute once the promise is resolved}, function(error){ // This function will execute if the promise is rejected due to an error});Events
| Name | Type |
|---|---|
layerview-create inherited | |
layerview-create-error inherited | |
layerview-destroy inherited | |
refresh inherited |
layerview-create
layerview-create: CustomEvent<LayerLayerviewCreateEvent> Fires after the layer's LayerView is created and rendered in a view.
- See also
Example
// This function will fire each time a layer view is created for this// particular view.layer.on("layerview-create", function(event){ // The LayerView for the layer that emitted this event event.layerView;}); layerview-create-error
layerview-create-error: CustomEvent<LayerLayerviewCreateErrorEvent> Fires when an error emits during the creation of a LayerView after a layer has been added to the map.
- See also
Example
// This function fires when an error occurs during the creation of the layer's layerviewlayer.on("layerview-create-error", function(event) { console.error("LayerView failed to create for layer with the id: ", layer.id, " in this view: ", event.view);}); layerview-destroy
layerview-destroy: CustomEvent<LayerLayerviewDestroyEvent> Fires after the layer's LayerView is destroyed and no longer renders in a view.
refresh
refresh: CustomEvent<RefreshEvent> - Since
- ArcGIS Maps SDK for JavaScript 4.21
Fires if the layer has the refreshInterval set or when refresh() method is called. The event payload indicates if the layer's data has changed.
Examples
// listen to layer's refresh event to fetch the attachments// for the updated features.layer.on("refresh", async (event) =>{  if (!event.dataChanged){    return;  }
  try {    const query = layer.createQuery();    const objectIds = await layer.queryObjectIds(query);    let attachmentQuery = {      objectIds: objectIds,      definitionExpression: layer.definitionExpression,      attachmentTypes: ["image/jpeg"]    };
    const attachments = await layer.queryAttachments(attachmentQuery);
    attachmentQuery.objectIds.forEach(function (objectId) {      if (attachments[objectId]) {        // process the updated attachments        let attachment = attachments[objectId];        console.log("Attachments for objectId ", objectId, attachment);      }    });  } catch (error) {    console.log("attachment query error", error);  }});
// listen to layer's refresh event to fetch object ids of completed featureslayer.on("refresh", function(event){ if (event.dataChanged){ const query = layer.createQuery(); query.where = "Status = 'Completed'"; layer.queryObjectIds(query).then((objectIds) => { // process returned features }); }});