import HeatmapRenderer from "@arcgis/core/renderers/HeatmapRenderer.js";const HeatmapRenderer = await $arcgis.import("@arcgis/core/renderers/HeatmapRenderer.js");- Since
- ArcGIS Maps SDK for JavaScript 4.8
The HeatmapRenderer uses kernel density to render point features in FeatureLayers, CSVLayers, GeoJSONLayers and OGCFeatureLayers as a raster surface.
To create this visual, the HeatmapRenderer fits a smoothly curved surface over each point. The surface value is highest at the location of the point and decreases proportionally to the distance from the point, reaching zero at the distance from the point specified in radius. The value of the surface equals the field value for the point, or 1 if no field is provided. The density at each pixel is calculated by adding the values of all the kernel surfaces where they overlay.
Because there isn't an API for querying density values in a layer view, we suggest you use the heatmapRendererCreator smart mapping function for creating the initial view of a heatmap, and then making renderer adjustments as needed.
Colors are assigned to each pixel based on their density value. The color ramp specified by the colorStops property maps colors to the ratio of each pixel's density value to the maxDensity. This eases the process for creating your own color stops since you don't need to know the range of density values to apply a color ramp to the renderer.
Known Limitations
Labels on layers using HeatmapRenderer are currently not supported in a 3D SceneView.
Example
layer.renderer = { type: "heatmap", field: "crime_count", colorStops: [ { ratio: 0, color: "rgba(255, 255, 255, 0)" }, { ratio: 0.2, color: "rgba(255, 255, 255, 1)" }, { ratio: 0.5, color: "rgba(255, 140, 0, 1)" }, { ratio: 0.8, color: "rgba(255, 140, 0, 1)" }, { ratio: 1, color: "rgba(255, 0, 0, 1)" } ], minDensity: 0, maxDensity: 500, radius: 10};Constructors
Constructor
Parameters
| Parameter | Type | Description | Required |
|---|---|---|---|
| properties | | |
Properties
| Property | Type | Class |
|---|---|---|
authoringInfo inherited | ||
| | ||
declaredClass readonly inherited | ||
| | ||
| | ||
| | ||
| | ||
| | ||
| | ||
type readonly | "heatmap" | |
| | ||
| |
authoringInfo
- Type
- AuthoringInfo | null | undefined
Authoring metadata only included in renderers generated from one of the Smart Mapping creator methods, such as sizeRendererCreator.createContinuousRenderer() or colorRendererCreator.createContinuousRenderer(). This includes information from UI elements such as sliders and selected classification methods and themes. This allows the authoring clients to save specific overridable settings so that next time it is accessed via the UI, their selections can be remembered.
colorStops
- Type
- HeatmapColorStop[]
An array of objects describing the renderer's color ramp. The ratio of a pixel's density value to the
maxDensity of the renderer is mapped to a corresponding color.
The color of the first stop (i.e. the stop with the lowest ratio value) must
have an alpha value of 0 for the underlying basemap to be visible in the app.
The default value is the following:
[ { ratio: 0, color: "rgba(255, 140, 0, 0)" }, { ratio: 0.75, color: "rgba(255, 140, 0, 1)" }, { ratio: 0.9, color: "rgba(255, 0, 0, 1)" }] field
- Type
- string
The name of the attribute field used to weight the density of each heatmap point.
For example, suppose you have a layer of points representing buildings containing a
field num_units for the number of units in the building (if it's an apartment complex). You could
weight the heatmap renderer based on the num_units field to create a heatmap representing
the density of housing units in a city.
Example
renderer.field = "num_units"; legendOptions
- Type
- HeatmapLegendOptions | null | undefined
- Since
- ArcGIS Maps SDK for JavaScript 4.24
An object providing options for describing the renderer in the Legend.
Example
renderer.legendOptions = { title: "Car crashes", minLabel: "Few crashes", maxLabel: "Frequent crashes"}; maxDensity
- Type
- number
- Since
- ArcGIS Maps SDK for JavaScript 4.24
The max density value to be assigned a color in the heatmap surface.
Both minDensity and maxDensity determine how colorStops are applied to the heatmap surface.
Pixels with density values above this number will be assigned the final (or hottest) color in the color ramp.
Typically, minDensity will be zero and maxDensity will be set
to a higher value appropriate for the dataset. The default may not be ideal for your dataset,
so this value will likely need to change.
Determining the best values for minDensity and maxDensity is an exercise left up to the developer
since different types, scales, densities, and distributions of data will require different values for these properties
to create a visually pleasing separation of high and low density areas appropriate for the data and the application.
Because there isn't an API for querying density values in a layer view, we suggest you use the heatmapRendererCreator smart mapping function for creating the initial view of a heatmap, and then making adjustments as needed.
- Default value
- 0.04
Example
renderer.maxDensity = 100; minDensity
- Type
- number
- Since
- ArcGIS Maps SDK for JavaScript 4.24
The minimum density value to be assigned a color in the heatmap surface.
Both minDensity and maxDensity determine how colorStops are applied to the heatmap surface.
Pixels with density values below the minDensity will be excluded from the visualization.
When using a field to weight the heatmap, setting minDensity above zero might help to visually deemphasize
frequently occurring but low value areas. This property does not actually filter the data or
modify the calculated density value. Rather, it scales the color ramp such that a higher
density value is required for a pixel to get a noticeable color.
Determining the best values for minDensity and maxDensity is an exercise left up to the developer
since different types, scales, densities, and distributions of data will require different values for these properties
to create a visually pleasing separation of high and low density areas appropriate for the data and the application.
Because there isn't an API for querying density values in a layer view, we suggest you use the heatmapRendererCreator smart mapping function for creating the initial view of a heatmap, and then making adjustments as needed.
- Default value
- 0
Example
renderer.minDensity = 10; radius
- Type
- number
- Since
- ArcGIS Maps SDK for JavaScript 4.24
The search radius (in points) used to create a smooth kernel surface fitted around each point.
The density value is highest at the location of the point and decreases as the distance away
from the point increases. The density value is 0 at the distance specified in radius
from the point.
Known Limitations
HeatmapRenderer.radius is limited to 112 pt in 3D SceneViews.
- Default value
- 18
Examples
// radius in pointsrenderer.radius = 14;// radius in pixelsrenderer.radius = "20px";// radius in pointsrenderer.radius = "14pt"; referenceScale
- Type
- number
- Since
- ArcGIS Maps SDK for JavaScript 4.24
When set, the heatmap's visualization at the given scale will remain static and not
change as the user zooms in and out of the view. This fixes each point's
influence radius to a real-world range that doesn't change depending on the zoom level). The
pixels of radius are defined at the reference scale.
A value of 0 means that the heatmap does not have a referenceScale.
The following images demonstrate how setting a reference scale will preserve a heatmap across various scales as opposed to dynamically updating on zoom.
| Zoom offset from reference scale | Static (reference scale) | Dynamic (no reference scale) |
|---|---|---|
| +1 LOD | 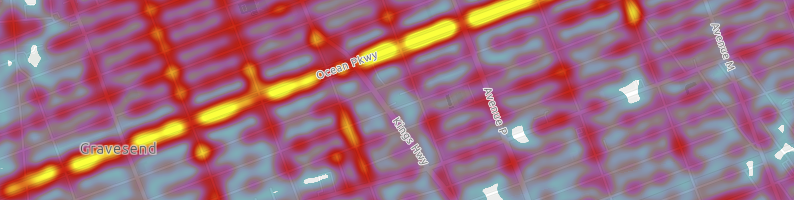 | 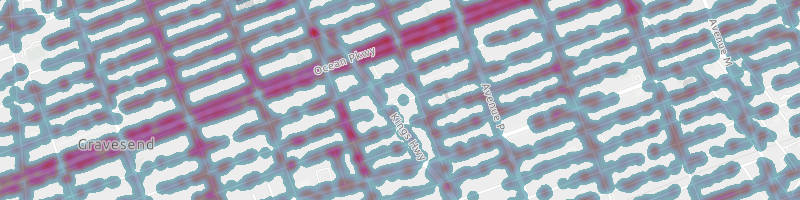 |
| reference scale | 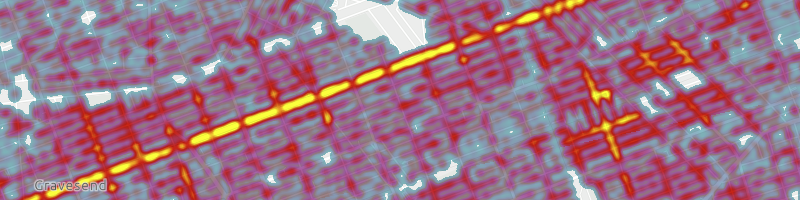 | |
| -1 LOD | 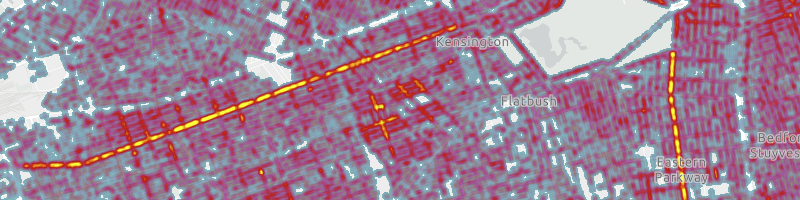 | 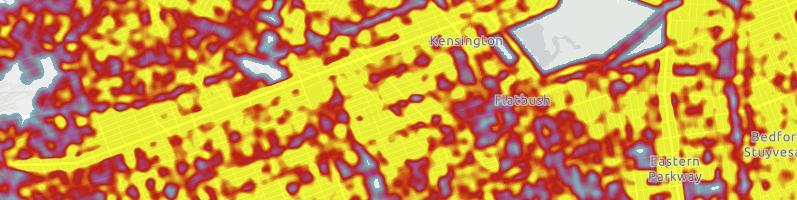 |
- See also
- Default value
- 0
Example
// locks the heatmap surface at the current view scale// so that it doesn't change as the user zooms in and outrenderer.referenceScale = view.scale; valueExpression
- Since
- ArcGIS Maps SDK for JavaScript 4.25
An Arcade expression following the specification
defined by the Arcade Visualization Profile. Expressions
in HeatmapRenderer may reference field values using the $feature profile variable and must return a number.
The values returned from this expression are used to weight the density of each heatmap point.
This property is typically used as an alternative to field for data-driven visualizations.
Known Limitations
- Only valid in 2D MapView.
- This property is not honored when persisting a HeatmapRenderer as part of WebMap.save() or WebScene.save().
Example
// expression calculating voter turnout based on two field valueslet renderer = { type: "heatmap", // autocasts as new HeatmapRenderer() valueExpression: "( $feature.TOT_VOTES / $feature.REG_VOTERS ) * 100",}; valueExpressionTitle
- Since
- ArcGIS Maps SDK for JavaScript 4.25
The title identifying and describing the Arcade
expression as defined in the valueExpression property. This is displayed
as the title of the renderer in the Legend
in the absence of a title in the legendOptions property.
Known Limitations
- Only valid in 2D MapView.
- This property is not honored when persisting a HeatmapRenderer as part of WebMap.save() or WebScene.save().
- See also
Example
renderer.valueExpression = "($feature.POP / $feature.SQ_MI) * 100";renderer.valueExpressionTitle = "Population per square mile";Methods
fromJSON
- Signature
-
fromJSON (json: any): any
Creates a new instance of this class and initializes it with values from a JSON object
generated from an ArcGIS product. The object passed into the input json
parameter often comes from a response to a query operation in the REST API or a
toJSON()
method from another ArcGIS product. See the Using fromJSON()
topic in the Guide for details and examples of when and how to use this function.
Parameters
| Parameter | Type | Description | Required |
|---|---|---|---|
| json | A JSON representation of the instance in the ArcGIS format. See the ArcGIS REST API documentation for examples of the structure of various input JSON objects. | |
- Returns
- any
Returns a new instance of this class.
clone
- Signature
-
clone (): HeatmapRenderer
Creates a deep clone of the renderer.
- Returns
- HeatmapRenderer
A deep clone of the object that invoked this method.
Example
// Creates a deep clone of the first layer's rendererlet renderer = view.map.layers.at(0).renderer.clone(); toJSON
- Signature
-
toJSON (): any
Converts an instance of this class to its ArcGIS portal JSON representation. See the Using fromJSON() guide topic for more information.
- Returns
- any
The ArcGIS portal JSON representation of an instance of this class.