import Sketch from "@arcgis/core/widgets/Sketch.js";const Sketch = await $arcgis.import("@arcgis/core/widgets/Sketch.js");- Inheritance:
- Sketch→
Widget<SketchProperties>→ Accessor
- Since
- ArcGIS Maps SDK for JavaScript 4.10
Sketch widget provides a simple UI for creating and updating graphics on a MapView or a SceneView. This significantly minimizes the code required for working with graphics in the view. It is intended to be used with graphics stored in its layer property.
By default, the Sketch widget provides out-of-the-box tools for creating and updating graphics with Point, Polyline, Polygon, rectangle and Circle geometries.
Discover the Sketch widget in MapView with this sample:
Discover the Sketch widget in SceneView with this sample:
Note that the update operations (such as rotate, move, and transform) and the creation of rectangles and circles happen in the map space. This means that, for example, if a graphic is rotated in a Web Mercator view, its shape and segment lengths change.
Pointer and keyboard gestures
Pointer and keyboard gestures for creating graphics with different geometries are described in the tables below.
Read More
General shortcuts
| Gesture | Action | Example |
|---|---|---|
| Z | Incrementally undo actions recorded in the stack. The undo/redo stack is for an individual sketch operation, meaning you can redo/undo actions while creating or updating a graphic. |  |
| R | Incrementally redo actions recorded in the stack. The undo/redo stack is for an individual sketch operation, meaning you can redo/undo actions while creating or updating a graphic. |  |
| Ctrl | Toggle snapping dependent on the configuration in snappingOptions. |  |
| Tab | While drawing or updating features, activate the tooltips' input mode to enter values or apply constraints. Depends on tooltipOptions configuration. |  |
Creating point graphics
| Gesture | Action |
|---|---|
| Left-click | Adds a point graphic at the pointer location. |
| Enter | Adds a point graphic at the pointer location. |
Creating polyline and polygon graphics
The following keyboard shortcuts apply when creating polyline and polygon graphics.
| Gesture | Action | Example |
|---|---|---|
| Left-click | Adds a vertex at the pointer location. |  |
| Left-drag | Adds a vertex for each pointer move in hybrid or freehand mode. |  |
| F | Adds a vertex to the polyline or polygon graphic. Completes the rectangle or circle polygon graphic in click mode. |  |
| Enter | Completes the polyline or polygon graphic without the staged vertex. A double-click will complete the graphic at the current mouse cursor's postion. |  |
| Spacebar+Left-drag | Pan the view while creating a polyline or polygon graphic. |  |
| Left-click on the first vertex | Completes the polygon graphic sketch. |  |
Creating polygon graphics with predefined shapes
The following keyboard shortcuts apply when creating polygon graphics with predefined shapes (rectangle and circle).
| Gesture | Action | Example |
|---|---|---|
| Left-click+Drag | Creates a rectangle graphic with dimensions based on the bounding box between initial click and cursor location. Creates a circle graphic with radius based on the distance between initial click and cursor location. |  |
| Shift+Left-click+Drag | Changes the shape from a rectangle to a square or from a circle to an ellipse. |  |
| Alt+Left-click+Drag | Creates a rectangle graphic with a center at initial click, and dimensions based on the distance between the initial click to the cursor location. Creates a circle graphic with a radius based on the bounding box between the initial click and the cursor location. |  |
| Shift+Alt+Left-click+Drag | Combines the behavior described above. |  |
Updating graphics
The Sketch widget provides users with the ability to move, rotate, scale or reshape graphics during an update operation.
To begin updating, Left-click on a graphic. Use Shift+Left-click to add more graphics to the selection, or remove graphics from the selection, for bulk updating.
Once graphics are selected, the following actions can be performed.
| Gesture | Action | Example |
|---|---|---|
| Left-click on a graphic | Select a graphic to move, rotate or scale. |  |
| Shift+Left-click graphics | Select or deselect multiple graphics to move, rotate or scale. |  |
| Drag graphic | Move the selected graphic. |  |
| Drag rotate handle | Rotate the selected graphic. |  |
| Drag scale handle | Scale the selected graphic. |  |
| Shift+Left-click+Drag scale handle | Scale the selected graphic at the center. |  |
| Z | Incrementally undo actions recorded in the stack. The undo/redo stack is for an individual sketch operation, meaning you can redo/undo actions while creating or updating a graphic. |  |
| R | Incrementally redo actions recorded in the stack. The undo/redo stack is for an individual sketch operation, meaning you can redo/undo actions while creating or updating a graphic. |  |
| Left-click on view (not the graphic) | Complete the graphic update. |  |
Press Delete key | Remove the selected graphic(s) from the layer. |  |
The following update operations can be performed on a single polyline or polygon graphic:
| Gesture | Action | Example |
|---|---|---|
| Left-click on a graphic | Select a graphic to move or reshape. |  |
| Drag graphic | Move the selected graphic. |  |
| Left-click on a ghost vertex | Add a new vertex. |  |
| Left-click on a vertex | Select a vertex. |  |
| Shift+Left-click on vertices | Select or deselect multiple vertices. |  |
| Drag vertex | Move the selected vertex or vertices. |  |
| Right-click on a vertex | Delete a vertex. |  |
Select multiple vertices and press Backspace or Delete key | Delete multiple vertices. |  |
The following update operations can be performed on a single graphic with point geometry in a SceneView, if the graphic uses a 3D object symbol layer:
| Gesture | Action | Example |
|---|---|---|
| Left-click on a graphic | Select a graphic to move, rotate or scale. |  |
| Drag inner handle | Move the selected graphic. |  |
| Drag height handle | Move the selected graphic vertically (on the z axis). |  |
| Drag outer handle sideways | Rotate the selected graphic. |  |
| Drag outer handle inwards or outwards | Scale the selected graphic. |  |
Sketch 3D
To be able to manipulate features on the z-axis using the height handle, the following configurations are relevant:
- Elevation info mode of the
GraphicsLayer needs to be set to
absolute-height,relative-to-sceneorrelative-to-ground. - To create a graphic with z-value the
hasZneeds to betruein defaultCreateOptions and/or in the createOptions. - To update the z-value of a graphic the
enableZneeds to betruein defaultUpdateOptions and/or in the updateOptions.
// define the GraphicsLayerconst gLayer = new GraphicsLayer({  elevationInfo: {    mode: "absolute-height" // default value  }});
// define the SketchViewModelconst sketchVM = new SketchViewModel({  layer: gLayer,  view: view,  defaultCreateOptions: {    hasZ: true  // default value  },  defaultUpdateOptions: {    enableZ: true  // default value  }});
In absolute-height elevation mode, the sketched vertices snap to scene elements (features and ground).
See elevation info for more information on how z-values are used with different elevation modes.
When sketching polygons or polylines, the elevation constraint is applied by default. This means that all the vertices use the
z-value of the first vertex. To unlock the elevation constraint while sketching, enable the tooltips
in the widget's "Settings" menu and press Tab to activate the input mode while drawing or updating a feature.
Note that in elevation modes other than absolute-height the z-values are fixed but the graphic may appear non-planar because of the elevation alignment applied to the vertices.
See more about available tooltip inputs and constraints under the tooltip options class.
Known Limitation
Multipoint geometry can only be created in a MapView.
Example
// Create a new instance of sketch widget and set its required parameterslet sketch = new Sketch({  layer: graphicsLayer,  view: view});
// Listen to sketch widget's create event.sketch.on("create", function(event) {  // check if the create event's state has changed to complete indicating  // the graphic create operation is completed.  if (event.state === "complete") {    // remove the graphic from the layer. Sketch adds    // the completed graphic to the layer by default.    graphicsLayer.remove(event.graphic);
    // use the graphic.geometry to query features that intersect it    selectFeatures(event.graphic.geometry);  }});
Constructors
Constructor
Parameters
| Parameter | Type | Description | Required |
|---|---|---|---|
| properties | | |
Example
// typical usagelet sketch = new Sketch({ layer: layer, view: view});Properties
| Property | Type | Class |
|---|---|---|
activeTool readonly | | |
activeTooltip readonly | SketchViewModel["activeTooltip"] | null | |
CreateTool[] | null | undefined | | |
container inherited | HTMLElement | null | undefined | |
createGraphic readonly | | |
| | ||
declaredClass readonly inherited | ||
| | ||
| | ||
destroyed readonly inherited | ||
Icon["icon"] | | |
id inherited | ||
isUsingLegacyCreateTools deprecated readonly | | |
| | ||
| | ||
| | ||
| | ||
| | ||
| | ||
| | ||
"s" | "m" | "l" | | |
| | ||
state readonly | | |
| | ||
| | ||
| | ||
updateGraphics readonly | | |
useLegacyCreateTools deprecated | | |
| | ||
| | ||
| | ||
visible inherited | ||
| |
activeTool
- Type
- SketchTool | SelectionTool | null
When creating new graphics (for example after create() has been called),
this property reflects the create tool being used. When updating graphics
(for example after update() has been called), this property reflects the
update tool being used. If no create or update operation is in progress, this is null.
Prior to 4.32, creation tools were modeled as a combination of a geometry type (point, line, polygon) and an interaction mode (click, freehand, hybrid). At 4.32, the available create tools were expanded to include "freehandPolyline" and "freehandPolygon". These tools are made available to enable interoperability with other components of the ArcGIS system, where freehand polyline is a distinct create tool from polyline.
To minimize compatibility issues, if "freehandPolyline" and "freehandPolygon" are not in the list of available create tools, they will not be returned by this property, even if the user is drawing a polygon in freehand mode.
To opt in to freehandPolyline and freehandPolygon tools, include them when setting availableCreateTools, and visibleElements.createTools.
activeTooltip
- Type
- SketchViewModel["activeTooltip"] | null
- Since
- ArcGIS Maps SDK for JavaScript 4.31
The tooltip currently being displayed for the SketchViewModel.activeTool.
availableCreateTools
- Type
- CreateTool[] | null | undefined
- Since
- ArcGIS Maps SDK for JavaScript 4.12
Property controlling the visibility and order of create tool buttons.
- Default value
- ["point", "polyline", "polygon", "rectangle", "circle"]
container
- Type
- HTMLElement | null | undefined
The ID or node representing the DOM element containing the widget. This property can only be set once. The following examples are all valid use case when working with widgets.
Examples
// Create the HTML div element programmatically at runtime and set to the widget's containerconst basemapGallery = new BasemapGallery({  view: view,  container: document.createElement("div")});
// Add the widget to the top-right corner of the viewview.ui.add(basemapGallery, {  position: "top-right"});
// Specify an already-defined HTML div element in the widget's container
const basemapGallery = new BasemapGallery({ view: view, container: basemapGalleryDiv});
// Add the widget to the top-right corner of the viewview.ui.add(basemapGallery, { position: "top-right"});
// HTML markup<body> <div id="viewDiv"></div> <div id="basemapGalleryDiv"></div></body>// Specify the widget while adding to the view's UIconst basemapGallery = new BasemapGallery({ view: view});
// Add the widget to the top-right corner of the viewview.ui.add(basemapGallery, { position: "top-right"}); creationMode
- Type
- CreationMode
- Since
- ArcGIS Maps SDK for JavaScript 4.14
Defines the default behavior once the create() operation is completed. By default, the user will be able to continuously create graphics with same geometry types.
Possible Values
| Value | Description |
|---|---|
| continuous | This is the default. Users can continue creating graphics with same geometry types. |
| single | User can create a single graphic with the specified geometry type. User must choose an operation once the graphic is created. |
| update | The graphic will be selected for an update() operation once the create operation is completed. |
- Default value
- "continuous"
defaultCreateOptions
- Type
- CreateOptions
- Since
- ArcGIS Maps SDK for JavaScript 4.14
Default create options set for the Sketch widget.
defaultUpdateOptions
- Type
- UpdateOptions
- Since
- ArcGIS Maps SDK for JavaScript 4.11
Default update options set for the Sketch widget. Update options set on this property will be overwritten if the update options are changed when update() method is called.
Example
// Turn off highlights for update operationsconst sketch = new Sketch({ view, defaultUpdateOptions: { highlightOptions: { enabled: false } }});// Turn off highlights from the update() methodconst updateOptions = { tool: "reshape", highlightOptions: { enabled: false }};sketch.update(graphic, updateOptions); icon
- Type
- Icon["icon"]
- Since
- ArcGIS Maps SDK for JavaScript 4.27
Icon which represents the widget. It is typically used when the widget is controlled by another one (e.g. in the Expand widget).
- Default value
- "pencil"
isUsingLegacyCreateTools
- Type
- boolean
- Since
- ArcGIS Maps SDK for JavaScript 5.0
Use this property to determine if the next generation geometry creation
has been disabled. This can happen when
useLegacyCreateTools is true,
or arcgis-sketch is used with a non-2D (arcgis-map) view.
- Default value
- false
labelOptions
- Type
- SketchLabelOptions
- Since
- ArcGIS Maps SDK for JavaScript 4.24
Options to configure the sketch labels shown next to each segment of the geometry being created or updated.
Known Limitation
Sketch labels are currently only supported when working with a SceneView.
layer
- Type
- GraphicsLayer | MapNotesLayer | null | undefined
The GraphicsLayer associated with the Sketch widget. The Sketch widget adds new graphics to this layer or can only update graphics stored in this layer.
layout
- Type
- Layout
Determines the layout/orientation of the Sketch widget.
- Default value
- "horizontal"
pointSymbol
- Type
- SketchPointSymbol
A SimpleMarkerSymbol, PictureMarkerSymbol, PointSymbol3D, TextSymbol, CIMSymbol, or WebStyleSymbol used for representing the point geometry that is being drawn. SimpleMarkerSymbol may also be used to symbolize point features in a SceneView. However, it is recommended you use PointSymbol3D instead.
Known Limitation To avoid unintended side effects, instantiate a new symbol rather than modifying the current instance.
The default value is the following:
{ type: "simple-marker", style: "circle", size: 6, color: [255, 255, 255], outline: { color: [50, 50, 50], width: 1 }} polygonSymbol
- Type
- SketchPolygonSymbol
A SimpleFillSymbol, PolygonSymbol3D, or CIMSymbol used for representing the polygon geometry that is being drawn. SimpleFillSymbol may also be used to symbolize polygon features in a SceneView. However, it is recommended you use PolygonSymbol3D instead.
Known Limitation To avoid unintended side effects, instantiate a new symbol rather than modifying the current instance.
The default value is the following:
{ type: "simple-fill", color: [150, 150, 150, 0.2], outline: { color: [50, 50, 50], width: 2 }} polylineSymbol
- Type
- SketchPolylineSymbol
A SimpleLineSymbol, LineSymbol3D, or CIMSymbol used for representing the polyline geometry that is being drawn. SimpleLineSymbol may also be used to symbolize polyline features in a SceneView. However, it is recommended you use LineSymbol3D instead.
Known Limitation To avoid unintended side effects, instantiate a new symbol rather than modifying the current instance.
The default value is the following:
{ type: "simple-line", color: [130, 130, 130], width: 2} snappingOptions
- Type
- SnappingOptions
The SnappingOptions for sketching. It supports self and feature snapping.
textSymbol
- Type
- TextSymbol
A TextSymbol used when creating features with the 'text' tool.
toolbarKind
- Type
- ToolbarKind
- Since
- ArcGIS Maps SDK for JavaScript 4.32
Controls the appearance of the sketch widget, allowing the toolbar to adapt its appearance appropriately based on context. Use 'docked' when the Sketch widget is embedded in another UI component like a panel; in this view, the widget stretches to fill available space.
"floating" appearance is optimized for situations where the Sketch widget is "floating" on top of the map. This appearance has a drop shadow, rounded corners, and dynamic layout that works well on a map or scene.
Subject to change, Sketch uses Calcite Action Pad in "floating" mode, and Calcite Action Bar in docked mode.
In both modes, Sketch will expand to fill available width, then collapse overflowing items into split-button or overflow menu groups as appropriate. In docked mode, Sketch expands to the width (in horizontal layout) or height (in vertical layout) of the nearest ancestor.
- Default value
- "floating"
tooltipOptions
- Type
- SketchTooltipOptions
- Since
- ArcGIS Maps SDK for JavaScript 4.24
Options to configure the tooltip shown next to the cursor when creating or updating graphics.
updateGraphics
- Type
- Collection<Graphic>
An array of graphics that are being updated by the Sketch widget.
useLegacyCreateTools
- Type
- boolean
- Since
- ArcGIS Maps SDK for JavaScript 5.0
Starting with 5.0, arcgis-sketch and SketchViewModel
ara transitioning to a next generation geometry creation experience. This
new experience enables the use of advanced curve creation tools and the
combination of multiple create tools to define a single geometry.
As of 5.0, this experience is only available in 2D (e.g., MapView, arcgis-map).
This property is available to allow 2D applications to temporarily opt out of this experience.
This option will be removed in an upcoming release.
valueOptions
- Type
- SketchValueOptions
- Since
- ArcGIS Maps SDK for JavaScript 4.29
Options to configure how values are displayed and input when creating or updating graphics.
view
- Type
- MapViewOrSceneView | null | undefined
viewModel
- Type
- SketchViewModel
The view model for the Sketch widget. This is a class that contains all the logic (properties and methods) that controls this widget's behavior. See the SketchViewModel class to access all properties and methods on the Sketch widget.
visible
- Type
- boolean
Indicates whether the widget is visible.
If false, the widget will no longer be rendered in the web document. This may affect the layout of other elements or widgets in the document. For example, if this widget is
the first of three widgets associated to the upper right hand corner of the DefaultUI, then the other widgets will reposition when this widget is made invisible.
For more information, refer to the css display value of "none".
- Default value
- true
Example
// Hides the widget in the viewwidget.visible = false; visibleElements
- Type
- VisibleElements
The visible elements that are displayed within the widget. This property provides the ability to turn individual elements of the widget's display on/off.
The image below displays the default Sketch widget with selection, undo/redo, and settings menu tools.
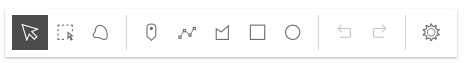
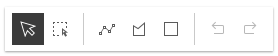
In comparison, this image shows how the widget displays with some of its tools not visible as set in the example code snippet below.
Example
// Setting the sketch's visible elements as below would result// in removing the point and circle tools. It also removes the// lasso-selection tool and settings menu.sketch.visibleElements = { createTools: { point: false, circle: false }, selectionTools:{ "lasso-selection": false }, settingsMenu: false}Methods
| Method | Signature | Class |
|---|---|---|
cancel(): void | | |
classes inherited | classes(...classNames: ((string | null | undefined) | ((string[] | Record<string, boolean>) | null | undefined) | false | null | undefined)[]): string | |
complete(): void | | |
create(tool: CreateTool, createOptions?: CreateOptions | null): Promise<void> | | |
delete(): void | | |
destroy inherited | destroy(): void | |
duplicate(): Graphic[] | | |
emit inherited | emit<Type extends EventNames<this>>(type: Type, event?: this["@eventTypes"][Type]): boolean | |
hasEventListener inherited | hasEventListener<Type extends EventNames<this>>(type: Type): boolean | |
isFulfilled inherited | isFulfilled(): boolean | |
isRejected inherited | isRejected(): boolean | |
isResolved inherited | isResolved(): boolean | |
on inherited | on<Type extends EventNames<this>>(type: Type, listener: EventedCallback<this["@eventTypes"][Type]>): ResourceHandle | |
postInitialize inherited | postInitialize(): void | |
redo(): void | | |
render inherited | render(): any | null | |
renderNow inherited | renderNow(): void | |
scheduleRender inherited | scheduleRender(): void | |
undo(): void | | |
update(graphics: Graphic | Graphic[], updateOptions?: UpdateOptions): Promise<void> | | |
when inherited | when<TResult1 = this, TResult2 = never>(onFulfilled?: OnFulfilledCallback<this, TResult1> | null | undefined, onRejected?: OnRejectedCallback<TResult2> | null | undefined): Promise<TResult1 | TResult2> |
classes
- Signature
-
classes (...classNames: ((string | null | undefined) | ((string[] | Record<string, boolean>) | null | undefined) | false | null | undefined)[]): string
A utility method used for building the value for a widget's class property.
This aids in simplifying css class setup.
Parameters
- Returns
- string
The computed class name.
Example
// .tsx syntax showing how to set css classes while rendering the widget
render() {  const dynamicClasses = {    [css.flip]: this.flip,    [css.primary]: this.primary  };
return ( <div class={classes(css.root, css.mixin, dynamicClasses)} /> );} create
- Signature
-
create (tool: CreateTool, createOptions?: CreateOptions | null): Promise<void>
Create a graphic with the geometry specified in the tool parameter. When the first vertex of the graphic is added,
the @create event will start firing. The provided tool will become the activeTool.
Parameters
| Parameter | Type | Description | Required |
|---|---|---|---|
| tool | Name of the create tool. Specifies the geometry for the graphic to be created. | | |
| createOptions | Options for the graphic to be created. | |
Example
// Call create method to create a polygon with freehand mode.sketch.create("polygon", { mode: "freehand" });
// listen to create event, only respond when event's state changes to completesketch.on("create", function(event) {  if (event.state === "complete") {    // remove the graphic from the layer associated with the Sketch widget    // instead use the polygon that user created to query features that    // intersect it.    polygonGraphicsLayer.remove(event.graphic);    selectFeatures(event.graphic.geometry);  }});
// create a squaresketch.create("rectangle", { preserveAspectRatio: true });
// create an ellipsesketch.create("circle", { preserveAspectRatio: false }); duplicate
- Signature
-
duplicate (): Graphic[]
- Since
- ArcGIS Maps SDK for JavaScript 4.26
Duplicates current graphics used in the update workflow and automatically adds them to the associated layer
- Returns
- Graphic[]
emit
- Signature
-
emit <Type extends EventNames<this>>(type: Type, event?: this["@eventTypes"][Type]): boolean
- Type parameters
- <Type extends EventNames<this>>
Emits an event on the instance. This method should only be used when creating subclasses of this class.
hasEventListener
- Signature
-
hasEventListener <Type extends EventNames<this>>(type: Type): boolean
- Type parameters
- <Type extends EventNames<this>>
Indicates whether there is an event listener on the instance that matches the provided event name.
Parameters
| Parameter | Type | Description | Required |
|---|---|---|---|
| type | Type | The name of the event. | |
- Returns
- boolean
Returns true if the class supports the input event.
isFulfilled
- Signature
-
isFulfilled (): boolean
isFulfilled() may be used to verify if creating an instance of the class is fulfilled (either resolved or rejected).
If it is fulfilled, true will be returned.
- Returns
- boolean
Indicates whether creating an instance of the class has been fulfilled (either resolved or rejected).
isRejected
- Signature
-
isRejected (): boolean
isRejected() may be used to verify if creating an instance of the class is rejected.
If it is rejected, true will be returned.
- Returns
- boolean
Indicates whether creating an instance of the class has been rejected.
isResolved
- Signature
-
isResolved (): boolean
isResolved() may be used to verify if creating an instance of the class is resolved.
If it is resolved, true will be returned.
- Returns
- boolean
Indicates whether creating an instance of the class has been resolved.
on
- Signature
-
on <Type extends EventNames<this>>(type: Type, listener: EventedCallback<this["@eventTypes"][Type]>): ResourceHandle
- Type parameters
- <Type extends EventNames<this>>
Registers an event handler on the instance. Call this method to hook an event with a listener.
Parameters
| Parameter | Type | Description | Required |
|---|---|---|---|
| type | Type | An event or an array of events to listen for. | |
| listener | EventedCallback<this["@eventTypes"][Type]> | The function to call when the event fires. | |
- Returns
- ResourceHandle
Returns an event handler with a
remove()method that should be called to stop listening for the event(s).Property Type Description remove Function When called, removes the listener from the event.
Example
view.on("click", function(event){ // event is the event handle returned after the event fires. console.log(event.mapPoint);}); update
- Signature
-
update (graphics: Graphic | Graphic[], updateOptions?: UpdateOptions): Promise<void>
Initializes an update operation for the specified graphic(s) and fires @update event.
Parameters
| Parameter | Type | Description | Required |
|---|---|---|---|
| graphics | A graphic or an array of graphics to be updated. Only graphics added to SketchViewModel's layer property can be updated. | | |
| updateOptions | Update options for the graphics to be updated. | |
Examples
// start update operation for the selected graphic// with transform tool. Only allow uniform scaling operation.sketch.update([selectedGraphic], { tool: "transform", enableRotation: false, enableScaling: true, preserveAspectRatio: true, toggleToolOnClick: false});// Listen to sketch's update event to validate graphic's// location while it is being reshaped or movedsketch.on("update", onGraphicUpdate);function onGraphicUpdate(event) { // get the graphic as it is being updated const graphic = event.graphics[0]; // check if the graphic is intersecting school buffers intersects = geometryEngine.intersects(buffers, graphic.geometry);
// change the graphic symbol to valid or invalid symbol // depending the graphic location graphic.symbol = (intersects) ? invalidSymbol : validSymbol
// check if the update event's the toolEventInfo.type is move-stop or reshape-stop // user finished moving or reshaping the graphic, call complete method. // This changes update event state to complete. const toolType = event.toolEventInfo.type; if (event.toolEventInfo && (toolType === "move-stop" || toolType === "reshape-stop")) { if (!intersects) { sketch.complete(); } } else if (event.state === "complete") { // graphic update has been completed // if the graphic is in a bad spot, call sketch's update method again // giving user a chance to correct the location of the graphic if ((!contains) || (intersects)) { sketch.update([graphic], { tool: "reshape", toggleToolOnClick: false }); } }} when
- Signature
-
when <TResult1 = this, TResult2 = never>(onFulfilled?: OnFulfilledCallback<this, TResult1> | null | undefined, onRejected?: OnRejectedCallback<TResult2> | null | undefined): Promise<TResult1 | TResult2>
when() may be leveraged once an instance of the class is created. This method takes two input parameters: an onFulfilled function and an onRejected function.
The onFulfilled executes when the instance of the class loads. The
onRejected executes if the instance of the class fails to load.
Parameters
| Parameter | Type | Description | Required |
|---|---|---|---|
| onFulfilled | OnFulfilledCallback<this, TResult1> | null | undefined | The function to call when the promise resolves. | |
| onRejected | The function to execute when the promise fails. | |
- Returns
- Promise<TResult1 | TResult2>
Returns a new promise for the result of
onFulfilledthat may be used to chain additional functions.
Example
// Although this example uses MapView, any class instance that is a promise may use when() in the same waylet view = new MapView();view.when(function(){ // This function will execute once the promise is resolved}, function(error){ // This function will execute if the promise is rejected due to an error});Events
create
create: CustomEvent<CreateEvent> Fires when a user starts sketching a graphic, is actively sketching a graphic and completes sketching a graphic.
Example
// Listen to sketch widget's create event.sketch.on("create", function(event) {  // check if the create event's state has changed to complete indicating  // the graphic create operation is completed.  if (event.state === "complete") {    // remove the graphic from the layer. Sketch adds    // the completed graphic to the layer by default.    polygonGraphicsLayer.remove(event.graphic);
    // use the graphic.geometry to query features that intersect it    selectFeatures(event.graphic.geometry);  }});
delete
delete: CustomEvent<DeleteEvent> - Since
- ArcGIS Maps SDK for JavaScript 4.14
Fires when a user deletes selected graphics by clicking the Delete feature button on the Sketch widget
or when Sketch.delete() method is called.
Example
// selected graphics can be deleted only when update event becomes activesketch.on("update", function(event) {  if (event.state === "active") {    sketch.delete();  }});
// fires after delete method is called// returns references to deleted graphics.sketch.on("delete", function(event) {  event.graphics.forEach(function(graphic){    console.log("deleted", graphic)  });});
redo
redo: CustomEvent<RedoEvent> Fires in response to redo action during creation of a new graphic or updating existing graphics. The undo/redo stack is for an individual sketch operation, meaning you can redo/undo actions while creating or updating a graphic.
undo
undo: CustomEvent<UndoEvent> Fires in response to undo action during creation of a new graphic or updating existing graphics. The undo/redo stack is for an individual sketch operation, meaning you can redo/undo actions while creating or updating a graphic.
update
update: CustomEvent<UpdateEvent> Fires when the user starts updating graphics, is actively updating graphics, and completes updating graphics.
Example
// Listen to sketch's update event to show relevant data in a chart// as the graphics are being movedsketch.on("update", onMove);
// Point graphics at the center and edge of the buffer polygon are being moved.// Recalculate the buffer with updated geometry and run the query stats using// the updated buffer and update the chart.function onMove(event) {  // If the edge graphic is moving, keep the center graphic  // at its initial location. Only move edge graphic to resize the buffer.  if (event.toolEventInfo && event.toolEventInfo.mover.attributes.edge) {    const toolType = event.toolEventInfo.type;    if (toolType === "move-start") {      centerGeometryAtStart = centerGraphic.geometry;    }    // keep the center graphic at its initial location when edge point is moving    else if (toolType === "move" || toolType === "move-stop") {      centerGraphic.geometry = centerGeometryAtStart;    }  }
  // the center or edge graphic is being moved, recalculate the buffer  const vertices = [    [centerGraphic.geometry.x, centerGraphic.geometry.y],    [edgeGraphic.geometry.x, edgeGraphic.geometry.y]  ];
  // client-side stats query of features that intersect the buffer  calculateBuffer(vertices);
  // user is clicking on the view... call update method with the center and edge graphics  if (event.state === "complete") {    sketch.update([edgeGraphic, centerGraphic], { tool: "move" });  }}