import SketchViewModel from "@arcgis/core/widgets/Sketch/SketchViewModel.js";const SketchViewModel = await $arcgis.import("@arcgis/core/widgets/Sketch/SketchViewModel.js");- Inheritance:
- SketchViewModel→
Accessor
- Since
- ArcGIS Maps SDK for JavaScript 4.5
Overview
Provides the logic for the Sketch widget and component. The SketchViewModel is intended to be used with Graphics and requires a GraphicsLayer to be specified in its layer property. The Sketch widget provides out-of-the box functionality with a user interface (UI). Therefore, the Sketch widget allows users to not worry about designing and creating their own UI. On the other hand, the SketchViewModel is the logic behind the Sketch widget UI, allowing users who utilize this class in their applications to design their own custom UI for the draw tools.
For example, the sample Filter SceneLayer with FeatureFilter demonstrates an example of utilizing the SketchViewModel with a custom UI.
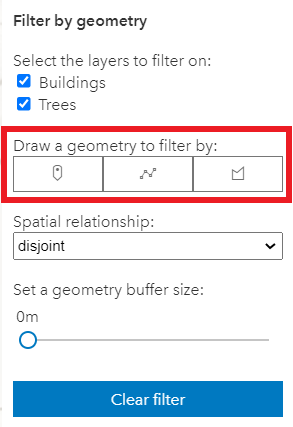
Additionally, users can pick and choose which draw tools are relevant to their applications. In this example, only the point, polyline, and polygon tools are used.
Pointer and keyboard gestures
Pointer and keyboard gestures for creating graphics with different geometries are described in the tables below.
Read More
General shortcuts
| Gesture | Action | Example |
|---|---|---|
| Z | Incrementally undo actions recorded in the stack. The undo/redo stack is for an individual sketch operation, meaning you can redo/undo actions while creating or updating a graphic. | 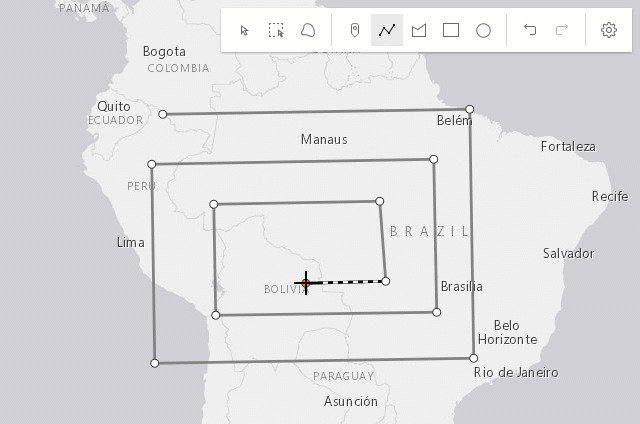 |
| R | Incrementally redo actions recorded in the stack. The undo/redo stack is for an individual sketch operation, meaning you can redo/undo actions while creating or updating a graphic. | 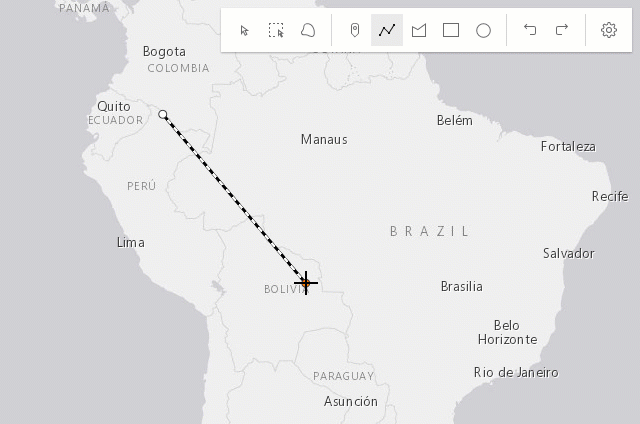 |
| Ctrl | Toggle snapping dependent on the configuration in snappingOptions. | 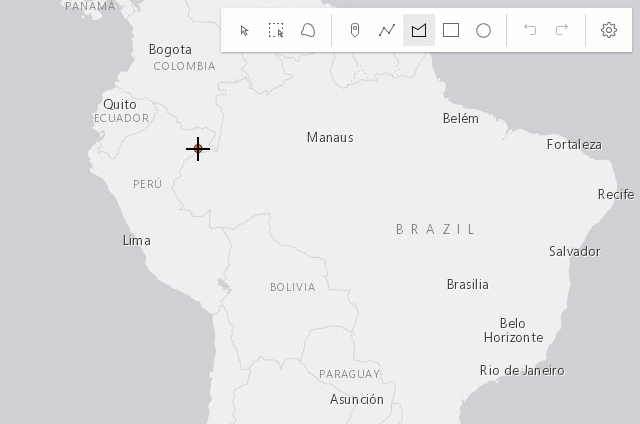 |
| Tab | While drawing or updating features, activate the tooltips' input mode to enter values or apply constraints. Depends on tooltipOptions configuration. | 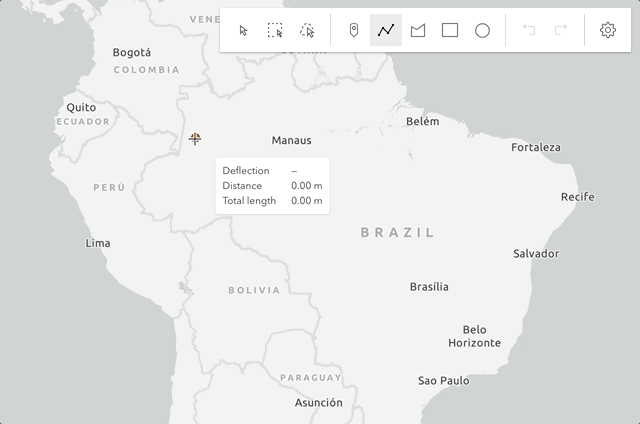 |
Creating point graphics
| Gesture | Action |
|---|---|
| Left-click | Adds a point graphic at the pointer location. |
| Enter | Adds a point graphic at the pointer location. |
Creating polyline and polygon graphics
The following keyboard shortcuts apply when creating polyline and polygon graphics.
| Gesture | Action | Example |
|---|---|---|
| Left-click | Adds a vertex at the pointer location. |  |
| Left-drag | Adds a vertex for each pointer move in hybrid or freehand mode. |  |
| F | Adds a vertex to the polyline or polygon graphic. Completes the rectangle or circle polygon graphic in click mode. |  |
| Enter | Completes the polyline or polygon graphic without the staged vertex. A double-click will complete the graphic at the current mouse cursor's position. |  |
| Spacebar+Left-drag | Pan the view while creating a polyline or polygon graphic. |  |
| Left-click on the first vertex | Completes the polygon graphic sketch. |  |
Creating polygon graphics with predefined shapes
The following keyboard shortcuts apply when creating polygon graphics with predefined shapes (rectangle and circle).
| Gesture | Action | Example |
|---|---|---|
| Left-click+Drag | Creates a rectangle graphic with dimensions based on the bounding box between initial click and cursor location. Creates a circle graphic with radius based on the distance between initial click and cursor location. |  |
| Shift+Left-click+Drag | Changes the shape from a rectangle to a square or from a circle to an ellipse. |  |
| Alt+Left-click+Drag | Creates a rectangle graphic with a center at initial click, and dimensions based on the distance between the initial click to the cursor location. Creates a circle graphic with a radius based on the bounding box between the initial click and the cursor location. | 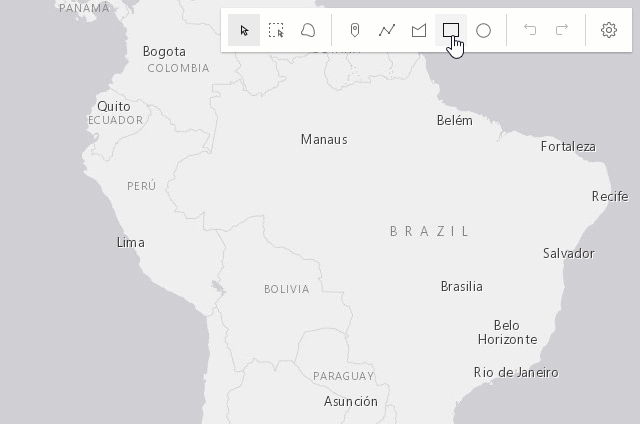 |
| Shift+Alt+Left-click+Drag | Combines the behavior described above. | 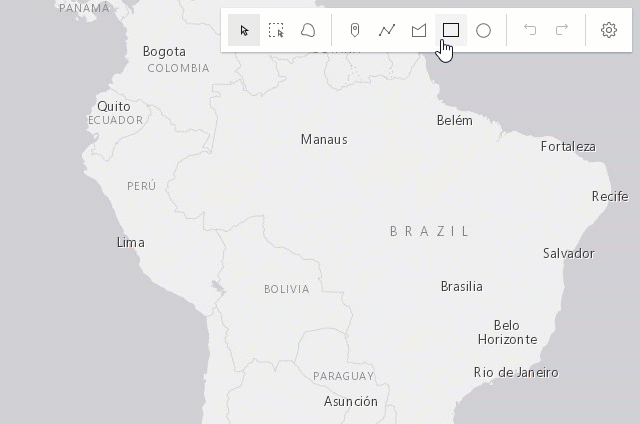 |
Updating graphics
The Sketch widget provides users with the ability to move, rotate, scale or reshape graphics during an update operation.
To begin updating, Left-click on a graphic. Use Shift+Left-click to add more graphics to the selection, for bulk updating.
Once graphics are selected, the following actions can be performed.
| Gesture | Action | Example |
|---|---|---|
| Left-click on a graphic | Select a graphic to move, rotate or scale. | 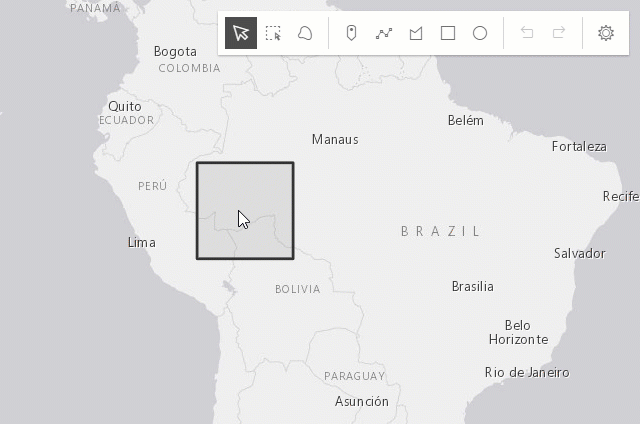 |
| Shift+Left-click graphics | Select multiple graphics to move, rotate or scale. | 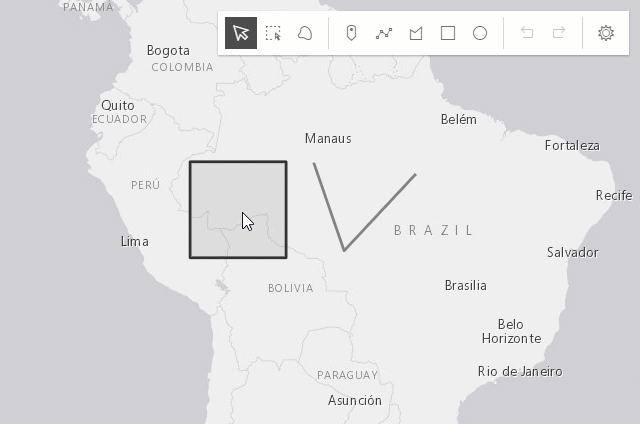 |
| Drag graphic | Move the selected graphic. |  |
| Drag rotate handle | Rotate the selected graphic. | 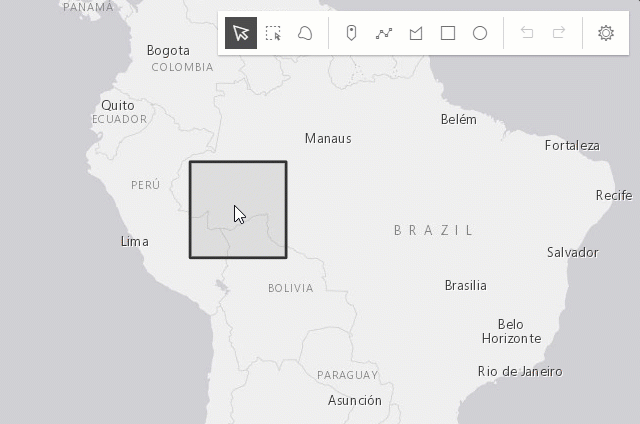 |
| Drag scale handle | Scale the selected graphic. |  |
| Shift+Left-click+Drag scale handle | Scale the selected graphic at the center. |  |
| Z | Incrementally undo actions recorded in the stack. The undo/redo stack is for an individual sketch operation, meaning you can redo/undo actions while creating or updating a graphic. | 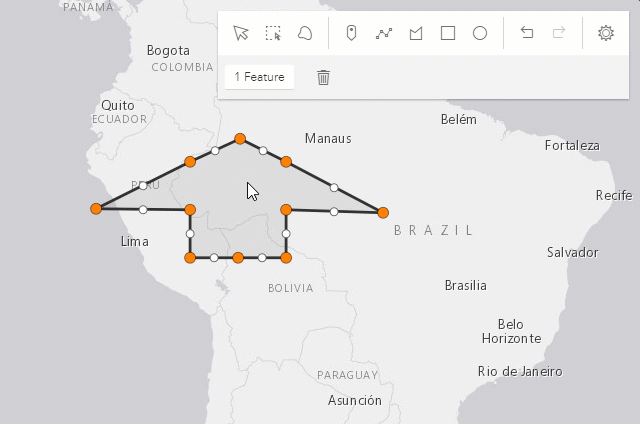 |
| R | Incrementally redo actions recorded in the stack. The undo/redo stack is for an individual sketch operation, meaning you can redo/undo actions while creating or updating a graphic. | 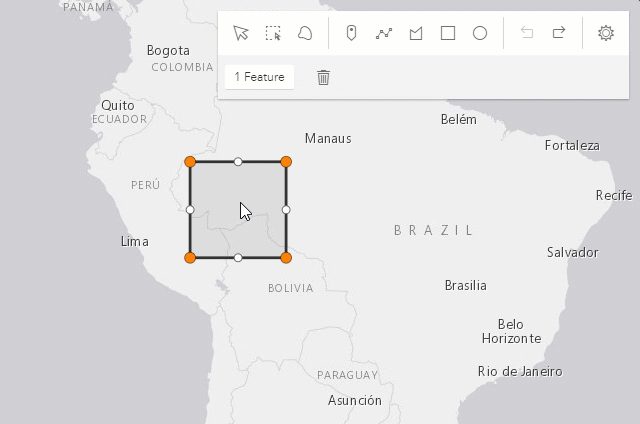 |
| Left-click on view (not the graphic) | Complete the graphic update. |  |
Press Delete key | Remove the selected graphic(s) from the layer. | 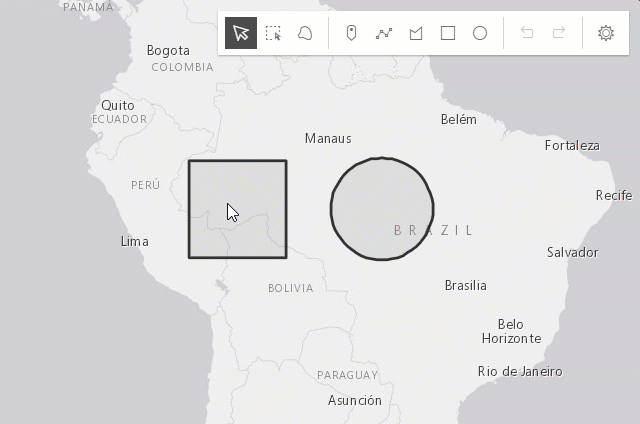 |
The following update operations can be performed on a single polyline or polygon graphic:
| Gesture | Action | Example |
|---|---|---|
| Left-click on a graphic | Select a graphic to move or reshape. |  |
| Drag graphic | Move the selected graphic. | 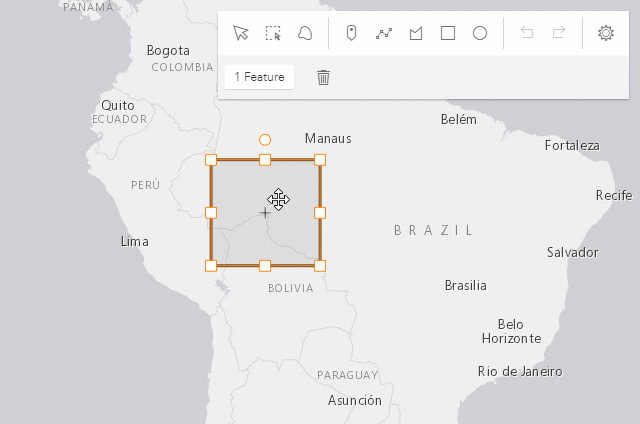 |
| Left-click on a ghost vertex | Add a new vertex. |  |
| Left-click on a vertex | Select a vertex. | 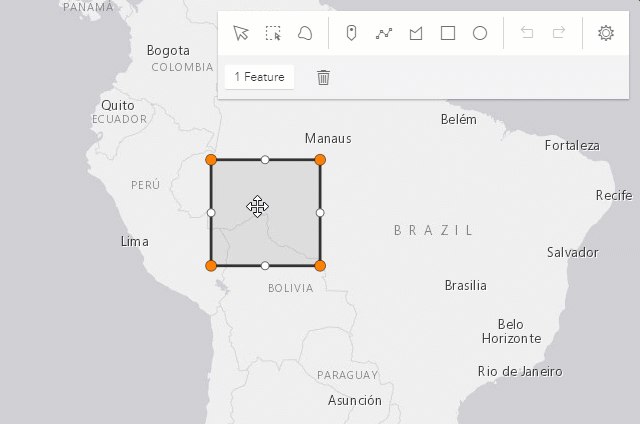 |
| Shift+Left-click on vertices | Select or unselect multiple vertices. | 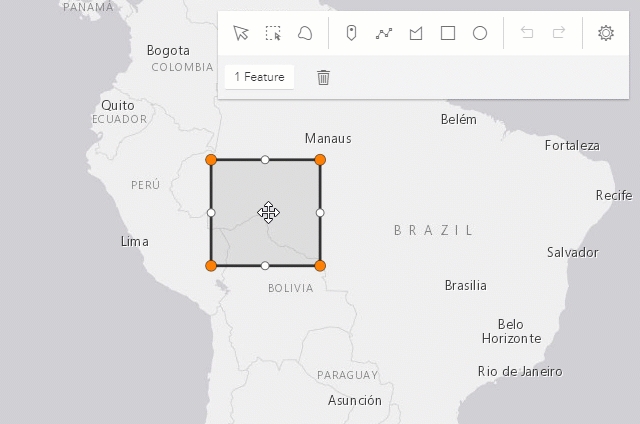 |
| Drag vertex | Move the selected vertex or vertices. | 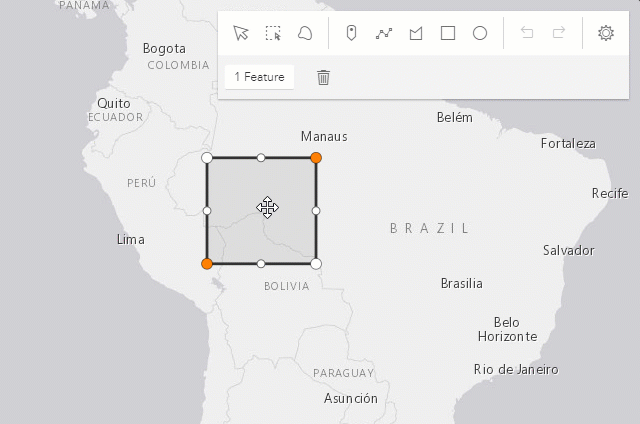 |
| Right-click on a vertex | Delete a vertex. | 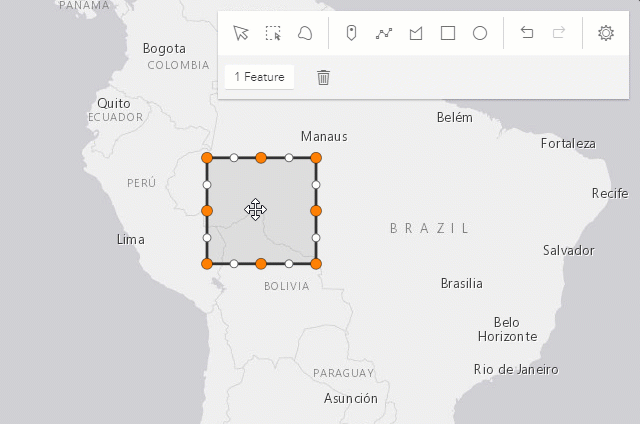 |
Select multiple vertices and press Backspace or Delete key | Delete multiple vertices. |  |
The following update operations can be performed on a single graphic with point geometry in a SceneView, if the graphic uses a 3D object symbol layer:
| Gesture | Action | Example |
|---|---|---|
| Left-click on a graphic | Select a graphic to move, rotate or scale. | 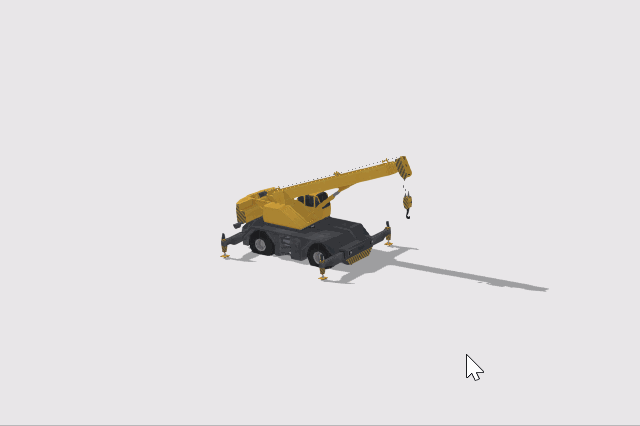 |
| Drag inner handle | Move the selected graphic. | 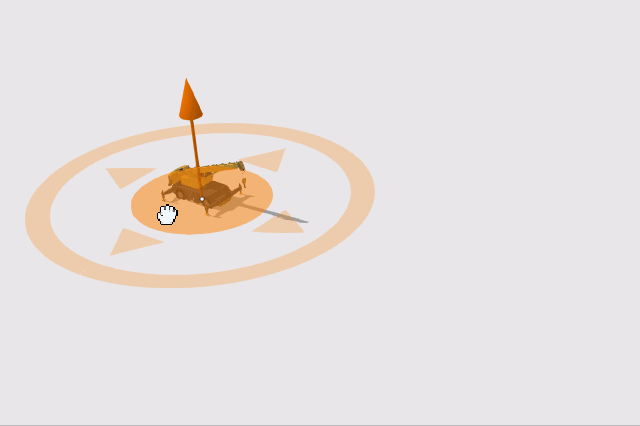 |
| Drag height handle | Move the selected graphic vertically (on the z axis). | 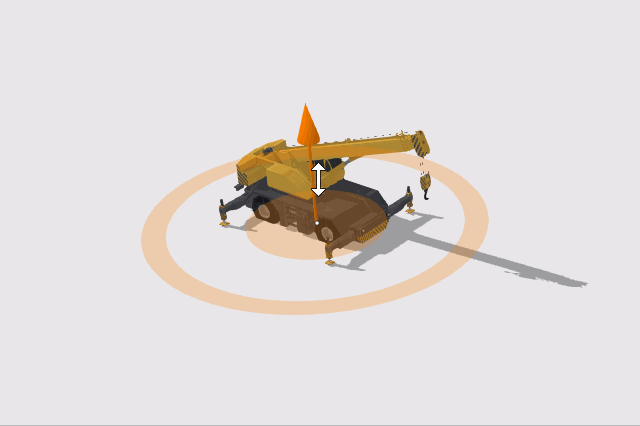 |
| Drag outer handle sideways | Rotate the selected graphic. | 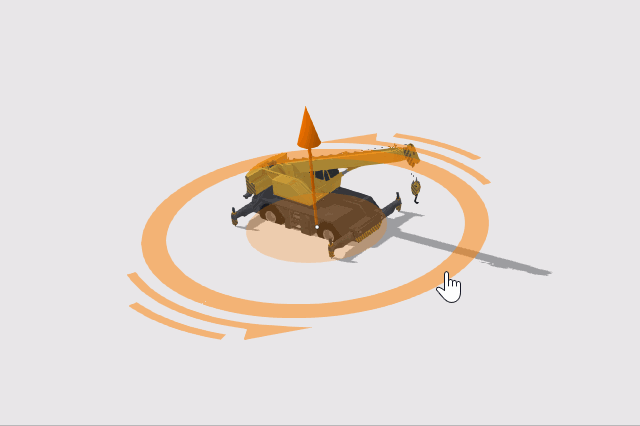 |
| Drag outer handle inwards or outwards | Scale the selected graphic. | 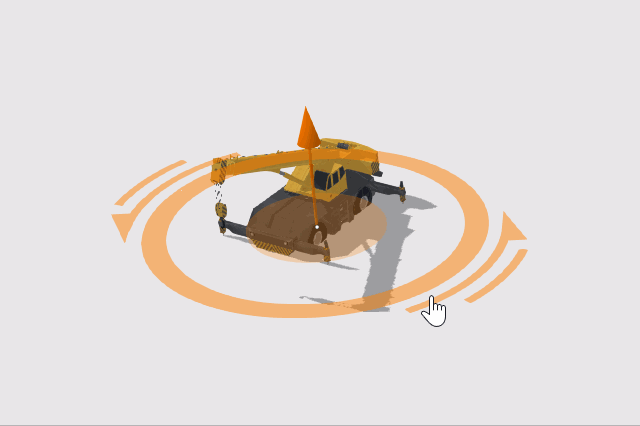 |
Overriding Symbology
The SketchViewModel also allows users to override the default symbology for polyline, polygon, point, and multipoint graphics.
The following code snippet demonstrates an example of utilizing TextSymbols to override the default point graphic symbology.
// Create a text symbol for drawing the pointconst textKeySymbol = {  type: "text", // autocasts as new TextSymbol()  color: "#7a003c",  text: "\ue656", // esri-icon-key  font: {    // autocasts as new Font()    size: 20,    family: "CalciteWebCoreIcons"  }};
const sketchViewModel = new SketchViewModel({  view: view,  layer: graphicsLayer,  pointSymbol: textKeySymbol});
The example above overrides the default symbology of a point graphic with a key icon, using the font CalciteWebCoreIcons.
It is now possible to also override the default drawing symbology while actively creating a new graphic using pointSymbol, polylineSymbol, and polygonSymbol.
In earlier versions, setting these properties would only override the graphic symbology after completing the draw operation. The activeFillSymbol property allowed users to override the default drawing symbol in order to match the final polygonSymbol.
This was needed for users to see what the final graphic symbol would look like while actively drawing. Setting the pointSymbol, polylineSymbol, and polygonSymbol now allows users to see what the final graphic symbol will look like while still actively drawing a graphic. The image below demonstrates the behavior when setting the polygonSymbol.
The following is the code snippet used in the example above.
const polygonSymbol = {  type: "simple-fill", // autocasts as new SimpleFillSymbol()  color: "#f2bc94",  outline: {    // autocasts as new SimpleLineSymbol()    color: "#722620",    width: 3  }};
const sketchViewModel = new SketchViewModel({  view: view,  layer: graphicsLayer,  polygonSymbol: polygonSymbol,});
Sketch 3D
To be able to manipulate features on the z-axis using the height handle, the following configurations are relevant:
- Elevation info mode of the
GraphicsLayer needs to be set to
absolute-height,relative-to-sceneorrelative-to-ground. - To create a graphic with z-value the
hasZneeds to betruein defaultCreateOptions and/or in the createOptions. - To update the z-value of a graphic the
enableZneeds to betruein defaultUpdateOptions and/or in the updateOptions.
// define the GraphicsLayerconst gLayer = new GraphicsLayer({  elevationInfo: {    mode: "absolute-height" // default value  }});
// define the SketchViewModelconst sketchVM = new SketchViewModel({  layer: gLayer,  view: view,  defaultCreateOptions: {    hasZ: true  // default value  },  defaultUpdateOptions: {    enableZ: true  // default value  }});
In absolute-height elevation mode, the sketched vertices snap to scene elements (features and ground).
See elevation info for more information on how z-values are used with different elevation modes.
When sketching polygons or polylines, the elevation constraint is applied by default. This means that all vertices use the
z-value of the first vertex. To unlock the elevation constraint while sketching, make sure the
tooltips and their
inputs are enabled,
and activate the input mode with the Tab key.
Note that in elevation modes other than absolute-height, this means that the z-values are fixed but the graphic may appear non-planar.
See more about available tooltip inputs and constraints under the tooltip options class.
Known Limitation
Multipoint geometry can only be created in a MapView.
- See also
Sketch widget
Example
// Create a new SketchViewModel and set its required parameterslet sketchVM = new SketchViewModel({  layer: tempGraphicsLayer,  view: view});
// Listen to sketchViewModel's create event.sketchVM.on("create", function(event) {  // check if the create event's state has changed to complete indicating  // the graphic create operation is completed.  if (event.state === "complete") {    // remove the graphic from the layer. Sketch adds    // the completed graphic to the layer by default.    polygonGraphicsLayer.remove(event.graphic);
    // use the graphic.geometry to query features that intersect it    selectFeatures(event.graphic.geometry);  }});
Constructors
Constructor
Parameters
| Parameter | Type | Description | Required |
|---|---|---|---|
| properties | | |
Example
// Typical usagelet sketch = new SketchViewModel({ view: view, layer: graphicsLayer});Properties
| Property | Type | Class |
|---|---|---|
activeCreateToolDrawMode readonly | | |
| | ||
activeTool readonly | | |
activeTooltip readonly | | |
createGraphic readonly | | |
| | ||
declaredClass readonly inherited | ||
| | ||
| | ||
isUsingLegacyCreateTools deprecated readonly | | |
| | ||
| | ||
| | ||
| | ||
| | ||
| | ||
state readonly | | |
| | ||
| | ||
updateGraphics readonly | | |
| | ||
useLegacyCreateTools deprecated | | |
| | ||
| |
activeCreateToolDrawMode
- Since
- ArcGIS Maps SDK for JavaScript 4.32
When creating new graphics (for example after create() has been called),
this property reflects the drawing mode being used.
If no update operation is in progress, this is null.
activeFillSymbol
- Type
- SimpleFillSymbol | CIMSymbol | null | undefined
- Since
- ArcGIS Maps SDK for JavaScript 4.20
The SimpleFillSymbol displayed when actively creating a new polygon graphic using the polygon tool.
Known Limitation Not supported in 3D SceneViews. To avoid unintended side effects, instantiate a new symbol rather than modifying the current instance.
The default value is the following:
{ type: "simple-fill", style: "solid", color: [150, 150, 150, 0.2], outline: { color: [50, 50, 50], width: 0 }} activeTool
- Type
- SketchTool | null
- Since
- ArcGIS Maps SDK for JavaScript 4.10
When creating new graphics (for example after create() has been called),
this property reflects the create tool being used. When updating graphics
(for example after update() has been called), this property reflects the
update tool being used. If no create or update operation is in progress, this is null.
activeTooltip
- Since
- ArcGIS Maps SDK for JavaScript 4.31
The tooltip currently being displayed for the activeTool.
creationMode
- Type
- CreationMode
- Since
- ArcGIS Maps SDK for JavaScript 4.32
Defines the default behavior once the create() operation is completed. By default, the creation operation will end.
When set to update or continuous, the creation operation will either select the created feature for update, or immediately
start a new create operation. In either case, the automatic behavior will be interrupted if create, update, or cancel
is called while handling the @create event.
Possible Values
| Value | Description |
|---|---|
| continuous | After completion, immediately starts a new creation step with the same options as before. |
| single | After creation, no further action is taken. |
| update | After creation, the graphic is immediately selected for an update() operation. |
- Default value
- "single"
defaultCreateOptions
- Type
- CreateOptions
- Since
- ArcGIS Maps SDK for JavaScript 4.14
Default create options set for the SketchViewModel.
defaultUpdateOptions
- Type
- UpdateOptions
- Since
- ArcGIS Maps SDK for JavaScript 4.10
Default update options set for the SketchViewModel. Update options set on this property will be overridden by options passed to the update() method.
Example
// Turn off highlights for update operationsconst svm = new SketchViewModel({ view, defaultUpdateOptions: { highlightOptions: { enabled: false } }});// Turn off highlights from the update() methodconst updateOptions = { tool: "reshape", highlightOptions: { enabled: false }};svm.update(graphic, updateOptions); isUsingLegacyCreateTools
- Type
- boolean
- Since
- ArcGIS Maps SDK for JavaScript 5.0
Use this property to determine if the next generation geometry creation
has been disabled. This can happen when
useLegacyCreateTools is true,
or SketchViewModel is used with a non-2D (arcgis-map) view.
labelOptions
- Type
- SketchLabelOptions
- Since
- ArcGIS Maps SDK for JavaScript 4.24
Options to configure the sketch labels shown next to each segment of the geometry being created or updated.
Known Limitation
Sketch labels are currently only supported when working with a SceneView.
layer
- Type
- GraphicsLayer | MapNotesLayer | null | undefined
- Since
- ArcGIS Maps SDK for JavaScript 4.6
The GraphicsLayer or MapNotesLayer associated with the SketchViewModel. The SketchViewModel adds new graphics to this layer or can only update graphics stored in this layer.
pointSymbol
- Type
- SketchPointSymbol
A SimpleMarkerSymbol, PictureMarkerSymbol, PointSymbol3D, TextSymbol, CIMSymbol, or WebStyleSymbol used for representing the point geometry that is being drawn. SimpleMarkerSymbol may also be used to symbolize point features in a SceneView. However, it is recommended you use PointSymbol3D instead.
Known Limitation To avoid unintended side effects, instantiate a new symbol rather than modifying the current instance.
The default value is the following:
{ type: "simple-marker", style: "circle", size: 6, color: [255, 255, 255], outline: { color: [50, 50, 50], width: 1 }} polygonSymbol
- Type
- SketchPolygonSymbol
A SimpleFillSymbol, PolygonSymbol3D, or CIMSymbol used for representing the polygon geometry that is being drawn. SimpleFillSymbol may also be used to symbolize polygon features in a SceneView. However, it is recommended you use PolygonSymbol3D instead.
Known Limitation To avoid unintended side effects, instantiate a new symbol rather than modifying the current instance.
The default value is the following:
{ type: "simple-fill", color: [150, 150, 150, 0.2], outline: { color: [50, 50, 50], width: 2 }} polylineSymbol
- Type
- SketchPolylineSymbol
A SimpleLineSymbol, LineSymbol3D, or CIMSymbol used for representing the polyline geometry that is being drawn. SimpleLineSymbol may also be used to symbolize polyline features in a SceneView. However, it is recommended you use LineSymbol3D instead.
Known Limitation To avoid unintended side effects, instantiate a new symbol rather than modifying the current instance.
The default value is the following:
{ type: "simple-line", color: [130, 130, 130], width: 2} snappingOptions
- Type
- SnappingOptions
- Since
- ArcGIS Maps SDK for JavaScript 4.18
The SnappingOptions for sketching. It supports self and feature snapping.
textSymbol
- Type
- TextSymbol
A TextSymbol used when creating features with the 'text' tool.
tooltipOptions
- Type
- SketchTooltipOptions
- Since
- ArcGIS Maps SDK for JavaScript 4.24
Options to configure the tooltip shown next to the cursor when creating or updating graphics.
updateGraphics
- Type
- Collection<Graphic>
- Since
- ArcGIS Maps SDK for JavaScript 4.10
An array of graphics that are being updated by the SketchViewModel.
updateOnGraphicClick
- Type
- boolean
- Since
- ArcGIS Maps SDK for JavaScript 4.10
Indicates if a graphic can be selected to be updated. If false, graphics cannot selected to be updated. Set this property to false
to add a custom MapView.hitTest() logic for updating graphics.
- Default value
- true
useLegacyCreateTools
- Type
- boolean
- Since
- ArcGIS Maps SDK for JavaScript 5.0
Starting at version 5.0, arcgis-sketch and SketchViewModel
are transitioning to a next generation geometry
creation experience. This new experience provides advanced curve creation tools
and allows multiple tools to be used in combination to define a single geometry.
As of 5.0, this experience is only available in 2D (e.g., MapView, arcgis-map).
This property is available to allow 2D applications to temporarily opt out of this experience.
This option will be removed in an upcoming release.
- Default value
- true
valueOptions
- Type
- SketchValueOptions
- Since
- ArcGIS Maps SDK for JavaScript 4.29
Options to configure how values are displayed and input when creating or updating graphics.
view
- Type
- MapViewOrSceneView | null | undefined
The view in which geometries will be sketched by the user.
Methods
| Method | Signature | Class |
|---|---|---|
addGraphic(graphic: Graphic): void | | |
addGraphics(graphics: Graphic[]): void | | |
cancel(): void | | |
canRedo(): boolean | | |
canUndo(): boolean | | |
complete(): void | | |
create(tool: CreateTool | PluginConfiguration[], createOptions?: CreateOptions | null): Promise<void> | | |
delete(): void | | |
duplicate(): Graphic[] | | |
emit inherited | emit<Type extends EventNames<this>>(type: Type, event?: this["@eventTypes"][Type]): boolean | |
hasEventListener inherited | hasEventListener<Type extends EventNames<this>>(type: Type): boolean | |
hasGraphic(graphic: Graphic): boolean | | |
on inherited | on<Type extends EventNames<this>>(type: Type, listener: EventedCallback<this["@eventTypes"][Type]>): ResourceHandle | |
place(geometry: Mesh): Promise<void> | | |
redo(): void | | |
removeAllGraphics(): void | | |
removeGraphic(graphic: Graphic): void | | |
removeGraphics(graphics: Graphic[]): void | | |
undo(): void | | |
update(graphics: Graphic | Graphic[], updateOptions?: UpdateOptions): Promise<void> | |
complete
- Signature
-
complete (): void
- Since
- ArcGIS Maps SDK for JavaScript 4.6
Completes the active operation and fires the @create or @update event
and changes the event's state to complete. If called in the middle of a create operation, complete() finishes
the active create operation and keeps the valid geometry.
- Returns
- void
create
- Signature
-
create (tool: CreateTool | PluginConfiguration[], createOptions?: CreateOptions | null): Promise<void>
Create a graphic with the geometry specified in the tool parameter. When the first vertex of the graphic is added,
the @create event will start firing. The provided tool will become the activeTool.
Parameters
| Parameter | Type | Description | Required |
|---|---|---|---|
| tool | Name of the create tool. Specifies the geometry for the graphic to be created. | | |
| createOptions | Options for the graphic to be created. | |
Example
// Call create method to create a polygon with freehand option.sketchVM.create("polygon", {mode: "freehand"});
// listen to create event, only respond when event's state changes to completesketchVM.on("create", function(event) {  if (event.state === "complete") {    // remove the graphic from the layer associated with the sketch widget    // instead use the polygon that user created to query features that    // intersect it.    polygonGraphicsLayer.remove(event.graphic);    selectFeatures(event.graphic.geometry);  }});
// create a squaresketchVM.create("rectangle", { preserveAspectRatio: true });
// create an ellipsesketchVM.create("circle", { preserveAspectRatio: false });
delete
- Signature
-
delete (): void
- Since
- ArcGIS Maps SDK for JavaScript 4.14
Deletes the selected graphics used in the update workflow. Calling this method will fire the @delete event.
- Returns
- void
Example
// selected graphics can be deleted only when update event becomes activesketch.on("update", function(event) {  if (event.state === "active") {    sketch.delete();  }});
// fires after delete method is called// returns references to deleted graphics.sketch.on("delete", function(event) {  event.graphics.forEach(function(graphic){    console.log("deleted", graphic)  });});
duplicate
- Signature
-
duplicate (): Graphic[]
- Since
- ArcGIS Maps SDK for JavaScript 4.26
Duplicates current graphics used in the update workflow and automatically adds them to the associated layer
- Returns
- Graphic[]
emit
- Signature
-
emit <Type extends EventNames<this>>(type: Type, event?: this["@eventTypes"][Type]): boolean
- Type parameters
- <Type extends EventNames<this>>
Emits an event on the instance. This method should only be used when creating subclasses of this class.
hasEventListener
- Signature
-
hasEventListener <Type extends EventNames<this>>(type: Type): boolean
- Type parameters
- <Type extends EventNames<this>>
Indicates whether there is an event listener on the instance that matches the provided event name.
Parameters
| Parameter | Type | Description | Required |
|---|---|---|---|
| type | Type | The name of the event. | |
- Returns
- boolean
Returns true if the class supports the input event.
on
- Signature
-
on <Type extends EventNames<this>>(type: Type, listener: EventedCallback<this["@eventTypes"][Type]>): ResourceHandle
- Type parameters
- <Type extends EventNames<this>>
Registers an event handler on the instance. Call this method to hook an event with a listener.
Parameters
| Parameter | Type | Description | Required |
|---|---|---|---|
| type | Type | An event or an array of events to listen for. | |
| listener | EventedCallback<this["@eventTypes"][Type]> | The function to call when the event fires. | |
- Returns
- ResourceHandle
Returns an event handler with a
remove()method that should be called to stop listening for the event(s).Property Type Description remove Function When called, removes the listener from the event.
Example
view.on("click", function(event){ // event is the event handle returned after the event fires. console.log(event.mapPoint);}); place
- Signature
-
place (geometry: Mesh): Promise<void>
Allows creation of a graphic similar to create() with the difference that the geometry can be provided directly for the graphic being created. Placement is then done through mouse interaction.
Currently only Mesh placement is supported.
The @create event will start firing. A create tool will become the activeTool
till placement finished.
Parameters
Example
// create mesh at the global originconst box = Mesh.createBox(new Point({x: 0, y: 0, z: 0, spatialReference: SpatialReference.WGS84});
// Call place method to place a mesh - this will allow the user to place the mesh using the mousesketchVM.place(box);
// listen to create event, only respond when event's state changes to completesketchVM.on("create", function(event) {  if (event.state === "complete") {    // retrieve the final position of the mesh which was chosen by the user   const mesh = event.graphic.geometry;   const placedLocation = mesh.origin;  }});
redo
- Signature
-
redo (): void
- Since
- ArcGIS Maps SDK for JavaScript 4.9
Incrementally redo actions recorded in the stack. Calling this method will fire the @redo event. The undo/redo stack is for an individual sketch operation, meaning you can redo/undo actions while creating or updating a graphic.
- Returns
- void
removeAllGraphics
- Signature
-
removeAllGraphics (): void
Convenience method for removing multiple graphics from the appropriate Sketch layer. Any active operation will automatically be cancelled if any removed graphics are the target of an active operation.
- Returns
- void
undo
- Signature
-
undo (): void
- Since
- ArcGIS Maps SDK for JavaScript 4.9
Incrementally undo actions recorded in the stack. Calling this method will fire the @undo event. The undo/redo stack is for an individual sketch operation, meaning you can redo/undo actions while creating or updating a graphic.
- Returns
- void
update
- Signature
-
update (graphics: Graphic | Graphic[], updateOptions?: UpdateOptions): Promise<void>
- Since
- ArcGIS Maps SDK for JavaScript 4.10
Initializes an update operation for the specified graphic(s) and fires @update event.
Parameters
| Parameter | Type | Description | Required |
|---|---|---|---|
| graphics | A graphic or an array of graphics to be updated. Only graphics added to SketchViewModel's layer property can be updated. | | |
| updateOptions | Update options for the graphics to be updated. | |
Examples
// start update operation for the selected graphic// with transform tool. Only allow uniform scaling operation.sketchVM.update([selectedGraphic], { tool: "transform", enableRotation: false, enableScaling: true, preserveAspectRatio: true, toggleToolOnClick: false});// Listen to sketch's update event to validate graphic's// location while it is being reshaped or movedsketchViewModel.on("update", onGraphicUpdate);function onGraphicUpdate(event) { // get the graphic as it is being updated const graphic = event.graphics[0]; // check if the graphic is intersecting school buffers intersects = geometryEngine.intersects(buffers, graphic.geometry);
// change the graphic symbol to valid or invalid symbol // depending the graphic location graphic.symbol = (intersects) ? invalidSymbol : validSymbol
// check if the update event's the toolEventInfo.type is move-stop or reshape-stop // user finished moving or reshaping the graphic, call complete method. // This changes update event state to complete. const toolType = event.toolEventInfo.type; if (event.toolEventInfo && (toolType === "move-stop" || toolType === "reshape-stop")) { if (!intersects) { sketchViewModel.complete(); } } else if (event.state === "complete") { // graphic update has been completed // if the graphic is in a bad spot, call sketch's update method again // giving user a chance to correct the location of the graphic if ((!contains) || (intersects)) { sketchViewModel.update([graphic], { tool: "reshape", toggleToolOnClick: false }); } }}Events
create
create: CustomEvent<CreateEvent> - Since
- ArcGIS Maps SDK for JavaScript 4.10
Fires when a user starts sketching a graphic, is actively sketching a graphic and completes sketching a graphic.
Example
// Listen to sketch widget's create event.sketch.on("create", function(event) {  // check if the create event's state has changed to complete indicating  // the graphic create operation is completed.  if (event.state === "complete") {    // remove the graphic from the layer. Sketch adds    // the completed graphic to the layer by default.    polygonGraphicsLayer.remove(event.graphic);
    // use the graphic.geometry to query features that intersect it    selectFeatures(event.graphic.geometry);  }});
delete
delete: CustomEvent<DeleteEvent> - Since
- ArcGIS Maps SDK for JavaScript 4.14
Fires when a user deletes selected graphics by clicking the Delete feature button on the Sketch widget
or when Sketch.delete() method is called.
Example
// selected graphics can be deleted only when update event becomes activesketch.on("update", function(event) {  if (event.state === "active") {    sketch.delete();  }});
// fires after delete method is called// returns references to deleted graphics.sketch.on("delete", function(event) {  event.graphics.forEach(function(graphic){    console.log("deleted", graphic)  });});
redo
redo: CustomEvent<RedoEvent> - Since
- ArcGIS Maps SDK for JavaScript 4.10
Fires in response to redo action during creation of a new graphic or updating existing graphics. The undo/redo stack is for an individual sketch operation, meaning you can redo/undo actions while creating or updating a graphic.
undo
undo: CustomEvent<UndoEvent> - Since
- ArcGIS Maps SDK for JavaScript 4.10
Fires in response to undo action during creation of a new graphic or updating existing graphics. The undo/redo stack is for an individual sketch operation, meaning you can redo/undo actions while creating or updating a graphic.
update
update: CustomEvent<UpdateEvent> - Since
- ArcGIS Maps SDK for JavaScript 4.10
Fires when the user starts updating graphics, is actively updating graphics, and completes updating graphics.
Example
// Listen to sketch's update event to show relevant data in a chart// as the graphics are being movedsketch.on("update", onMove);
// Point graphics at the center and edge of the buffer polygon are being moved.// Recalculate the buffer with updated geometry and run the query stats using// the updated buffer and update the chart.function onMove(event) {  // If the edge graphic is moving, keep the center graphic  // at its initial location. Only move edge graphic to resize the buffer.  if (event.toolEventInfo && event.toolEventInfo.mover.attributes.edge) {    const toolType = event.toolEventInfo.type;    if (toolType === "move-start") {      centerGeometryAtStart = centerGraphic.geometry;    }    // keep the center graphic at its initial location when edge point is moving    else if (toolType === "move" || toolType === "move-stop") {      centerGraphic.geometry = centerGeometryAtStart;    }  }
  // the center or edge graphic is being moved, recalculate the buffer  const vertices = [    [centerGraphic.geometry.x, centerGraphic.geometry.y],    [edgeGraphic.geometry.x, edgeGraphic.geometry.y]  ];
  // client-side stats query of features that intersect the buffer  calculateBuffer(vertices);
  // user is clicking on the view... call update method with the center and edge graphics  if (event.state === "complete") {    sketch.update([edgeGraphic, centerGraphic], { tool: "move" });  }}