import "@arcgis/map-components/components/arcgis-elevation-profile";- Inheritance:
- ArcgisElevationProfile→
PublicLitElement
- Since
- ArcGIS Maps SDK for JavaScript 4.28
The Elevation Profile component manages an ElevationProfileAnalysis and displays its elevation profiles.
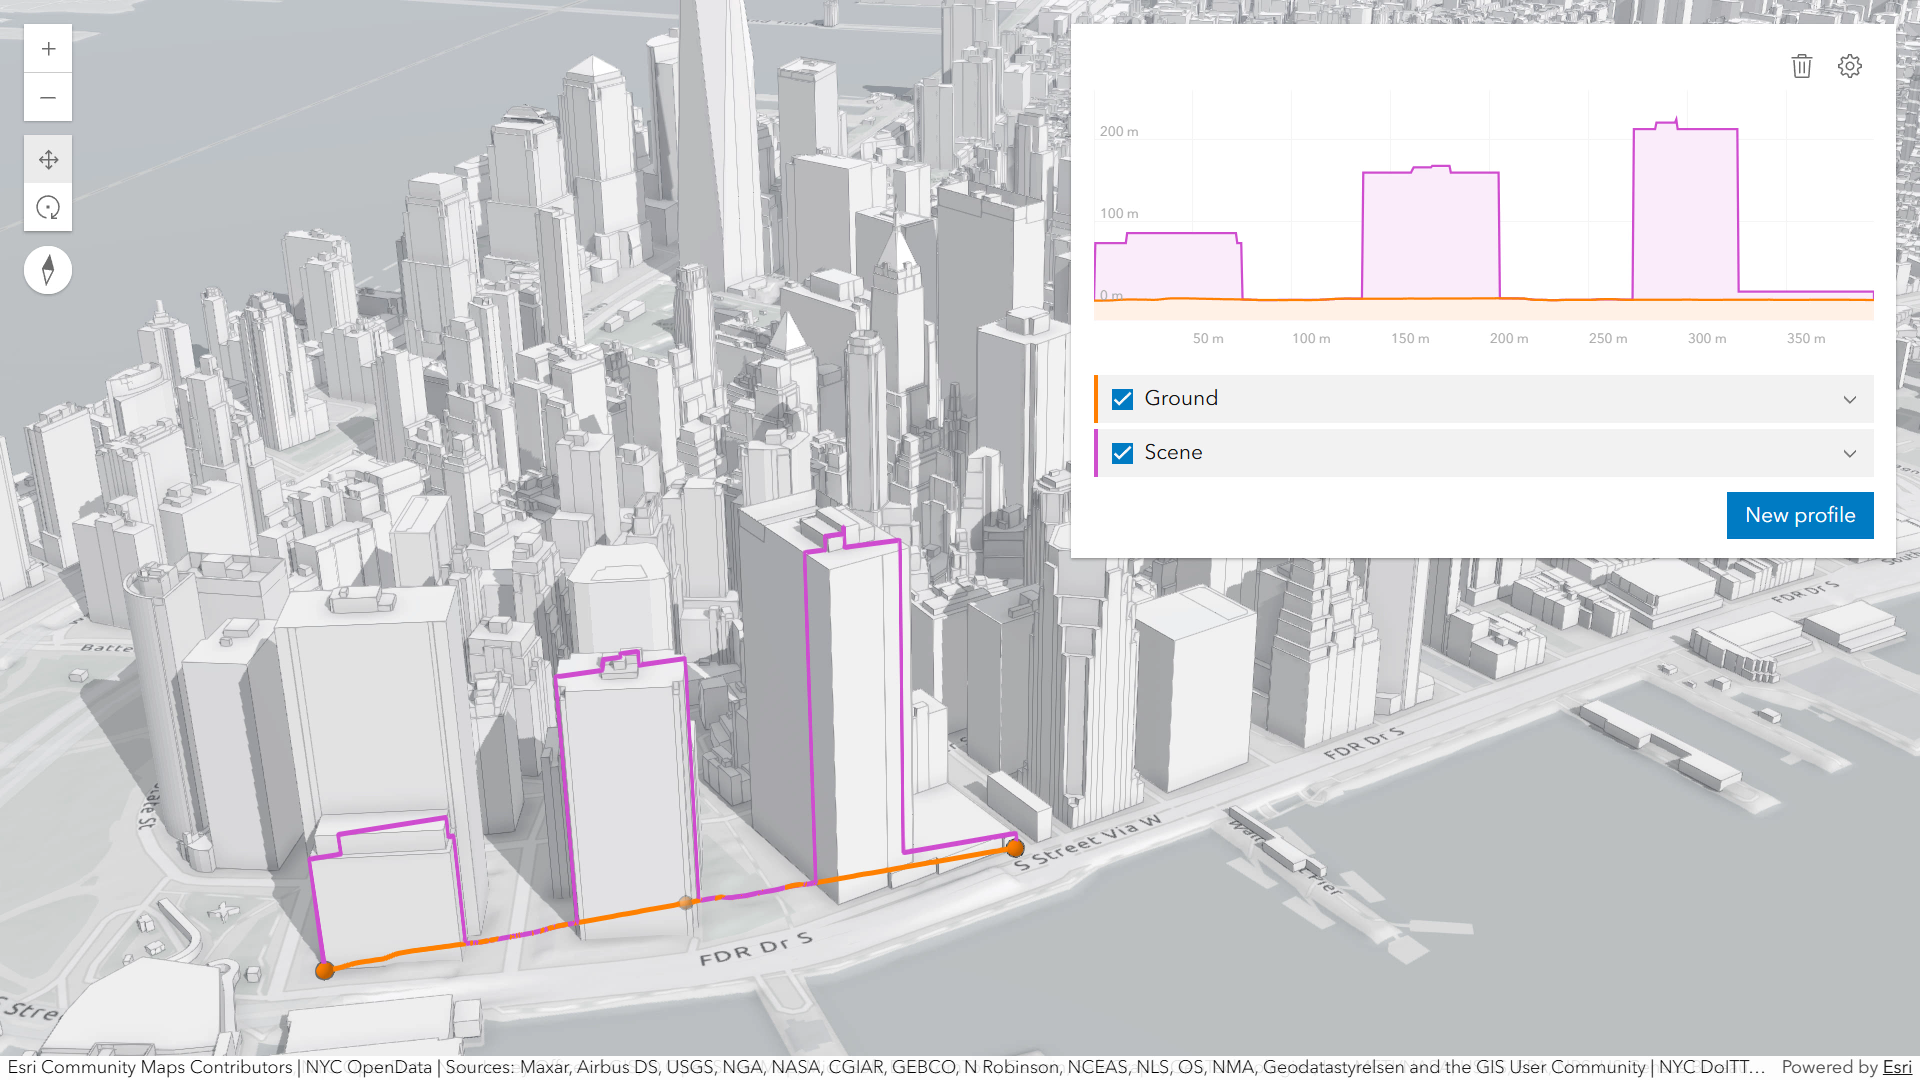
The component can visualize multiple profile lines, depending on whether it is used in an arcgis-map component or an arcgis-scene component and on the available elevation source data:
- ElevationProfileLineGround: represents a profile line that uses elevation from arcgis-map.ground of the connected Map or Scene component. The profile recomputes automatically when ground layers are added, removed, or their visibility changes.
- ElevationProfileLineInput: represents a profile line that reads elevation from the analysis geometry itself; typically used for polylines with z values. If the line lacks z values but is displayed with a non-draped elevation mode, a profile is still computed. If
elevationInfois set toon-the-ground, elevation comes from the Ground (when ground layers are present). An elevation offset can be applied. In a Map this requires client-side graphics that already contain z values. - ElevationProfileLineQuery: represents a profile line that samples elevation from the elevation source set in the source property. The elevation source can be an ElevationLayer or an object with a method called
queryElevationthat has the same signature as queryElevation(). - ElevationProfileLineScene: represents a profile line that derives elevation from the
Sceneand all its volumetric objects (e.g. SceneLayer, IntegratedMeshLayer).
You can choose to display one or several profile lines in the chart, by setting them in the profiles property.
Hovering over the chart shows an overlaid tooltip with elevation values of all profiles, and displays colored dot markers at the matching positions.
Checkboxes in the legend allow hiding individual profiles. Chart units can be set via the settings menu to metric, imperial or a specific unit.
Scrolling the chart zooms in to a specific part of the profile chart. When zoomed in, click the minus button to reset the zoom. On touch devices, pinch to zoom in and out.
How distance values are computed depends on the map's spatial reference:
- In geographic coordinate systems (GCS) and in Web Mercator, distances are computed geodetically.
- In projected coordinate systems (PCS), apart from Web Mercator, distances are computed in a Euclidean manner (in their respective PCS).
Known limitations
- ElevationProfileLineInput in 2D is only valid when the analysis geometry has z values,
hasZ===trueand no elevationInfo is set. - ElevationProfileLineScene is only supported in a 3D arcgis-scene component.
See also
Demo
Properties
| Property | Attribute | Type |
|---|---|---|
| ||
auto-destroy-disabled | ||
distance-unit | ||
| ||
effectiveDisplayUnits readonly | | |
| ||
elevation-unit | ||
| ||
| ||
| ||
hide-chart | ||
hide-clear-button | ||
hide-distance-display-unit-select | ||
hide-elevation-display-unit-select | ||
hide-legend | ||
hide-select-button | ||
hide-settings-button | ||
hide-start-button | ||
hide-uniform-chart-scaling-toggle | ||
hide-visualization | ||
highlight-disabled | ||
icon reflected | icon | Icon["icon"] | undefined |
indicatorRelativePosition readonly | | |
label | ||
| ||
| ||
progress readonly | | |
reference-element | ||
state readonly | | "disabled" | "ready" | "selected" | "created" | "creating" | "selecting" |
uniform-chart-scaling | ||
|
analysis
- Since
- ArcGIS Maps SDK for JavaScript 5.0
The ElevationProfileAnalysis created or modified by the component.
When connecting the Elevation Profile component to the arcgis-map or arcgis-scene components, it automatically creates an empty analysis and adds it to the Map's arcgis-map.analyses collection or the Scene's arcgis-scene.analyses collection. You can then wait for the ElevationProfileAnalysisView2D or ElevationProfileAnalysisView3D to be created (depending on whether you are using a Map or Scene component) before accessing the analysis results.
// Get the Scene component and the Elevation Profile component, and wait until both are ready.const viewElement = document.querySelector("arcgis-scene");await viewElement.viewOnReady();const elevationProfileElement = document.querySelector("arcgis-elevation-profile");await elevationProfileElement.componentOnReady();
// Get the ElevationProfileAnalysis created by the Elevation Profile component.const analysis = elevationProfileElement.analysis;
// Get the ElevationProfileAnalysisView3D and watch for results.const analysisView = await viewElement.whenAnalysisView(analysis);const handle = reactiveUtils.watch(  () => analysisView?.results,  () => {    console.log("Analysis results:", analysisView.results);  },);
Whenever the component is destroyed, the analysis is automatically removed from the collection.
Alternatively, a programmatically created ElevationProfileAnalysis can be provided to the component. Then, the application itself needs to add it to and later remove it from the analyses collection of the Map or Scene component.
// Create the ElevationProfileAnalysis.const analysis = new ElevationProfileAnalysis({  profiles: [{ type: "ground" }, { type: "scene" }]});
// Get the Scene component and the Elevation Profile component, and wait until both are ready.const viewElement = document.querySelector("arcgis-scene");await viewElement.viewOnReady();const elevationProfileElement = document.querySelector("arcgis-elevation-profile");await elevationProfileElement.componentOnReady();
// Add the analysis to the analyses collection of the Scene component.viewElement.analyses.add(analysis);
// Connect the analysis to the elevation profile component.elevationProfileElement.analysis = analysis;
autoDestroyDisabled
- Type
- boolean
If true, the component will not be destroyed automatically when it is disconnected from the document. This is useful when you want to move the component to a different place on the page, or temporarily hide it. If this is set, make sure to call the destroy() method when you are done to prevent memory leaks.
- Attribute
- auto-destroy-disabled
- Default value
- false
distanceUnit
- Type
- SystemOrLengthUnit | undefined
- Since
- ArcGIS Maps SDK for JavaScript 5.0
The measurement system (imperial, metric) or specific unit (e.g. feet, kilometers) used to display distance values in the chart, results and legend.
- Attribute
- distance-unit
distanceUnitOptions
- Type
- Array<SystemOrLengthUnit>
- Since
- ArcGIS Maps SDK for JavaScript 5.0
List of available units unit systems (imperial, metric) and specific units (e.g. feet, kilometers) for displaying the distance values. These are the options displayed in the distance unit dropdown in the settings popover.
elevationInfo
- Type
- ElevationInfo<ElevationInfoMode> | null | undefined
elevationUnit
- Type
- SystemOrLengthUnit | undefined
- Since
- ArcGIS Maps SDK for JavaScript 5.0
The measurement system (imperial, metric) or specific unit (e.g. feet, kilometers) used to display elevation values in the chart, results and legend.
- Attribute
- elevation-unit
elevationUnitOptions
- Type
- Array<SystemOrLengthUnit>
- Since
- ArcGIS Maps SDK for JavaScript 5.0
List of available units unit systems (imperial, metric) and specific units (e.g. feet, kilometers) for displaying the elevation values. These are the options displayed in the elevation unit dropdown in the settings popover.
hideChart
- Type
- boolean
If true, the elevation profile chart will be hidden.
- Attribute
- hide-chart
- Default value
- false
hideClearButton
- Type
- boolean
If true, the clear button will be hidden.
- Attribute
- hide-clear-button
- Default value
- false
hideDistanceDisplayUnitSelect
- Type
- boolean
- Since
- ArcGIS Maps SDK for JavaScript 5.0
If true, the distance display unit dropdown will be hidden in the settings popover.
- Attribute
- hide-distance-display-unit-select
- Default value
- false
hideElevationDisplayUnitSelect
- Type
- boolean
- Since
- ArcGIS Maps SDK for JavaScript 5.0
If true, the elevation display unit dropdown will be hidden in the settings popover.
- Attribute
- hide-elevation-display-unit-select
- Default value
- false
hideLegend
- Type
- boolean
If true, the legend will be hidden.
- Attribute
- hide-legend
- Default value
- false
hideSelectButton
- Type
- boolean
If true, the button to select features in the view will be hidden.
- Attribute
- hide-select-button
- Default value
- false
hideSettingsButton
- Type
- boolean
If true, the button which opens the settings popover will be hidden.
- Attribute
- hide-settings-button
- Default value
- false
hideStartButton
- Type
- boolean
- Since
- ArcGIS Maps SDK for JavaScript 5.0
If true, the button to start sketching a new profile line will be hidden.
- Attribute
- hide-start-button
- Default value
- false
hideUniformChartScalingToggle
- Type
- boolean
If true, the uniform chart scaling toggle will be hidden in the settings popover.
- Attribute
- hide-uniform-chart-scaling-toggle
- Default value
- false
hideVisualization
- Type
- boolean
- Since
- ArcGIS Maps SDK for JavaScript 5.0
Indicates whether the component's visualization is hidden in the view.
- Attribute
- hide-visualization
- Default value
- false
highlightDisabled
- Type
- boolean
- Since
- ArcGIS Maps SDK for JavaScript 5.0
If true, the component will not highlight features selected in the view.
- Attribute
- highlight-disabled
- Default value
- false
icon
- Type
- Icon["icon"] | undefined
Icon which represents the component. Typically used when the component is controlled by another component (e.g. by the Expand component).
- See also
- Attribute
- icon
- Default value
- "altitude"
profiles
The collection of profile lines to compute and display. Each profile line defines a different source for sampling elevation along the input geometry (such as ground, input geometry itself, custom elevation sources, or scene content), and includes settings for how the resulting line will appear in the component chart and in the view.
referenceElement
- Type
- ArcgisReferenceElement | string | undefined
By assigning the id attribute of the Map or Scene component to this property, you can position a child component anywhere in the DOM while still maintaining a connection to the Map or Scene.
- Attribute
- reference-element
state
- Type
- "disabled" | "ready" | "selected" | "created" | "creating" | "selecting"
The component's state. The values mean the following:
disabled- component is being createdready- component is ready; no path configured and no interactive operation ongoingcreating- user is creating a new input pathcreated- input path is configured but no interactive operation is ongoingselecting- user is selecting an existing input pathselected- user selected an existing input path
uniformChartScaling
- Type
- boolean
Whether the chart should use a uniform scale for the X and Y axes.
- Attribute
- uniform-chart-scaling
- Default value
- false
view
The view associated with the component.
Note: The recommended approach is to fully migrate applications to use map and scene components and avoid using MapView and SceneView directly. However, if you are migrating a large application from widgets to components, you might prefer a more gradual transition. To support this use case, the SDK includes this
viewproperty which connects a component to a MapView or SceneView. Ultimately, once migration is complete, the arcgis-elevation-profile component will be associated with a map or scene component rather than using theviewproperty.
Methods
componentOnReady
- Signature
-
componentOnReady (): Promise<this>
Creates a promise that resolves once the component is fully loaded.
- Returns
- Promise<this>
Example
const arcgisElevationProfile = document.querySelector("arcgis-elevation-profile");document.body.append(arcgisElevationProfile);await arcgisElevationProfile.componentOnReady();console.log("arcgis-elevation-profile is ready to go!"); select
- Signature
-
select (): Promise<void>
- Since
- ArcGIS Maps SDK for JavaScript 5.0
Start an interactive operation to pick an existing polyline feature in the view to use as the input for the elevation profile. The operation ends when the user presses the Escape key. To programmatically cancel the operation, call the stop() method.
start
- Signature
-
start (): Promise<void>
Start an interactive operation that lets the user sketch a new path in the view along which the elevation profile will be generated. The operation completes when the user double-clicks, presses the Escape key or clicks the Done button in the UI. To programmatically cancel the operation, call the stop() method.
Events
| Name | Type |
|---|---|
| CustomEvent<{ name: "analysis" | "effectiveDisplayUnits" | "elevationInfo" | "feature" | "geometry" | "indicatorRelativePosition" | "progress" | "state"; }> | |
arcgisPropertyChange
arcgisPropertyChange: CustomEvent<{ name: "analysis" | "effectiveDisplayUnits" | "elevationInfo" | "feature" | "geometry" | "indicatorRelativePosition" | "progress" | "state"; }> Emitted when the value of a property is changed. Use this to listen to changes to properties.
arcgisReady
arcgisReady: CustomEvent<void> Emitted when the component associated with a map or scene view is ready to be interacted with.