Display common symbols for all graphics in a graphics overlay with a renderer.
Use case
Graphics are often used to display data that changes location regularly because they are held in memory instead of being persisted to the map. When a number of graphics are required to share the same style, a simple renderer can be applied to the graphics overlay containing the graphics. For example, the location of mobile taxis from a same company could be plotted on a map with each taxi marked by a relevant symbol.
How to use the sample
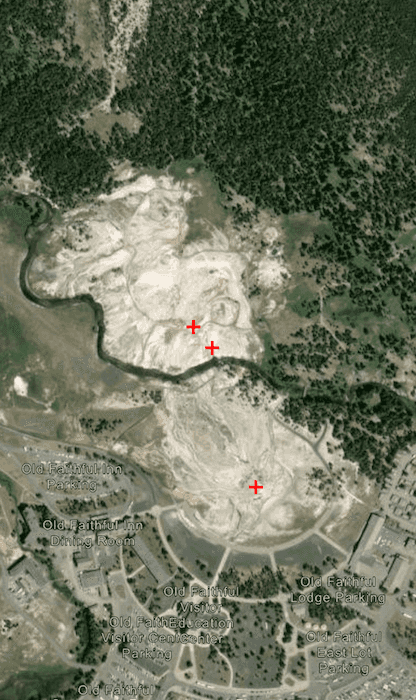
The sample loads with a predefined simple renderer, which displays a red cross simple marker symbol for the graphics in the graphics overlay.
How it works
- Create a
GraphicsOverlay. - Create a number of
Pointobjects with x, y, and spatial reference parameters. - Create a number of
Graphicobjects with the points from step 2. - Add the graphics to the graphics overlay.
- Create a
SimpleMarkerSymbolpassing in style, color, and size as parameters. - Create a
SimpleRenderer. - Set the simple renderer to the graphics overlay.
Relevant API
- Graphic
- GraphicsOverlay
- Point
- SimpleMarkerSymbol
- SimpleRenderer
Additional information
Renderers are used to display graphics that don't already have a symbol set. A renderer will not override a graphic's symbol if one has been set.
Tags
graphics, marker, renderer, symbol, symbolize, symbology
Sample Code
/* Copyright 2025 Esri
*
* Licensed under the Apache License, Version 2.0 (the "License");
* you may not use this file except in compliance with the License.
* You may obtain a copy of the License at
*
* http://www.apache.org/licenses/LICENSE-2.0
*
* Unless required by applicable law or agreed to in writing, software
* distributed under the License is distributed on an "AS IS" BASIS,
* WITHOUT WARRANTIES OR CONDITIONS OF ANY KIND, either express or implied.
* See the License for the specific language governing permissions and
* limitations under the License.
*
*/
package com.esri.arcgismaps.sample.applysimplerenderertographicsoverlay.components
import android.app.Application
import androidx.lifecycle.AndroidViewModel
import androidx.lifecycle.viewModelScope
import com.arcgismaps.Color
import com.arcgismaps.geometry.Point
import com.arcgismaps.geometry.SpatialReference
import com.arcgismaps.mapping.ArcGISMap
import com.arcgismaps.mapping.BasemapStyle
import com.arcgismaps.mapping.Viewpoint
import com.arcgismaps.mapping.symbology.SimpleMarkerSymbol
import com.arcgismaps.mapping.symbology.SimpleMarkerSymbolStyle
import com.arcgismaps.mapping.symbology.SimpleRenderer
import com.arcgismaps.mapping.view.Graphic
import com.arcgismaps.mapping.view.GraphicsOverlay
import com.esri.arcgismaps.sample.sampleslib.components.MessageDialogViewModel
import kotlinx.coroutines.launch
class ApplySimpleRendererToGraphicsOverlayViewModel(app: Application) : AndroidViewModel(app) {
// ArcGISMap centered on Yellowstone National Park
val arcGISMap = ArcGISMap(BasemapStyle.ArcGISImagery).apply {
initialViewpoint = Viewpoint(latitude = 44.462, longitude = -110.829, scale = 1e4)
}
// GraphicsOverlay with a simple renderer (red cross marker)
val graphicsOverlay = GraphicsOverlay().apply {
// Create points for geysers in Yellowstone
val oldFaithful = Point(-110.828140, 44.460458, SpatialReference.wgs84())
val cascadeGeyser = Point(-110.829004, 44.462438, SpatialReference.wgs84())
val plumeGeyser = Point(-110.829381, 44.462735, SpatialReference.wgs84())
// Add graphics for each point
graphics.addAll(
listOf(
Graphic(oldFaithful),
Graphic(cascadeGeyser),
Graphic(plumeGeyser)
)
)
// Create a simple renderer with a red cross symbol
renderer = SimpleRenderer(
symbol = SimpleMarkerSymbol(
style = SimpleMarkerSymbolStyle.Cross,
color = Color.red,
size = 12f
)
)
}
// Message dialog for error handling
val messageDialogVM = MessageDialogViewModel()
init {
viewModelScope.launch {
arcGISMap.load().onFailure { messageDialogVM.showMessageDialog(it) }
}
}
}