Render features in a layer using a distinct symbol for each unique attribute value.
Use case
A unique value renderer allows you to symbolize features in a layer based on one or more matching attributes. This is typically done by using unique colors, fill styles, or images to represent features with equal values in a string field. A unique value renderer could be used to show different types of trees on a vegetation map by using symbols corresponding to matching name attributes.
How to use the sample
The map with the symbolized feature layer will be shown automatically when the sample loads.
How it works
Using the UniqueValueRenderer, separate symbols can be used to display features that have a specific value for a given field. In this case, the field is subregions of the USA. While multiple fields can be used, this sample only uses one.
- A
SimpleFillSymbolis defined for each type of feature. SimpleFillSymbolcan be applied to polygon features, which is the type of feature contained by thisServiceFeatureTable.- Separate
UniqueValueobjects are created which define the values in the renderer field and the symbol used to render matching features. - A default symbol is created to render all features that do not match any of the
UniqueValueobjects defined.
Relevant API
- FeatureLayer
- ServiceFeatureTable
- SimpleFillSymbol
- SimpleLineSymbol
- UniqueValue
- UniqueValueRenderer
About the data
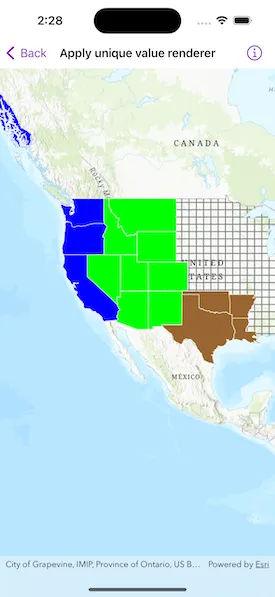
The map shows U.S. states symbolized by subregion. Symbols are defined for Pacific, Mountain, and West South Central states. All other features are symbolized with the default symbol.
Tags
draw, renderer, symbol, symbology, values
Sample code
// Copyright 2023 Esri//// Licensed under the Apache License, Version 2.0 (the "License");// you may not use this file except in compliance with the License.// You may obtain a copy of the License at////   https://www.apache.org/licenses/LICENSE-2.0//// Unless required by applicable law or agreed to in writing, software// distributed under the License is distributed on an "AS IS" BASIS,// WITHOUT WARRANTIES OR CONDITIONS OF ANY KIND, either express or implied.// See the License for the specific language governing permissions and// limitations under the License.
import ArcGISimport SwiftUI
struct ApplyUniqueValueRendererView: View {    /// A map with topographic basemap centered on western United States.    @State private var map: Map = {        let map = Map(basemapStyle: .arcGISTopographic)
        // Center map on western United States        let centerPoint = Point(x: -12356253.6, y: 3842795.4, spatialReference: .webMercator)        map.initialViewpoint = Viewpoint(center: centerPoint, scale: 52681563.2)
        // Create a service feature table from the census feature service.        let featureTable = ServiceFeatureTable(url: URL(string: "https://sampleserver6.arcgisonline.com/arcgis/rest/services/Census/MapServer/3")!)
        // Create a feature layer from the service feature table.        let featureLayer = FeatureLayer(featureTable: featureTable)
        // Set a unique value renderer to the feature layer.        featureLayer.renderer = makeUniqueValueRenderer()
        // Add the feature layer to the map.        map.addOperationalLayer(featureLayer)
        return map    }()
    /// Creates a unique value renderer configured to render the Pacific states    /// as blue, the Mountain states as green, and the West South Central states    /// as brown.    /// - Returns: A `UniqueValueRenderer` object to be added to a featureLayer.    private static func makeUniqueValueRenderer() -> UniqueValueRenderer {        // Define a line symbol to use for the region fill symbol outlines.        let stateOutlineSymbol = SimpleLineSymbol(style: .solid, color: .white, width: 0.7)
        // Define distinct fill symbols for the regions (use the same outline symbol).        let pacificFillSymbol = SimpleFillSymbol(style: .solid, color: .blue, outline: stateOutlineSymbol)        let mountainFillSymbol = SimpleFillSymbol(style: .solid, color: .green, outline: stateOutlineSymbol)        let westSouthCentralFillSymbol = SimpleFillSymbol(style: .solid, color: .brown, outline: stateOutlineSymbol)
        // Create the unique values for each region.        let pacificValue = UniqueValue(description: "Pacific Region", label: "Pacific", symbol: pacificFillSymbol, values: ["Pacific"])        let mountainValue = UniqueValue(description: "Rocky Mountain Region", label: "Mountain", symbol: mountainFillSymbol, values: ["Mountain"])        let westSouthCentralValue = UniqueValue(            description: "West South Central Region",            label: "West South Central",            symbol: westSouthCentralFillSymbol,            values: ["West South Central"]        )
        // Create the default region fill symbol for regions not explicitly defined in the renderer.        let defaultFillSymbol = SimpleFillSymbol(style: .cross, color: .gray)
        return UniqueValueRenderer(            fieldNames: ["SUB_REGION"],            uniqueValues: [pacificValue, mountainValue, westSouthCentralValue],            defaultLabel: "Other",            defaultSymbol: defaultFillSymbol        )    }
    var body: some View {        // Create a map view to display the map.        MapView(map: map)    }}
#Preview {    ApplyUniqueValueRendererView()}