A renderer allows you to change the style of all graphics in a graphics overlay by referencing a single symbol style. A renderer will only affect graphics that do not specify their own symbol style.
Use case
A renderer allows you to change the style of all graphics in an overlay by only changing one copy of the symbol. For example, a user may wish to display a number of graphics on a map of parkland which represent trees, all sharing a common symbol.
How to use the sample
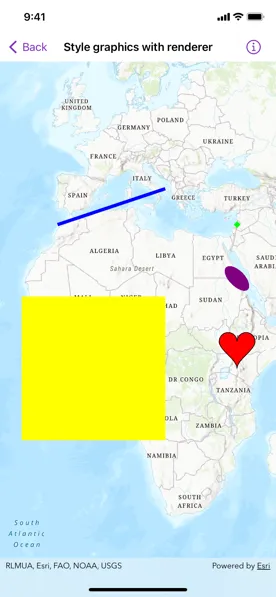
Pan and zoom on the map to view graphics for points, lines, and polygons (including polygons with curve segments), which are stylized using renderers.
How it works
- Create a
Graphic, specifying only aGeometry. - Create a
GraphicsOverlaywith the graphic. - Create a
Symbolsuch as aSimpleMarkerSymbol. - Create a renderer with
SimpleRenderer(symbol:), passing in aSymbol. - Set the renderer for the graphics overlay.
Relevant API
- CubicBezierSegment
- EllipticArcSegment
- GeodesicEllipseParameters
- Geometry
- Graphic
- GraphicsOverlay
- MutablePart
- Polygon
- Polyline
- SimpleFillSymbol
- SimpleLineSymbol
- SimpleMarkerSymbol
- SimpleRenderer
- static GeometryEngine.geodesicEllipse(parameters:)
Additional information
To set unique symbols across a number of graphics (e.g. showing graphics of individual landmarks), see “Style graphics with symbols” sample.
Tags
arc, bezier, curve, display, ellipse, graphics, marker, overlay, renderer, segment, symbol, true curve
Sample code
// Copyright 2022 Esri//// Licensed under the Apache License, Version 2.0 (the "License");// you may not use this file except in compliance with the License.// You may obtain a copy of the License at////   https://www.apache.org/licenses/LICENSE-2.0//// Unless required by applicable law or agreed to in writing, software// distributed under the License is distributed on an "AS IS" BASIS,// WITHOUT WARRANTIES OR CONDITIONS OF ANY KIND, either express or implied.// See the License for the specific language governing permissions and// limitations under the License.
import ArcGISimport SwiftUI
struct StyleGraphicsWithRendererView: View {    /// The view model for the sample.    @StateObject private var model = Model()
    var body: some View {        MapView(map: model.map, graphicsOverlays: model.graphicsOverlays)    }}
private extension StyleGraphicsWithRendererView {    /// The model used to store the geo model and other expensive objects    /// used in this view.    class Model: ObservableObject {        /// A map with a topographic basemap style and an initial viewpoint.        let map: Map = {            let map = Map(basemapStyle: .arcGISTopographic)            map.initialViewpoint = Viewpoint(center: Point(x: 20e5, y: 20e5, spatialReference: .webMercator), scale: 7e7)            return map        }()
        /// The graphics overlays used in this sample.        var graphicsOverlays: [GraphicsOverlay] {            return [                pointGraphicsOverlay,                lineGraphicsOverlay,                squarePolygonGraphicsOverlay,                ellipseGraphicsOverlay,                curvedPolygonGraphicsOverlay            ]        }
        /// The graphics overlay rendering a point.        private let pointGraphicsOverlay: GraphicsOverlay = {            // Creates a simple marker symbol.            let symbol = SimpleMarkerSymbol(style: .diamond, color: .green, size: 10)            // Creates the geometry for the point.            let geometry = Point(x: 40e5, y: 40e5, spatialReference: .webMercator)
            // Creates a graphics overlay containing a graphic with the point geometry.            let overlay = GraphicsOverlay(graphics: [Graphic(geometry: geometry)])            // Creates and assigns a simple renderer to the graphics overlay.            overlay.renderer = SimpleRenderer(symbol: symbol)            return overlay        }()
        /// The graphics overlay rendering a line.        private let lineGraphicsOverlay: GraphicsOverlay = {            // Creates a simple line symbol.            let symbol = SimpleLineSymbol(style: .solid, color: .blue, width: 5)            // Creates the geometry for the line.            let geometry = Polyline(                points: [                    Point(x: -10e5, y: 40e5),                    Point(x: 20e5, y: 50e5)                ],                spatialReference: .webMercator            )
            // Creates a graphics overlay containing a graphic with the line geometry.            let overlay = GraphicsOverlay(graphics: [Graphic(geometry: geometry)])            // Creates and assigns a simple renderer to the graphics overlay.            overlay.renderer = SimpleRenderer(symbol: symbol)            return overlay        }()
        /// The graphics overlay rendering a square polygon.        private let squarePolygonGraphicsOverlay: GraphicsOverlay = {            // Creates a simple fill symbol.            let symbol = SimpleFillSymbol(color: .yellow)            // Creates the geometry for the square polygon.            let geometry = Polygon(                points: [                    Point(x: -20e5, y: 20e5),                    Point(x: 20e5, y: 20e5),                    Point(x: 20e5, y: -20e5),                    Point(x: -20e5, y: -20e5)                ],                spatialReference: .webMercator            )
            // Creates a graphics overlay containing a graphic with the square geometry.            let overlay = GraphicsOverlay(graphics: [Graphic(geometry: geometry)])            // Creates and assigns a simple renderer to the graphics overlay.            overlay.renderer = SimpleRenderer(symbol: symbol)            return overlay        }()
        /// The graphics overlay rendering an ellipse.        private let ellipseGraphicsOverlay: GraphicsOverlay = {            // Creates a simple fill symbol.            let symbol = SimpleFillSymbol(color: .purple)            // Defines the center point of the ellipse.            let center = Point(x: 40e5, y: 25e5, spatialReference: .webMercator)            // Creates the parameters for the ellipse.            let parameters = GeodesicEllipseParameters<ArcGIS.Polygon>(                axisDirection: -45,                center: center,                linearUnit: .kilometers,                maxPointCount: 100,                maxSegmentLength: 20,                semiAxis1Length: 200,                semiAxis2Length: 400            )            // Creates the geometry for the ellipse from the parameters.            let geometry = GeometryEngine.geodesicEllipse(parameters: parameters)
            // Creates a graphics overlay containing a graphic with the ellipse geometry.            let overlay = GraphicsOverlay(graphics: [Graphic(geometry: geometry)])            // Creates and assigns a simple renderer to the graphics overlay.            overlay.renderer = SimpleRenderer(symbol: symbol)            return overlay        }()
        /// The graphics overlay rendering a curved polygon.        private let curvedPolygonGraphicsOverlay: GraphicsOverlay = {            // Creates a simple fill symbol with an outline.            let lineSymbol = SimpleLineSymbol(style: .solid, color: .black, width: 1)            let fillSymbol = SimpleFillSymbol(color: .red, outline: lineSymbol)            // Defines the point of origin for the curved polygon.            let origin = Point(x: 40e5, y: 5e5, spatialReference: .webMercator)            // Creates a heart-shaped polygon.            let heartPolygon = makeHeartPolygon(center: origin, sideLength: 10e5)
            // Creates a graphics overlay containing a graphic with the polygon geometry.            let overlay = GraphicsOverlay(graphics: [Graphic(geometry: heartPolygon)])            // Creates and assigns a simple renderer to the graphics overlay.            overlay.renderer = SimpleRenderer(symbol: fillSymbol)            return overlay        }()
        /// Creates a heart-shaped polygon with Bezier and elliptic arc segments.        /// - Parameters:        ///   - center: The center of the square that contains the heart shape.        ///   - sideLength: The side length of the square.        /// - Returns: A heart-shaped polygon.        private static func makeHeartPolygon(center: Point, sideLength: Double) -> ArcGIS.Polygon? {            guard sideLength > 0 else { return nil }            let spatialReference = center.spatialReference            // Defines the x and y coordinates to simplify the calculation.            let minX = center.x - sideLength * 0.5            let minY = center.y - sideLength * 0.5            // Defines the radius of the arcs.            let arcRadius = sideLength * 0.25
            // Creates the bottom left curve segment.            let leftCurveStart = Point(x: center.x, y: minY, spatialReference: spatialReference)            let leftCurveEnd = Point(x: minX, y: minY + sideLength * 0.75, spatialReference: spatialReference)            let leftControlPoint1 = Point(x: center.x, y: minY + sideLength * 0.25, spatialReference: spatialReference)            let leftControlPoint2 = Point(x: minX, y: center.y, spatialReference: spatialReference)            let leftCurve = CubicBezierSegment(                startPoint: leftCurveStart,                controlPoint1: leftControlPoint1,                controlPoint2: leftControlPoint2,                endPoint: leftCurveEnd,                spatialReference: spatialReference            )
            // Creates the top left arc segment.            let leftArcCenter = Point(x: minX + sideLength * 0.25, y: minY + sideLength * 0.75, spatialReference: spatialReference)            let leftArc = EllipticArcSegment.makeCircular(                centerPoint: leftArcCenter,                radius: arcRadius,                startAngle: .pi,                centralAngle: -.pi,                spatialReference: spatialReference            )
            // Creates the top right arc segment.            let rightArcCenter = Point(x: minX + sideLength * 0.75, y: minY + sideLength * 0.75, spatialReference: spatialReference)            let rightArc = EllipticArcSegment.makeCircular(                centerPoint: rightArcCenter,                radius: arcRadius,                startAngle: .pi,                centralAngle: -.pi,                spatialReference: spatialReference            )
            // Creates the bottom right curve segment.            let rightCurveStart = Point(x: minX + sideLength, y: minY + sideLength * 0.75, spatialReference: spatialReference)            let rightCurveEnd = leftCurveStart            let rightControlPoint1 = Point(x: minX + sideLength, y: center.y, spatialReference: spatialReference)            let rightControlPoint2 = leftControlPoint1            let rightCurve = CubicBezierSegment(                startPoint: rightCurveStart,                controlPoint1: rightControlPoint1,                controlPoint2: rightControlPoint2,                endPoint: rightCurveEnd,                spatialReference: spatialReference            )
            // Creates and returns the heart polygon.            return Polygon(parts: [MutablePart(segments: [leftCurve, leftArc, rightArc, rightCurve], spatialReference: spatialReference)])        }    }}
#Preview {    StyleGraphicsWithRendererView()}