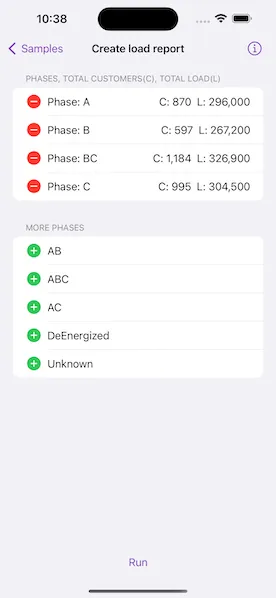
Create a simple electric distribution report that displays the count of customers and total load per phase by tracing downstream from a given point.
Use case
You can use a load report to display the customers per phase as well as the load per phase based on a chosen starting point in a utility network. Load reports are used for electric load restoration and balancing.
How to use the sample
Choose phases to be included in the report. Tap “Run” to initiate a downstream trace on the network and create a load report.
How it works
- Create and load a
UtilityNetworkwith aServiceGeodatabasefrom a feature service URL, then get an asset type, tier, network attributes, and category by their names. - Create a
UtilityElementfrom the asset type to use as the starting location for the trace. - Get a base condition by calling the utility tier’s
makeDefaultTraceConfigurationmethod. - Create
UtilityTraceParameterspassing indownstreamtrace type and the default starting location. Set itstraceConfigurationproperty with the trace configuration above, and setincludesBarrierstofalse. - Create a
UtilityCategoryComparisonwhere “ServicePoint” category exists. - Reset the
functionsproperty of the trace configuration with a newUtilityTraceFunctionadding a “Service Load” network attribute where this category comparison applies. This will limit the function results. - Set
outputConditionwith this category comparison to limit the element results. - Populate the choice list for phases using the network attribute’s
codedValuesproperty. - When the “Add” button is tapped, add the selected phase to a phases list.
- When the “Run” button is tapped, run a trace for every
CodedValuein the phases list. Do this by creating anUtilityTraceOrConditionwith the base condition and anUtilityNetworkAttributeComparisonwhere the “Phases Current” network attribute does not include the coded value. - Display the count of “Total Customers” using the
elementsproperty of the result, and the result of “Total Load” using the first and only output infunctionOutputsproperty.
Relevant API
- UtilityAssetType
- UtilityCategoryComparison
- UtilityDomainNetwork
- UtilityElement
- UtilityElementTraceResult
- UtilityNetwork
- UtilityNetworkAttribute
- UtilityNetworkAttributeComparison
- UtilityNetworkDefinition
- UtilityNetworkSource
- UtilityTerminal
- UtilityTier
- UtilityTraceConfiguration
- UtilityTraceFunction
- UtilityTraceParameters
- UtilityTraceResult
- UtilityTraceType
- UtilityTraversability
Tags
condition barriers, downstream trace, network analysis, subnetwork trace, trace configuration, traversability, upstream trace, utility network, validate consistency
Sample code
// Copyright 2023 Esri//// Licensed under the Apache License, Version 2.0 (the "License");// you may not use this file except in compliance with the License.// You may obtain a copy of the License at////   https://www.apache.org/licenses/LICENSE-2.0//// Unless required by applicable law or agreed to in writing, software// distributed under the License is distributed on an "AS IS" BASIS,// WITHOUT WARRANTIES OR CONDITIONS OF ANY KIND, either express or implied.// See the License for the specific language governing permissions and// limitations under the License.
import SwiftUI
struct CreateLoadReportView: View {    /// The view model for the sample.    @StateObject private var model = Model()
    var body: some View {        LoadReportView(model: model)            .task {                await model.setup()            }            .errorAlert(presentingError: $model.error)            .toolbar {                ToolbarItem(placement: .bottomBar) {                    Button("Run") {                        Task {                            await model.createLoadReport()                        }                    }                    .disabled(!model.allowsCreateLoadReport)                }            }            .overlay(alignment: .center) {                if let status = model.statusText {                    ZStack {                        Color.clear.background(.ultraThinMaterial)                        VStack {                            Text(status)                            ProgressView()                                .progressViewStyle(.circular)                        }                        .padding()                        .background(.ultraThickMaterial)                        .clipShape(.rect(cornerRadius: 10))                        .shadow(radius: 50)                    }                }            }            .onTeardown {                model.tearDown()            }    }}
#Preview {    NavigationStack {        CreateLoadReportView()    }}
// Copyright 2023 Esri//// Licensed under the Apache License, Version 2.0 (the "License");// you may not use this file except in compliance with the License.// You may obtain a copy of the License at//// https://www.apache.org/licenses/LICENSE-2.0//// Unless required by applicable law or agreed to in writing, software// distributed under the License is distributed on an "AS IS" BASIS,// WITHOUT WARRANTIES OR CONDITIONS OF ANY KIND, either express or implied.// See the License for the specific language governing permissions and// limitations under the License.
import ArcGISimport Combineimport Foundation
extension CreateLoadReportView { /// The model used to store the geo model and other expensive objects /// used in this view. @MainActor class Model: ObservableObject { // MARK: Properties /// An electric utility network in Naperville, Illinois. private let utilityNetwork = UtilityNetwork(serviceGeodatabase: .naperville())
/// The initial conditional expression. private var initialExpression: UtilityTraceConditionalExpression?
/// The trace parameters for creating load reports. private var traceParameters: UtilityTraceParameters?
/// The network attributes for the comparison. private var phasesNetworkAttribute: UtilityNetworkAttribute?
/// A list of possible phases populated from the network's attributes. /// By default, they are not included in the load report. @Published private(set) var excludedPhases: [CodedValue] = []
/// A list of phases that are included in the load report. @Published private(set) var includedPhases: [CodedValue] = [] { didSet { updateAllowsCreateLoadReport() } }
/// A list of possible phases populated from the network's attributes. private var allPhases: [CodedValue] = []
/// The phase summaries in the load report. private var summaries = PhaseSummaries()
/// A Boolean value indicating if the load report can be generated. @Published private(set) var allowsCreateLoadReport = false
/// The status text to display to the user. @Published private(set) var statusText: String?
/// An error that occurred during setup. private(set) var setupError: (any Error)? { didSet { updateAllowsCreateLoadReport() error = setupError } }
/// The error shown in the error alert. @Published var error: (any Error)?
// MARK: Methods
/// Updates the Boolean value indicating if the load report can be generated. private func updateAllowsCreateLoadReport() { allowsCreateLoadReport = setupError == nil && !includedPhases.isEmpty }
/// Performs important tasks including adding credentials, loading the utility network and setting trace parameters. func setup() async { do { try await ArcGISEnvironment.authenticationManager.arcGISCredentialStore.add(.publicSample) try await setupTraceParameters() } catch { setupError = error } }
/// Loads the utility network and sets up the trace parameters and other information /// used for running this sample. private func setupTraceParameters() async throws { defer { statusText = nil } statusText = "Loading utility network"
try await utilityNetwork.load()
statusText = "Setting up trace parameters"
let startingLocation = try makeStartingLocation() // Get the base condition and trace configuration from a default tier. let traceConfiguration = try getTraceConfiguration()
// Set the default expression. initialExpression = traceConfiguration.traversability?.barriers as? UtilityTraceConditionalExpression
// Create downstream trace parameters with elements and function outputs. let traceParameters = UtilityTraceParameters(traceType: .downstream, startingLocations: [startingLocation]) traceParameters.addResultTypes([.elements, .functionOutputs])
guard let definition = utilityNetwork.definition else { throw SetupError() }
guard // The service category for counting total customers. let serviceCategory = definition.categories.first(where: { $0.name == "ServicePoint" }), // The load attribute for counting total load. let loadAttribute = definition.networkAttributes.first(where: { $0.name == "Service Load" }), // The phase attribute for getting total phase current load. let phasesNetworkAttribute = definition.networkAttributes.first(where: { $0.name == "Phases Current" }) else { throw SetupError() }
self.phasesNetworkAttribute = phasesNetworkAttribute
// Get possible coded phase values from the attributes. guard let domain = phasesNetworkAttribute.domain as? CodedValueDomain else { throw SetupError() } excludedPhases = domain.codedValues.sorted { $0.name < $1.name } allPhases = excludedPhases
// Create a comparison to check the existence of service points. let serviceCategoryComparison = UtilityCategoryComparison( category: serviceCategory, operator: .exists ) let addLoadAttributeFunction = UtilityTraceFunction( functionType: .add, networkAttribute: loadAttribute, condition: serviceCategoryComparison ) // Create function input and output condition. traceConfiguration.addFunction(addLoadAttributeFunction) traceConfiguration.outputCondition = serviceCategoryComparison // Set to false to ensure that service points with incorrect phasing // (which therefore act as barriers) are not counted with results. traceConfiguration.includesBarriers = false // Assign the trace configuration to trace parameters. traceParameters.traceConfiguration = traceConfiguration self.traceParameters = traceParameters }
/// When the utility network is loaded, create a `UtilityElement` /// from the asset type to use as the starting location for the trace. private func makeStartingLocation() throws -> UtilityElement { // Constants for creating the default starting location. let networkSourceName = "Electric Distribution Device" let assetGroupName = "Circuit Breaker" let assetTypeName = "Three Phase" let terminalName = "Load" let globalID = UUID(uuidString: "1CAF7740-0BF4-4113-8DB2-654E18800028")!
// Create a default starting location. if let networkSource = utilityNetwork.definition?.networkSource(named: networkSourceName), let assetType = networkSource.assetGroup(named: assetGroupName)?.assetType(named: assetTypeName), let startingLocation = utilityNetwork.makeElement(assetType: assetType, globalID: globalID) { // Set the terminal for the location. (For our case, use the "Load" terminal.) startingLocation.terminal = assetType.terminalConfiguration?.terminals.first(where: { $0.name == terminalName }) return startingLocation } else { throw SetupError() } }
/// Gets the utility tier's trace configuration. private func getTraceConfiguration() throws -> UtilityTraceConfiguration { // Get a default trace configuration from a tier in the network. if let configuration = utilityNetwork .definition? .domainNetwork(named: "ElectricDistribution")? .tier(named: "Medium Voltage Radial")? .defaultTraceConfiguration { return configuration } else { throw SetupError() } }
/// Creates the load report. /// - Precondition: `allowsCreateLoadReport` func createLoadReport() async { precondition(allowsCreateLoadReport) allowsCreateLoadReport = false defer { updateAllowsCreateLoadReport() }
guard let phasesNetworkAttribute, let initialExpression, let traceParameters else { preconditionFailure() }
statusText = "Creating load report" defer { statusText = nil }
do { for phase in includedPhases { guard let phaseCode = phase.code else { continue }
// Create a conditional expression. let phasesAttributeComparison = UtilityNetworkAttributeComparison( networkAttribute: phasesNetworkAttribute, operator: .doesNotIncludeAny, value: phaseCode )! // Chain it with the base condition using an OR operator. traceParameters.traceConfiguration?.traversability?.barriers = UtilityTraceOrCondition( leftExpression: initialExpression, rightExpression: phasesAttributeComparison )
let traceResults = try await utilityNetwork.trace(using: traceParameters)
var totalCustomers = 0 var totalLoad = 0
for result in traceResults { switch result { case let elementResult as UtilityElementTraceResult: // Get the unique customers count. totalCustomers = Set(elementResult.elements.map(\.objectID)).count case let functionResult as UtilityFunctionTraceResult: // Get the total load with a function output. totalLoad = Int(functionResult.functionOutputs[1].result as! Double) default: break } } summaries.setSummary( PhaseSummary( totalCustomers: totalCustomers, totalLoad: totalLoad ), forPhase: phase ) } } catch { // On error, remove any summaries already generated. summaries.removeAll() self.error = error } }
/// Adds the provided phase to the included phases. /// - Parameter phase: The phase to add. func addPhase(_ phase: CodedValue) { includedPhases.append(phase) excludedPhases = excludedPhases.filter { $0.name != phase.name } sortPhases() }
/// Deletes the provided phase from the included phases. /// - Parameter phase: The phase to delete. func deletePhase(_ phase: CodedValue) { excludedPhases.append(phase) includedPhases = includedPhases.filter { $0.name != phase.name } sortPhases() summaries.removeSummary(forPhase: phase) }
/// Deletes the provided phase from the included phases. /// - Parameter indexSet: The index set corresponding to the phase to delete. func deletePhase(atOffsets indexSet: IndexSet) { guard let index = indexSet.first else { return } deletePhase(includedPhases[index]) }
/// Sorts the included and excluded phases by name. private func sortPhases() { includedPhases.sort { $0.name < $1.name } excludedPhases.sort { $0.name < $1.name } }
/// Creates a summary for the provided phase. /// - Parameter phase: The phase to generate a summary for. /// - Returns: A string representing the summary for the provided phase. func summaryForPhase(_ phase: CodedValue) -> String { let format: IntegerFormatStyle<Int> = .number if let summary = summaries.summary(forPhase: phase) { return "C: \(summary.totalCustomers.formatted(format)) L: \(summary.totalLoad.formatted(format))" } else { return "N/A" } }
/// Cleans up the model's setup. func tearDown() { ArcGISEnvironment.authenticationManager.arcGISCredentialStore.removeAll() } }}
private extension ArcGISCredential { /// The public credentials for the data in this sample. /// - Note: Never hardcode login information in a production application. This is done solely /// for the sake of the sample. static var publicSample: ArcGISCredential { get async throws { try await TokenCredential.credential( for: .utilityNetwork, username: "viewer01", password: "I68VGU^nMurF" ) } }}
private extension CreateLoadReportView { /// A struct for the phase summary, which contains the total customers /// and total load for the phase. struct PhaseSummary { let totalCustomers: Int let totalLoad: Int }
/// A struct for the load report's phase summaries. struct PhaseSummaries { private var storage: [ObjectIdentifier: PhaseSummary] = [:]
/// Sets the summary for a phase. /// - Parameters: /// - summary: The summary for the phase. /// - phase: The phase to set the summary for. mutating func setSummary(_ summary: PhaseSummary, forPhase phase: CodedValue) { storage[ObjectIdentifier(phase)] = summary }
/// Gets the summary for a phase. /// - Parameter phase: The phase to get the summary for. /// - Returns: The summary for the given phase. mutating func summary(forPhase phase: CodedValue) -> PhaseSummary? { storage[ObjectIdentifier(phase)] }
/// Removes a phase summary. /// - Parameter phase: The phase to remove from the load report. mutating func removeSummary(forPhase phase: CodedValue) { storage[ObjectIdentifier(phase)] = nil }
/// Removes all phase summaries. mutating func removeAll() { storage.removeAll() } }}
private extension CreateLoadReportView.Model { /// An error returned when data required to setup the sample cannot be found. struct SetupError: LocalizedError { var errorDescription: String? { return NSLocalizedString( "Cannot find data required to setup the sample.", comment: "Error thrown when the setup for the sample fails." ) } }}
private extension URL { /// The utility network for this sample. static var utilityNetwork: URL { URL(string: "https://sampleserver7.arcgisonline.com/server/rest/services/UtilityNetwork/NapervilleElectric/FeatureServer")! }}
private extension ServiceGeodatabase { /// The Naperville, Illinois electric utility network service geodatabase. static func naperville() -> ServiceGeodatabase { .init(url: .utilityNetwork) }}// Copyright 2023 Esri//// Licensed under the Apache License, Version 2.0 (the "License");// you may not use this file except in compliance with the License.// You may obtain a copy of the License at//// https://www.apache.org/licenses/LICENSE-2.0//// Unless required by applicable law or agreed to in writing, software// distributed under the License is distributed on an "AS IS" BASIS,// WITHOUT WARRANTIES OR CONDITIONS OF ANY KIND, either express or implied.// See the License for the specific language governing permissions and// limitations under the License.
import ArcGISimport SwiftUI
extension CreateLoadReportView { struct LoadReportView: View { /// The view model for the sample. @ObservedObject var model: Model
var body: some View { Form { Section("Phases, Total Customers(C), Total Load(L)") { ForEach(model.includedPhases, id: \.name) { phase in HStack { Image(systemName: "minus.circle.fill") .foregroundStyle(.red) .imageScale(.large) .clipped() .onTapGesture { model.deletePhase(phase) } LabeledContent( "Phase: \(phase.name)", value: model.summaryForPhase(phase) ) } } .onDelete { indexSet in model.deletePhase(atOffsets: indexSet) } } if !model.excludedPhases.isEmpty { Section("More Phases") { ForEach(model.excludedPhases, id: \.name) { phase in HStack { Image(systemName: "plus.circle.fill") .foregroundStyle(.green) .imageScale(.large) .clipped() Text(phase.name) } .onTapGesture { model.addPhase(phase) } } } } } } }}