June 2026
ParquetLayer updates and performance optimizations
ParquetLayer (beta) now supports Spatially Optimized Parquet files, which use spatial clustering and a multi-scale index to efficiently stream only the data required for visualization. This reduces data transfer and significantly improves rendering performance for large datasets. Spatially Optimized Parquet files can be authored with GeoAnalytics Engine or Data Pipelines. Learn more in the Spatially Optimized Parquet blog post.
ParquetLayer queries have been overhauled to improve performance. The layer now defers full feature downloads until after predicate evaluation when possible, uses file statistics where available, and includes reworked query logic to better support direct pagination.
This release also removes several previous ParquetLayer limitations. The layer now supports definitionExpression for filtering data directly on the layer, along with advanced querying using statistics and returnDistinctValues. Instead of returning only the topmost feature, ParquetLayer hitTest now returns all hit features and supports the new rectangle hit target.
Advanced symbology from ArcGIS Pro
Scale based rendering
The new alternateSymbols property on UniqueValueInfo and ClassBreakInfo allows you to specify an array of symbols to be used for scale-based rendering in UniqueValueRenderer and ClassBreaksRenderer.
To enable scale based rendering, the symbol on the renderer must be a CIMSymbol with a minScale or maxScale defined.
When the view is zoomed beyond the symbol’s minScale or maxScale, the renderer will use the next symbol in the alternateSymbols array that meets the scale criteria.
This provides a more efficient way to render large datasets at smaller scales without having to create multiple renderers with different scale dependencies.
Symbol layer drawing
Feature Layer now supports symbol layer drawing, which allows you to override the default drawing order of CIMSymbols in a 2D map. When symbols have more than one symbol layer (such as a cased road symbol), symbol layer drawing can also control how those individual symbol layers are ordered across symbol classes.
| Default draw order | Symbol layer drawing enabled |
|---|---|
 |  |
Editing and sketch improvements
Editor support for attachment elements
This release introduces support for attachment elements directly within the Editor’s editing experience. Attachments can now be configured as part of a feature layer’s FormTemplate, rather than being managed through a separate attachments panel.
Attachment input behavior is defined using AttachmentInput and supported input types, including ImageInput, DocumentInput, AudioInput, and VideoInput. This enables attachments to be authored alongside other form elements with support for custom placement and element-level constraints.
Previously, the Editor handled attachments through an embedded UI separate from the form definition. With attachment elements, attachment authoring is now integrated into the same configurable form experience, allowing attachment management to follow the overall form layout and behavior.
For a list of known limitations, please refer to the AttachmentElement API reference.
Support for multiple-choice form inputs
This release adds support for multiple choice inputs in a feature layer’s form template used directly within Editor. Authors are able to configure field elements with a selectable list of options that supports one or more selections. This functionality expands form editing capabilities and improves editing workflows for data collection, inspection, survey, and classification use cases.
Support for segment labels
Sketch and Editor were enhanced to support SketchLabelOptions in 2D. Now, users can display segment length labels while drawing or editing polyline and polygon geometries. This feature is already supported in 3D workflows.
Support for a new tangent curve tool
Sketch and Editor were enhanced to support tangent curve segments. A tangent curve is a circular arc segment that passes through an endpoint where the tangent line and existing line segment meet. This new curve segment tool is available when creating polyline or polygon geometries.
Animations along a line (beta)
This release adds support for a new beta CIMSymbol animation type, CIMSymbolAnimationMoveAlongLine, which animates markers along line geometry.
This can be used to create dynamic visualizations of movement, such as vehicles traveling along a route or flowing traffic patterns.
The new animation type supports both distance-based and speed-based motion, so you can either define how far markers travel or how fast they move.
The continuous property can automatically compute duration from speed to create smooth, seamless looping motion.
Explore the move along line animation in the Route with animated lines sample.
Support for m and z values in 2D
Support for m and z values in FeatureLayers with 2D maps has been added this release. When visualization depends on these values, such as for milepost labels along roads or asset elevation in popups, 2D rendering queries now fetch m and z values and make them available on client-side feature geometries.
If m and z values are used for rendering, e.g. labeling, then the values are automatically fetched. Alternatively, the returnM and returnZ properties on the layer can be set to force fetching the m and z values to allow access to these values in LayerView queries. For display consistency, user visible z-values in 2D are automatically scaled to the linear unit of the maps’s horizontal coordinate system, including when shown in labels and popups.
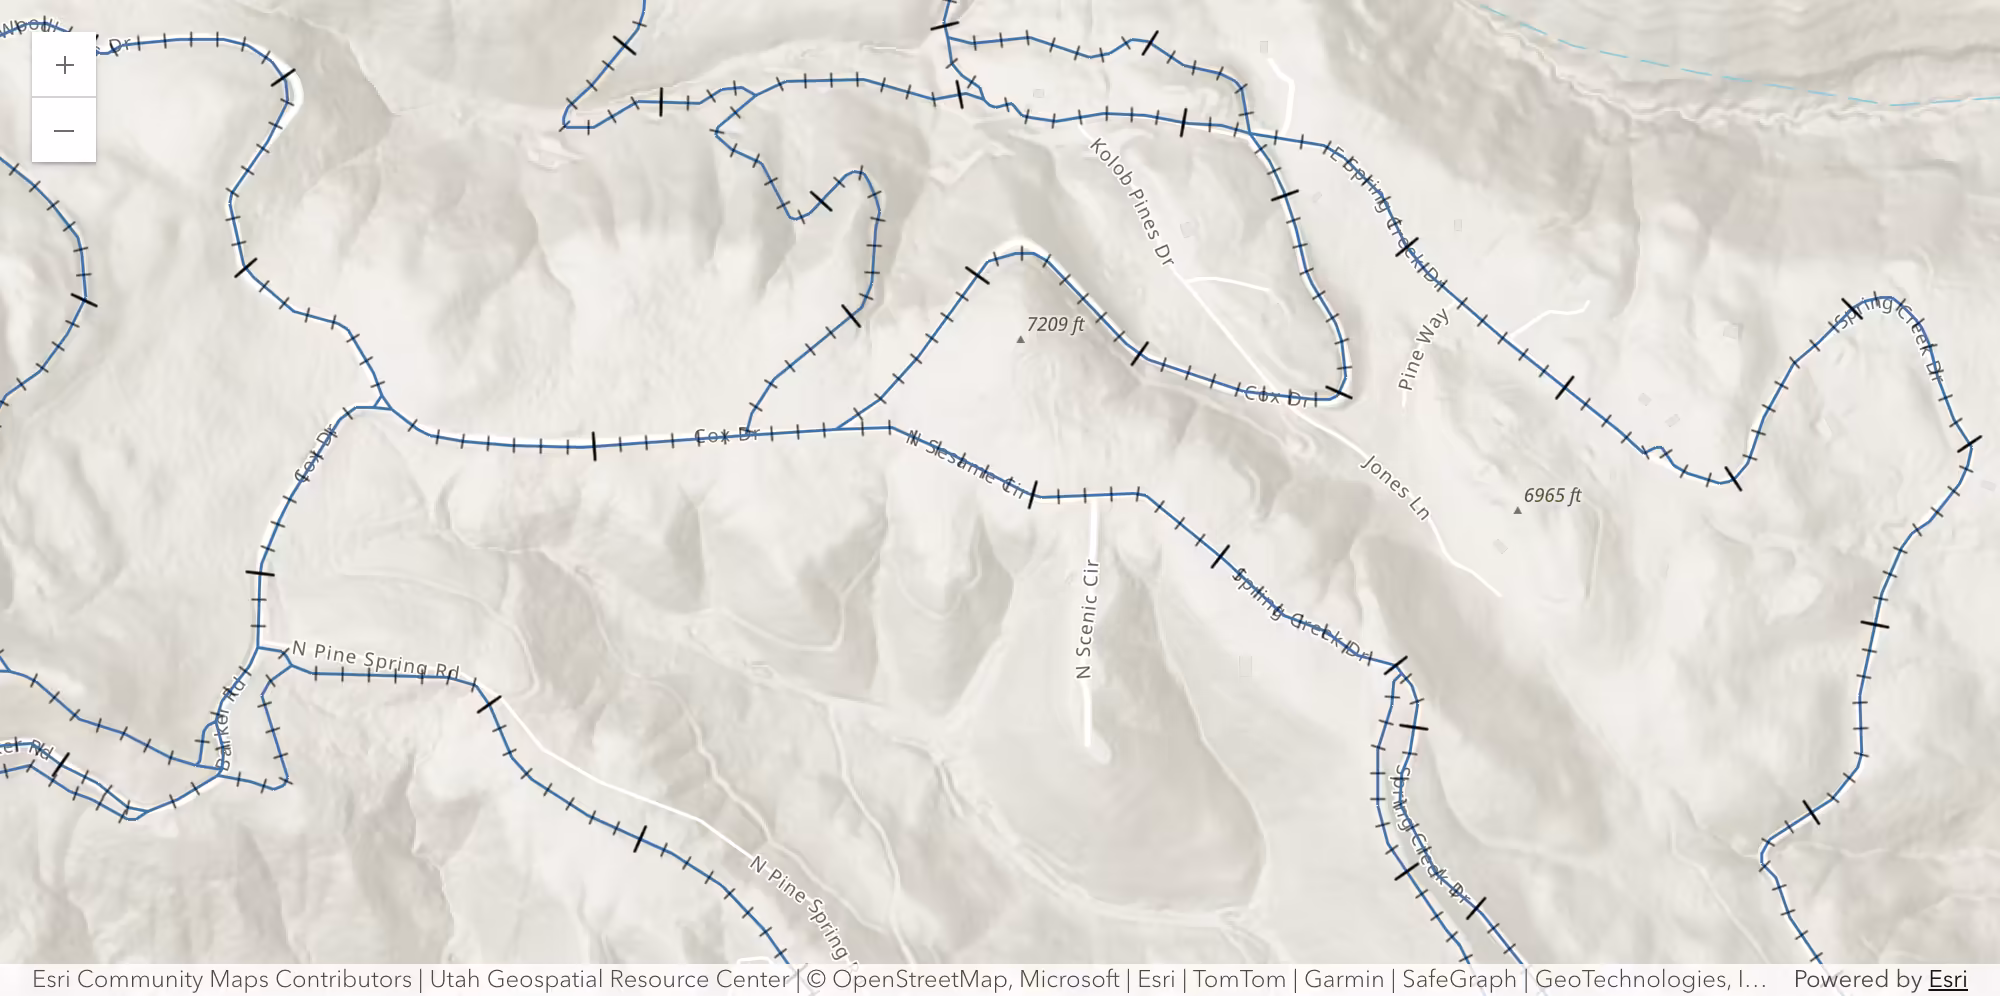
Marker placement at measured units
The new marker placement type in CIMSymbol, CIMMarkerPlacementAtMeasuredUnits, allows for placing markers along a line at interpolated M values.
This placement type is useful for visualizing features such as mile markers or distance-based events along a route.
The underlying geometry must have M values for this placement type to work, and the markers will be placed at the specified intervals along the line based on those M values.
The image below shows two marker placements - the larger tick is placed every 200 meters, while the smaller tick is placed every 25 meters.
Hit test by screen rectangle (beta)
The map component’s hitTest() method now accepts a screen rectangle as a hitTarget, enabling area-based hit testing in addition to point-based interaction. This returns features that intersect the specified screen rectangle across layers, making it easier to support workflows such as drag-to-select and area inspection. Using a screen rectangle for hit testing is in beta this release.
ImageryLayer and ImageryTileLayer are now also included in hit results as the new type RasterHit, so imagery content participates in the same interactive hit test workflows as other layer types. Explore this new feature in the hit test features by screen rectangle sample.
Fetch popup features from the view
The new fetchPopupFeatures() method on Map, Scene, and Link Chart components allows you to fetch features directly from the view. With fetchPopupFeatures(), you can simply provide a screen point or screen rectangle (beta), and features will be returned for all layers in the view that intersect that area and have a popup template. Using a screen rectangle with fetchPopupFeatures() is a beta feature this release. This enhances workflows such as custom hit testing, hover interactions, and other cases where you want to fetch features for a specific area of the view without needing to utilize the fetchFeatures() method on the Popup or Features component.
3D analysis support for Gaussian Splat layers
Gaussian Splat layers now support additional 3D analysis capabilities, bringing them closer to parity with other 3D layer types. The layer can be interactively explored using clipping areas and slice, and now also contributes to line of sight analysis and elevation profiles. This extends both visual inspection and analysis workflows for Gaussian Splat content in complex 3D scenes.
Gaussian Splat layers also participate in scene shadows, and apply smooth fading during navigation and interaction, improving visual integration and continuity in the scene. Work is ongoing to extend support to additional analysis tools such as shadow cast, viewshed, and volume measurement.
Improved 3D polygon tessellation
SceneView now renders complex polygon graphics more consistently with MapView. Polygon fill, extrude, and water symbols
use improved 3D tessellation utilities that better handle polygons with multiple rings, holes, or self-intersections.
This fixes cases where holes were filled, polygons disappeared, or outlines rendered without the expected fill in 3D.
Load 3D Tiles in Projected Coordinate Systems
IntegratedMesh3DTilesLayers can now be loaded in any spatial reference, offering unprecedented flexibility for 3D Tiles content. This is enabled through the Esri_crs extension. With this extension, a 3D Tiles layer can be authored for a specific projected coordinate system (PCS) and drawn in a local 3D SceneView with that same PCS. The layer can still always be drawn in a global 3D SceneView.
Accessibility and localization improvements
Labeling font support in 2D
We added support for more fonts, including specialized support for languages with complex glyphs and shapes. To maximize readability, especially for visually impaired users, we added support for the Atkinson Hyperlegible font.
For languages with complex glyphs and shapes, we added initial support with the following fonts (future releases may see additional fonts supported): Noto Sans Khmer Bold, Noto Sans Khmer Regular, Noto Sans Lao Bold, Noto Sans Lao Regular,
Noto Sans Myanmar Bold, Noto Sans Myanmar Regular, Noto Sans Thai Bold, and Noto Sans Thai Regular.
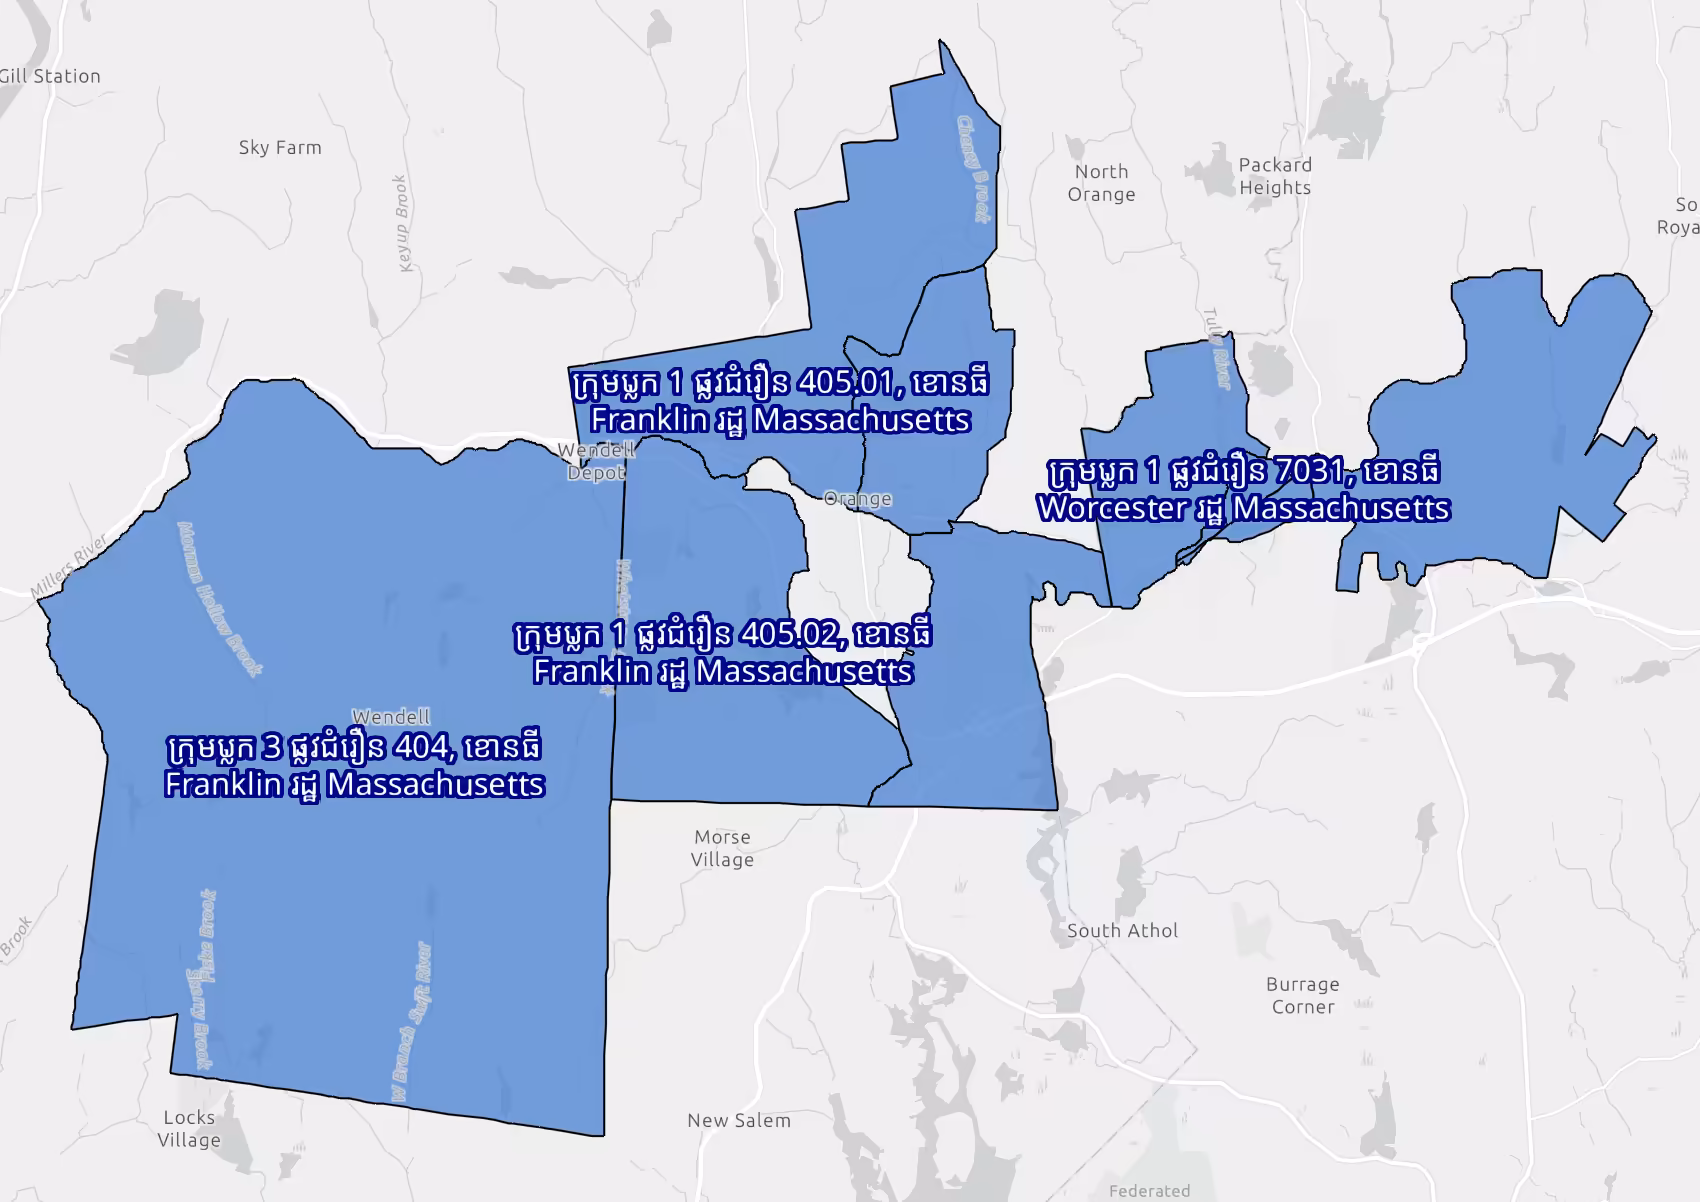
See the updated Labeling guide page for more information and a complete list of supported fonts.
Dynamic announcements and focus management
The Bookmarks and Search components now announce dynamic changes during interactions to assistive technologies. The components provide crucial context changes letting the user know the interaction has occurred in the user interface. For instance, when interacting with a bookmark assistive technologies will be notified that a bookmark selection has occurred. The announcements ensure important information is communicated to more audiences, and are provided as string translations supporting multiple locales.
Additionally, focus enhancements were added to the Popup component upon opening. For instance, when a result is selected from the Search component, focus shifts from the Search component to the Popup component. Once the Popup is closed, focus returns to the Search component. The focus behavior can be disabled when specifying the Popup’s focusTrapDisabled property.
AI components and agents
The latest version of the ArcGIS Assistant (beta) includes the following enhancements:
- Performance improvements: Added a new
fastmodel tier (GPT-5.4-nano) and optimized several built-in agents for quicker, lower-cost responses. - Knowledge Agent: Added a new agent for exploring knowledge graph data from services, maps, and link charts.
- Agent utilities: We’re introducing new agent utility classes and functions for creating custom agents.
- Assistant component primitives: Adds support for rendering richer structured agent responses.
- Orchestrator-agent contract updates: The
arcgis-assistantorchestrator-agent contract now uses structured inputs and outputs instead of message-only exchanges to improve reliability for multi-step workflows, routing, and shared state management. Read more about these changes in the AI FAQ.
Map Components
New map components
The following map components were added at this release:
arcgis-coordinate-conversion-next(beta): The next-generation Coordinate Conversion component, with an updated interface, support for multiple simultaneous conversions, and additional configuration options.arcgis-feature-next(beta): The next-generation Feature component, with a streamlined API that removes redundant properties and methods.arcgis-features-next(beta): The next-generation Features component, with a streamlined API that removes redundant properties and methods and an updated interface that improves support for browsing aggregate features.arcgis-layer-list-next(beta): The next-generation Layer List component, with an updated interface and enhanced functionality.arcgis-slider-scale-range: A native replacement for the wrappedarcgis-scale-range-slidercomponent for adjusting a layer’s visible scale range.arcgis-utility-network-validate-network-topology: A native replacement for the wrappedarcgis-utility-network-validate-topologycomponent for validating utility network areas after edits are made.
Reference existing WebMap and WebScene layers declaratively
Added support for the new mapLayerId property in the Feature Table, Directions, and Oriented Imagery Viewer components.
This enhancement lets apps declaratively reference an existing layer in a WebMap or WebScene by ID, so the component reuses the layer that is already loaded instead of loading it again.
The result is simpler component configuration, less duplicate layer loading, and better startup efficiency.
<arcgis-map id="my-map" item-id="56cb159275394410a2a928be9c6f5c2a"></arcgis-map><!-- configure the feature table to use a layer from the map by setting the mapLayerId property --><arcgis-feature-table map-layer-id="1841c01f604-layer-5" reference-element="my-map" sync-view-selection filter-by-view-extent></arcgis-feature-table>Updated aggregate feature browsing experience
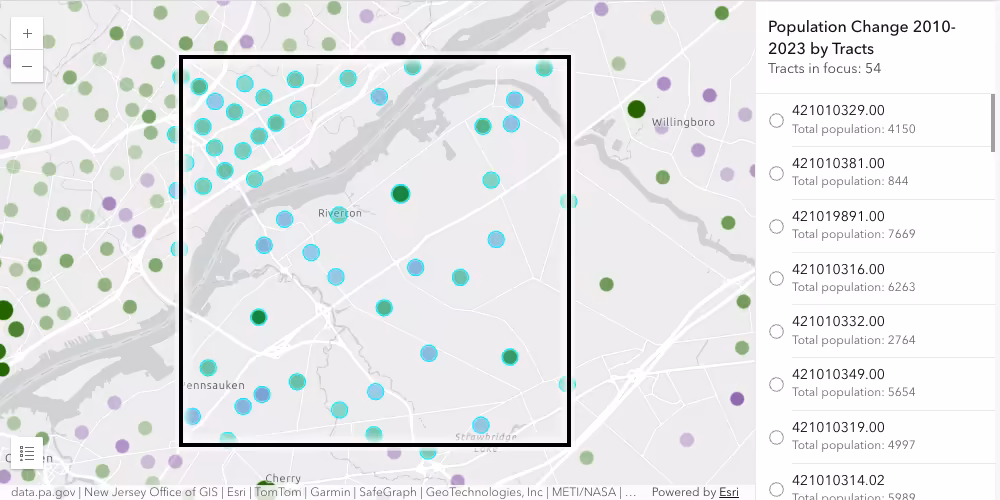
The Popup and Features (next) components have been enhanced to provide better context when browsing aggregate features. Support is now included for binned features as well as previously supported clustered features. This new experience follows the same UI design as browsing related features and utility network associations, providing a familiar and consistent experience. The total number of features now displays the correct number of features and no longer counts the aggregate popup template as a feature.
| Previous experience | New experience |
|---|---|
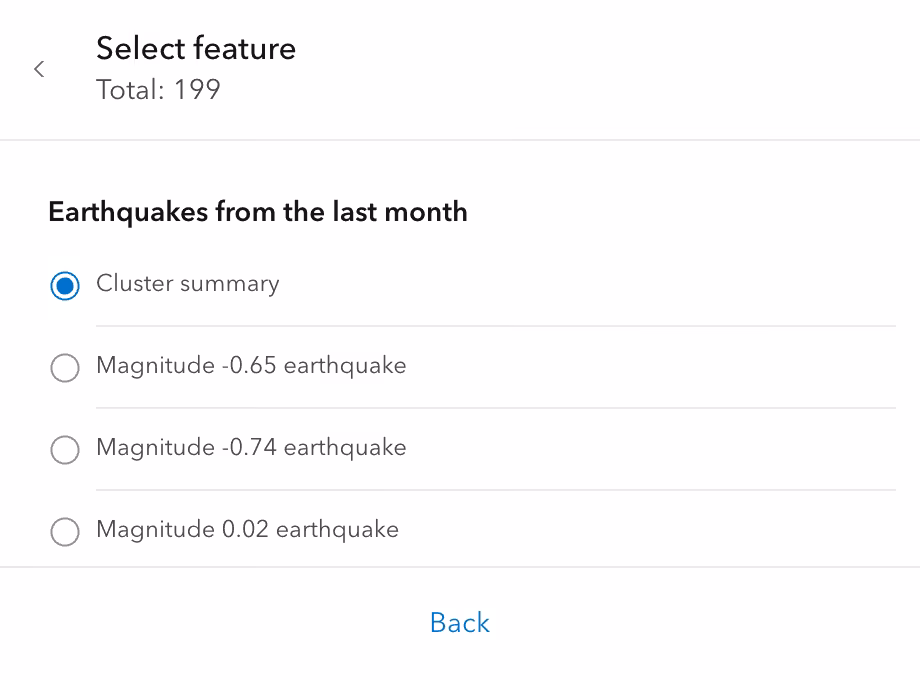 | 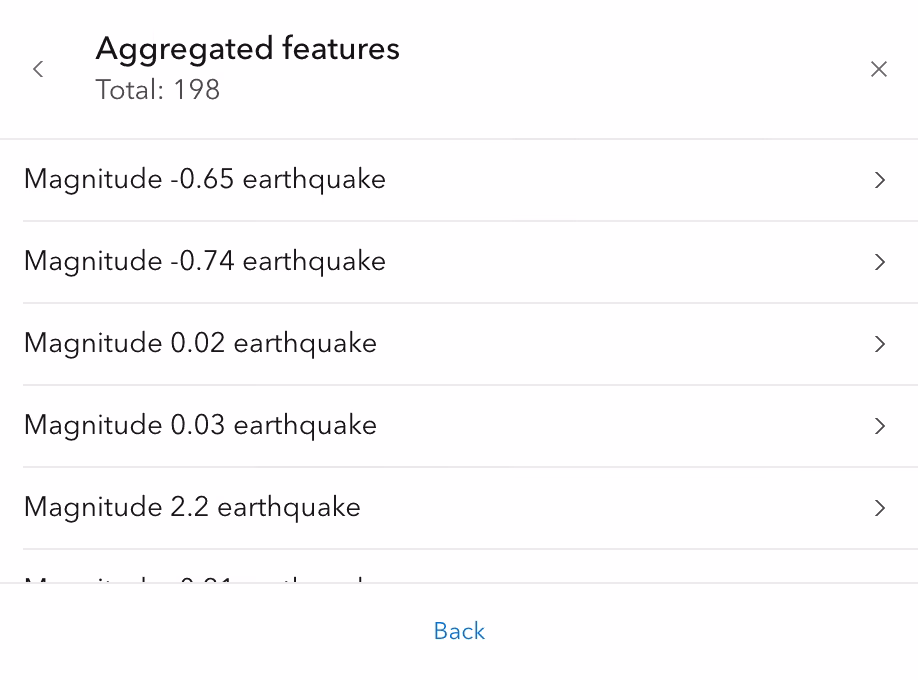 |
See the Clusters as pie charts and Intro to binning samples to explore this new browsing experience.
Alternate row CSS variables
Variables to adjust the background color of table rows on children components of the Map, Scene, Link Chart, or Video components were added this release. These apply to components such as the Popup and Feature components when displaying a field element in its content:
--arcgis-table-row-background-color: adjusts the background color for table rows.--arcgis-table-row-alt-background-color: adjusts the background color for alternating table rows.
The image below shows an example of how these CSS variables can be used to customize the appearance of a fields element in a arcgis-popup that is slotted in a arcgis-map using the following CSS:
arcgis-map { --arcgis-table-row-background-color: #e6f4ea; --arcgis-table-row-alt-background-color: #f5eedc;}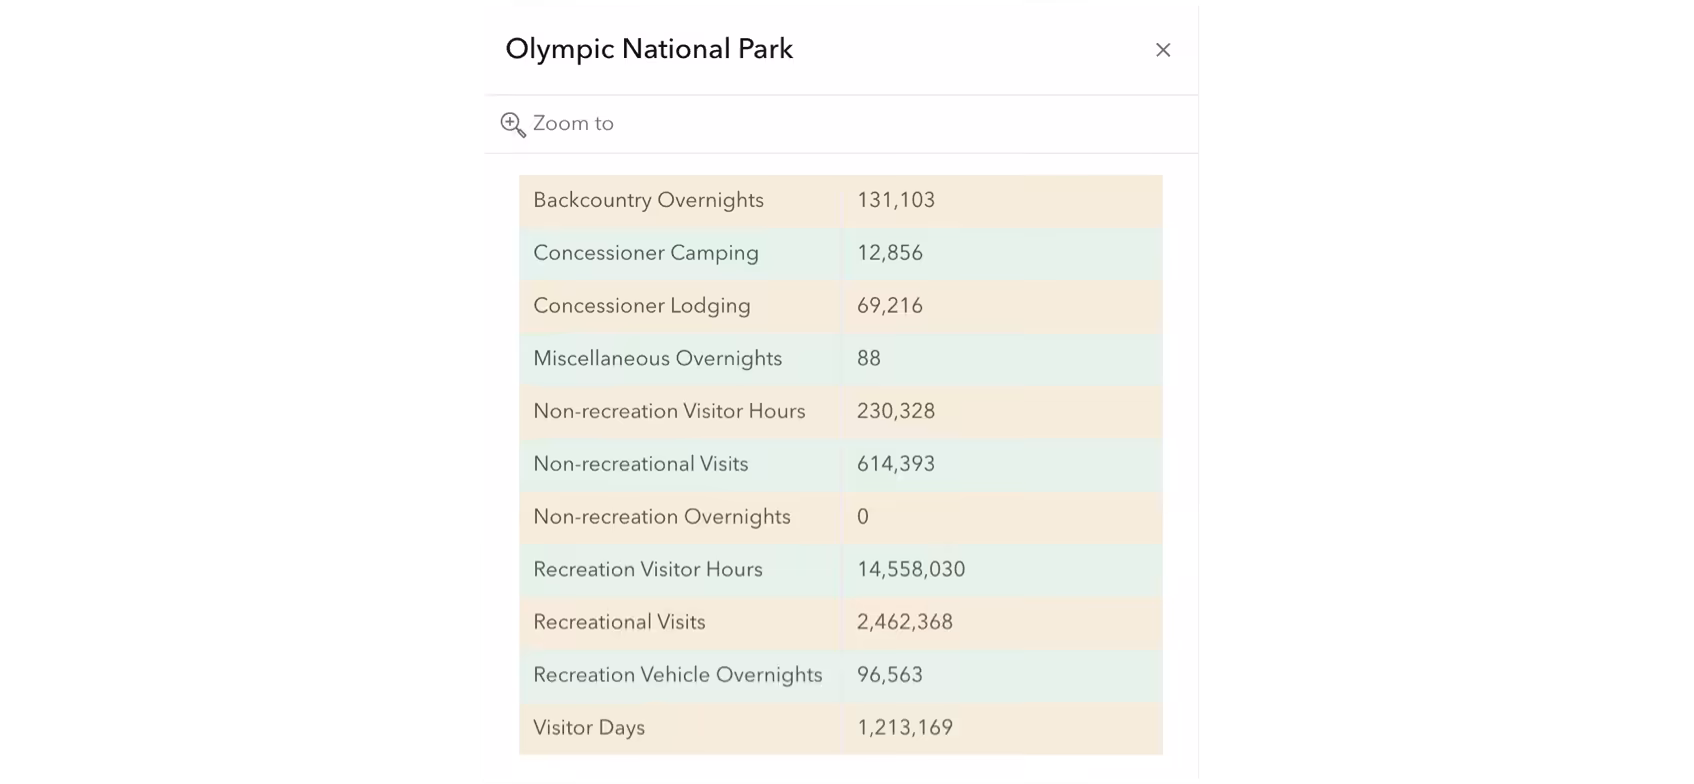
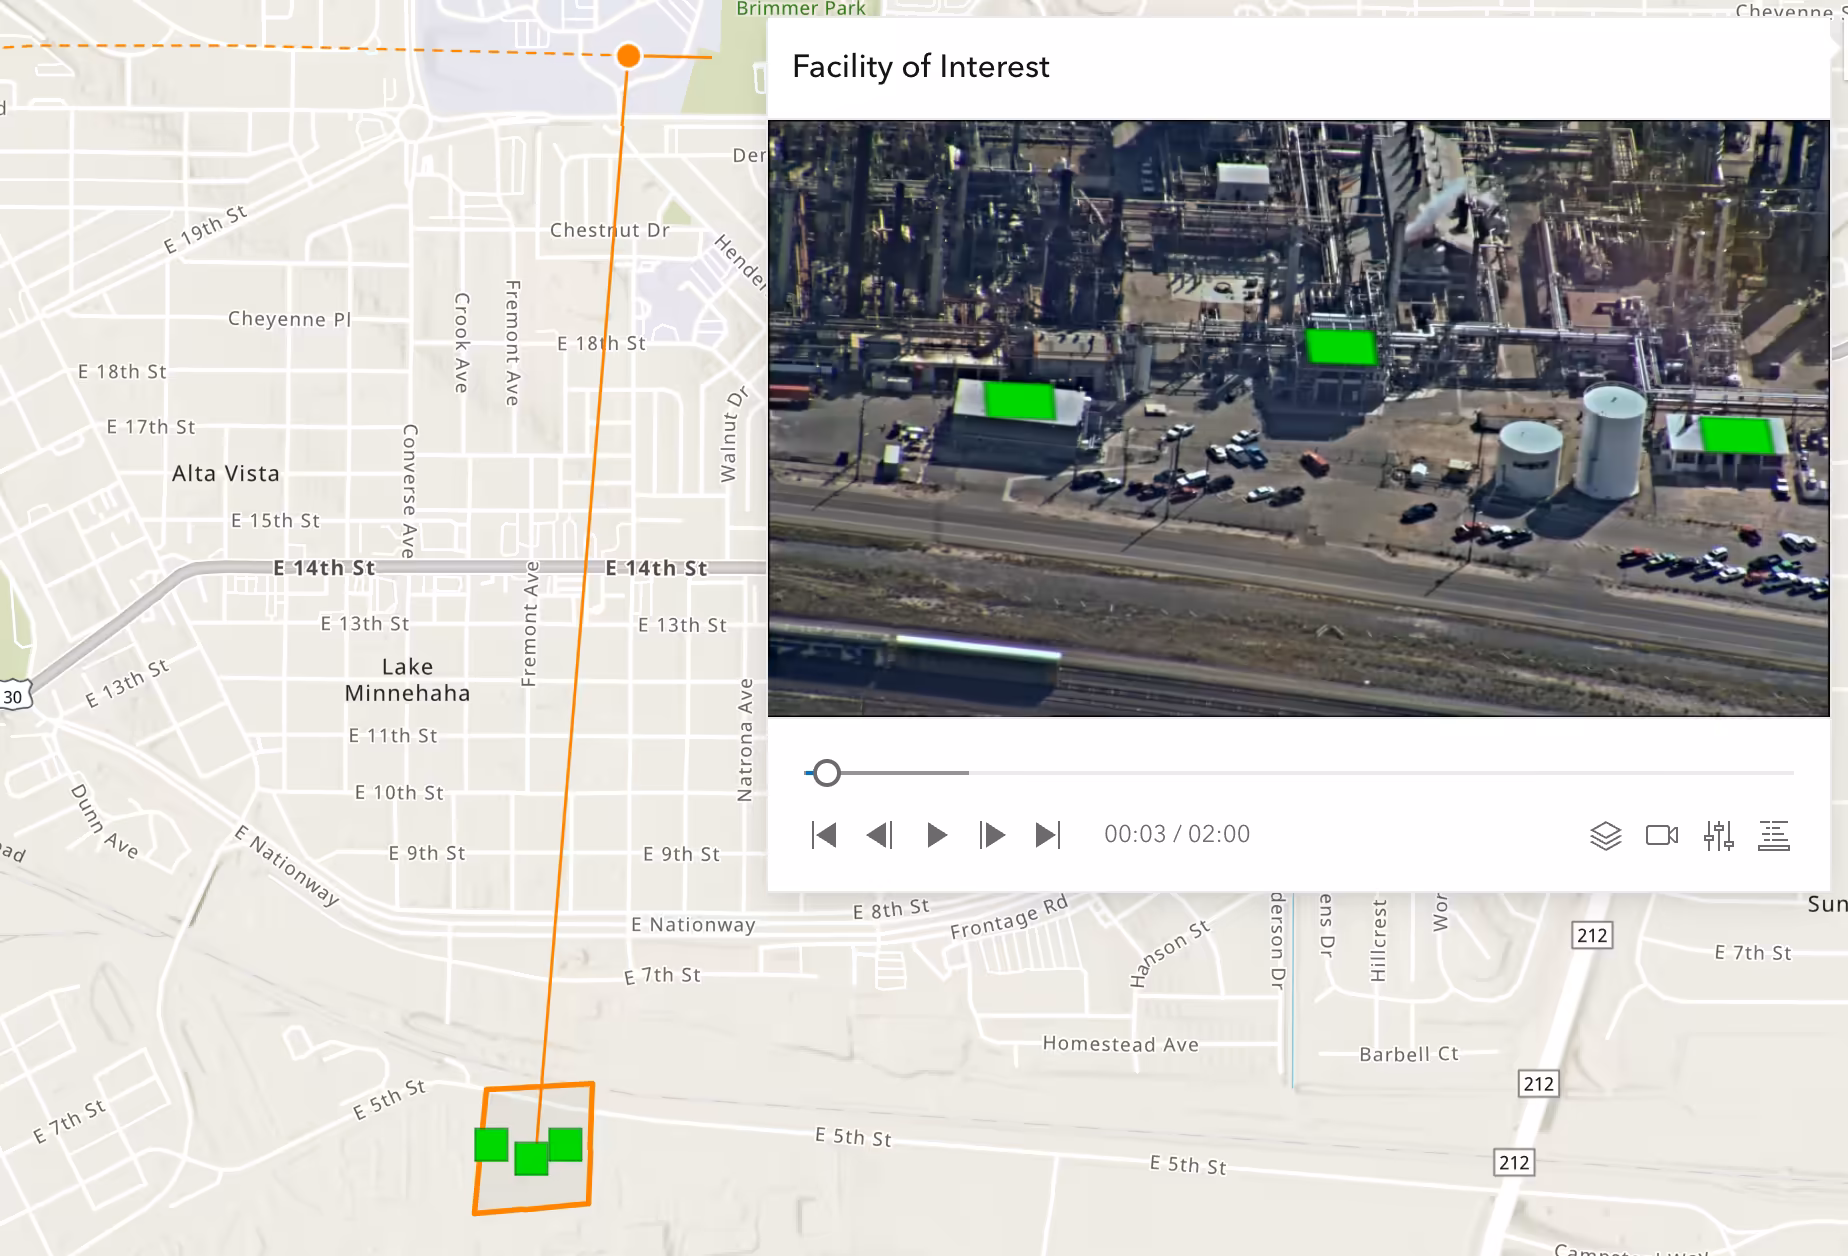
Video and Video Player components
We added support for displaying operational layers on top of video frames with a new operationalDataVisible property, making it easier to compare live video with map context. There is now a new control in the Video Player for toggling sensorPath visibility. We also fixed bugs that could cause VideoLayer rendering failures and invalid time errors in the Video Player when switching between live and non-live layers.
Charts Components
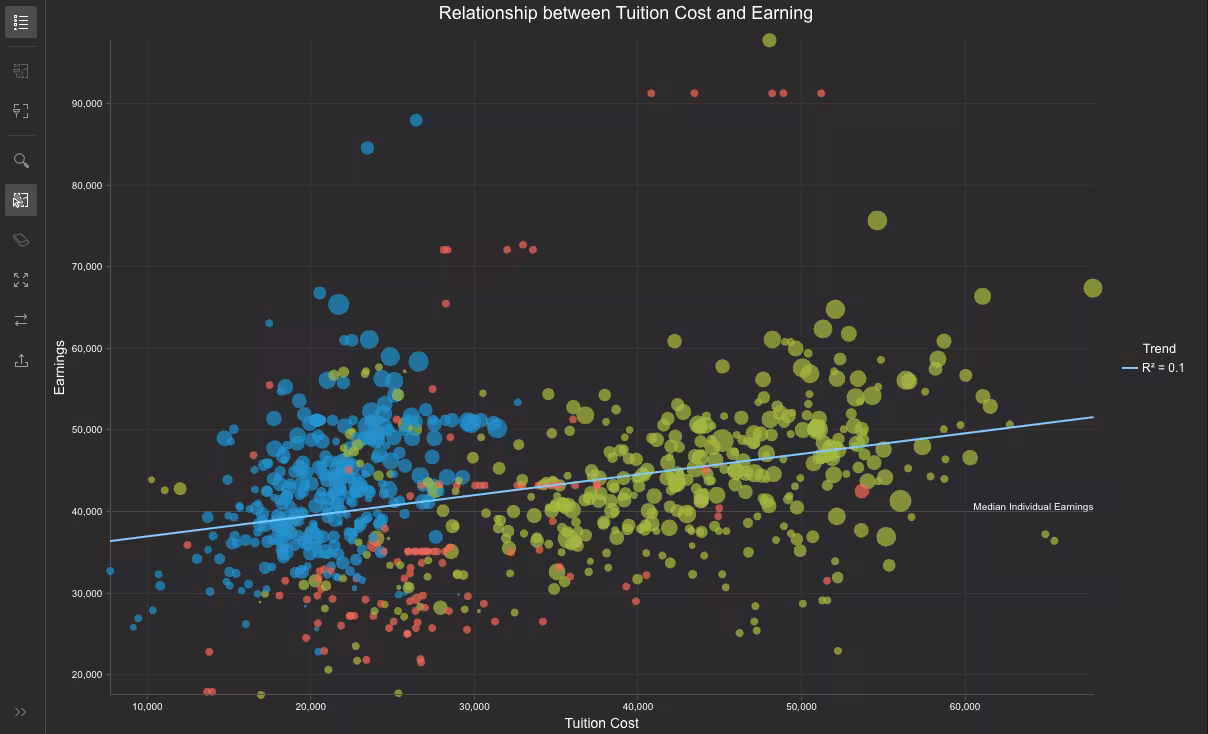
Theming
The Charts components now support theming with Calcite CSS variables. This allows you to customize the appearance of charts to better match the overall design of your application.
You can also use the calcite-mode-dark class on the component itself or its parent container to apply the dark theme to charts components.
The image below shows an example of a scatterplot with the dark mode applied. All elements other than the series colors are overridden by the dark theme, including the background, axes, grid lines, and text.
Imagery layers support
Histogram and scatterplot can now be configured with ImageryLayer, ImageryTileLayer and WCSLayer. An existing chart can be loaded from an imagery layer item via layer-item-id and chart-index, or create a new chart with charts model by passing in an imagery layer to the createModel() method.
When the imagery layer contains a raster attribute table, bar charts can also be configured.
Coding Components
Introducing Arcade Editor debugger
The Arcade Editor component has been enhanced to provide a better debugging experience for users. When an error is encountered in the code, the editor now displays a more detailed error message that includes the line and column number where the error occurred, as well as a description of the error. This makes it easier for users to identify and fix issues in their Arcade expressions.
<arcgis-arcade-editor enable-debugger></arcgis-arcade-editor>Arcade assistant (beta) enabled by default
The Arcade assistant (beta) is now available for use in custom applications that allow users to author Arcade expressions with the Arcade Editor. The assistant allows users to ask an underlying AI model to generate Arcade expressions from natural language prompts, or to find and fix errors in their code. This is enabled by default. You can opt out of exposing the assistant to end users by setting the disableAssistant property to true or by blocking the use of AI assistants in your ArcGIS Online organizational settings.
Display Annotation and Dimension layers (beta)
Support for displaying AnnotationFeatureLayer (beta) and DimensionFeatureLayer (beta) in 2D maps, saving them to web maps, and using them with the Layer List component has been added this release. Additional functionality will be added in future releases.
An AnnotationFeatureLayer (beta) is a 2D layer used to display text about features on a map. An annotation is a type of feature that consists of text with position, layout, and style attributes. This release supports displaying feature-linked and standard annotations, without displaying leader lines.
A DimensionFeatureLayer (beta) is a 2D layer used for showing specific lengths or distances on a map. A dimension may indicate the length of a side of a building or land parcel, or the distance between two features, such as a fire hydrant and the corner of a building. For our 3D implementation, please refer to DimensionLayer.
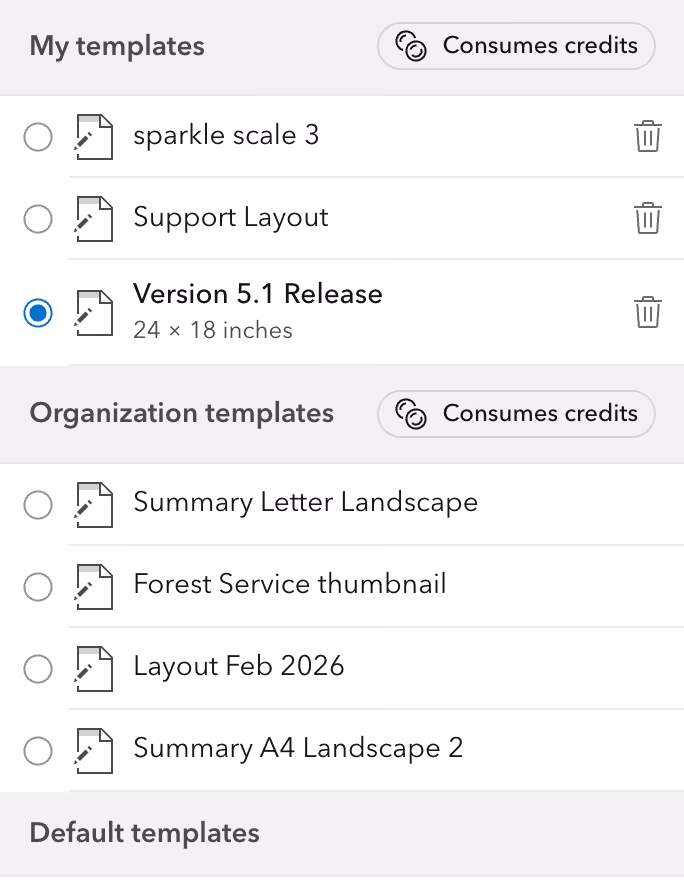
Custom print layout templates out of beta
If your ArcGIS Online organization has configured custom print layout templates,
those templates will be available in the Organization templates section of the Choose template pane. This means that users can update print layout templates without using or updating their own custom print service.
Previously, this functionality was in beta. With the official release, these print jobs now cost 5 credits.
The Print component has been updated to display this cost.
| Custom print layout templates | Credit cost notice |
|---|---|
 |  |
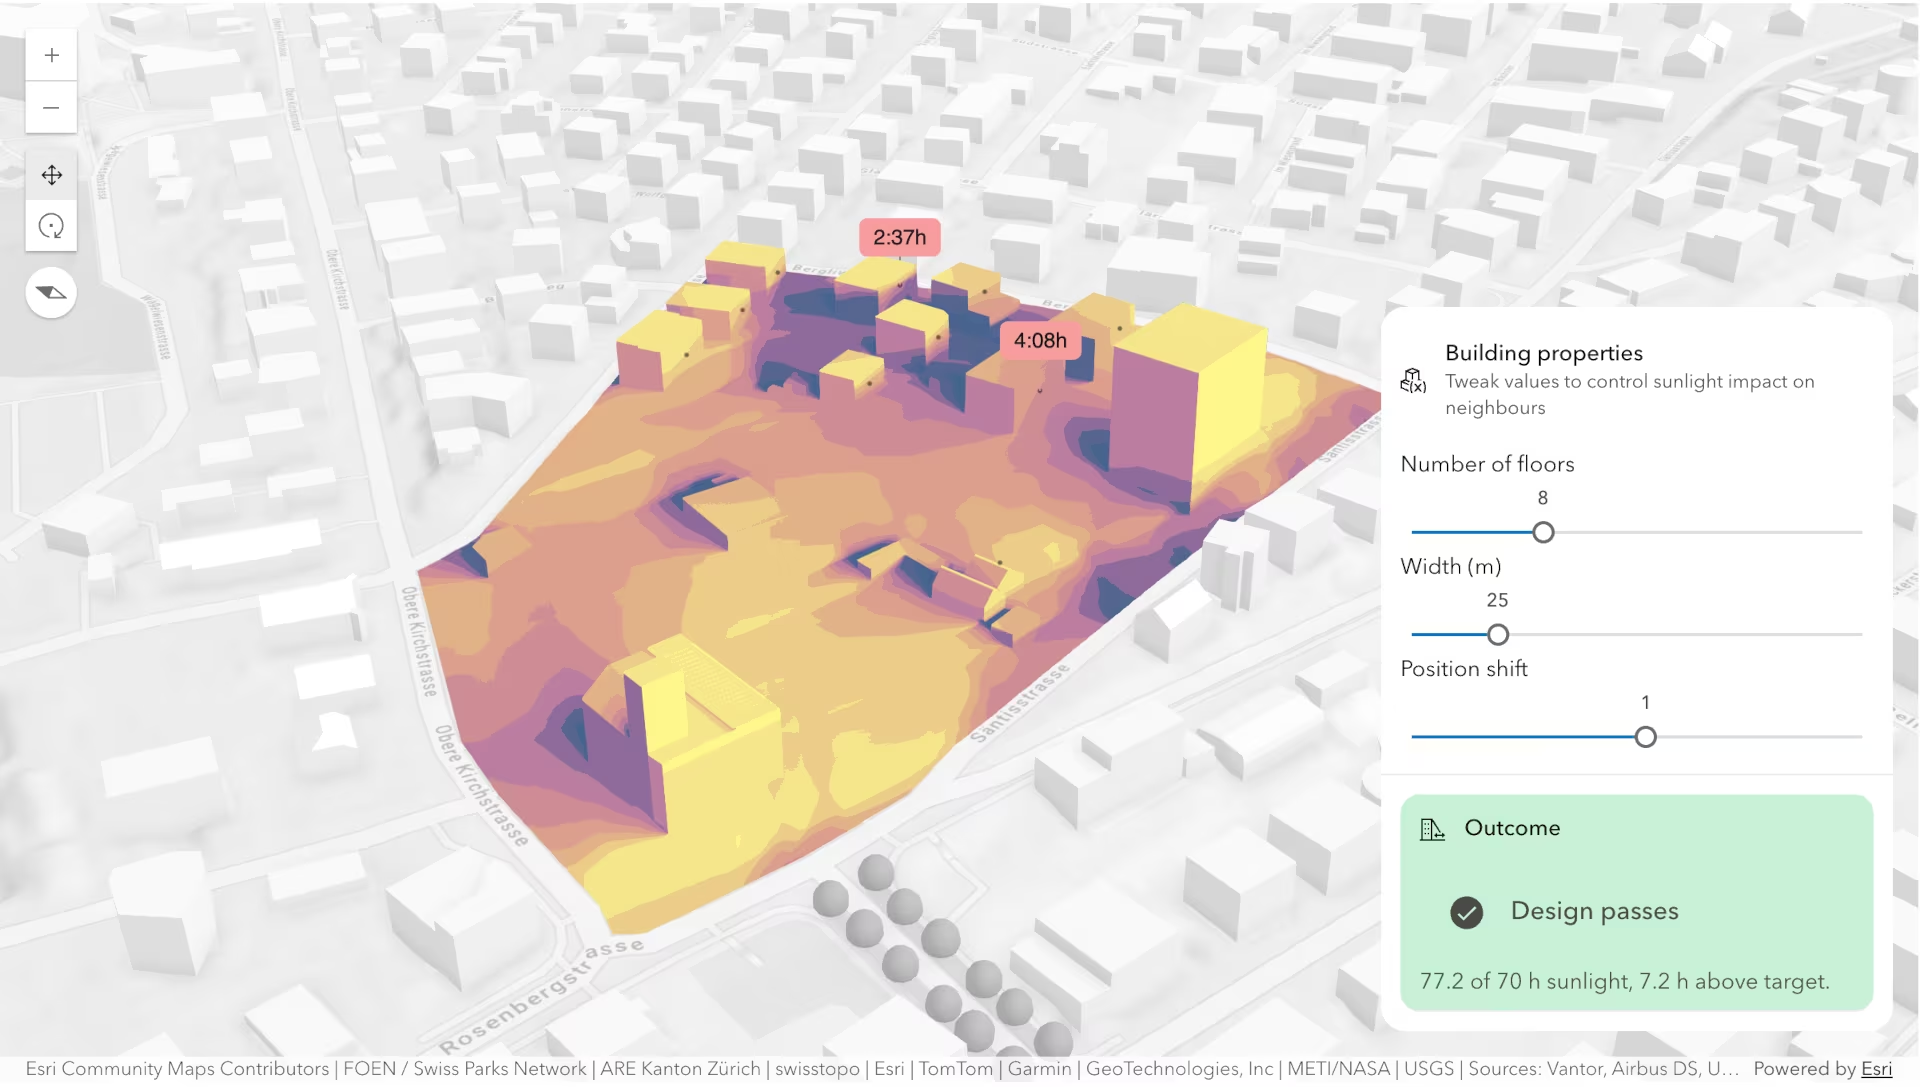
Sunlight duration analysis in ShadowCastAnalysis
We made significant updates to ShadowCastAnalysis that expand how you can evaluate sun and shadow conditions in a scene.
Previously, ShadowCastAnalysis focused exclusively on shadow duration
analysis. With this release you can now perform sunlight duration analysis. By setting the new
visualizeSunlight property to true, it is possible to visualize areas that receive sunlight during the selected day and time range. This applies to all three existing analysis modes.
The analysis can now be limited to a polygonal project area with the new geometry property. This is useful when evaluating zoning or planning requirements for parcels, parks, courtyards, and other outdoor spaces where the relevant surface is only part of the scene.
New colorStops on TotalDurationOptions and DiscreteOptions provide more control over the visualization. Use color stops to map duration or discrete sample counts to a custom color ramp, including opaque ramps that make sunlight duration easier to compare within a defined project area.
The tooltip has been improved to show the hourly range represented on the map when hovering over shadows or sunlight in
hourly total-duration mode, instead of a single duration.
The Shadow Cast component supports sunlight duration through its new visualizeSunlight property. The polygonal project area and custom color stops can be configured through the component’s analysis property.
Explore these enhancements in the new Sunlight analysis sample.
Query associated models from 3D object layer
3D Object SceneLayer now supports querying the source and derived models
associated with 3D object features. This makes it possible to query available model formats, request a specific
representation such as .glb or .ifc, and download model files on demand.
Use SceneLayer.queryModel() and SceneLayer.queryModels() to inspect model files and properties, and explore the new Query 3D models sample. Also check the updated guide on 3D object workflows in the SDK for more details.
Volume measurement in preview
VolumeMeasurementAnalysis and the Volume Measurement component are released in preview.
Improved navigation in 3D
SceneView now supports horizontal panning regardless of camera tilt. Use B + right mouse button drag to move the camera along the horizontal plane when navigating constrained 3D environments, such as building interiors, street canyons, or ground-level asset inspections. This works with the existing B + left mouse button drag shortcut to look around in place, providing more controlled navigation in tight spaces.
SceneView also now supports keyboard navigation in local scenes. Use the arrow keys to move horizontally and U or J to move up or down. See SceneView navigation for the full list of navigation shortcuts.
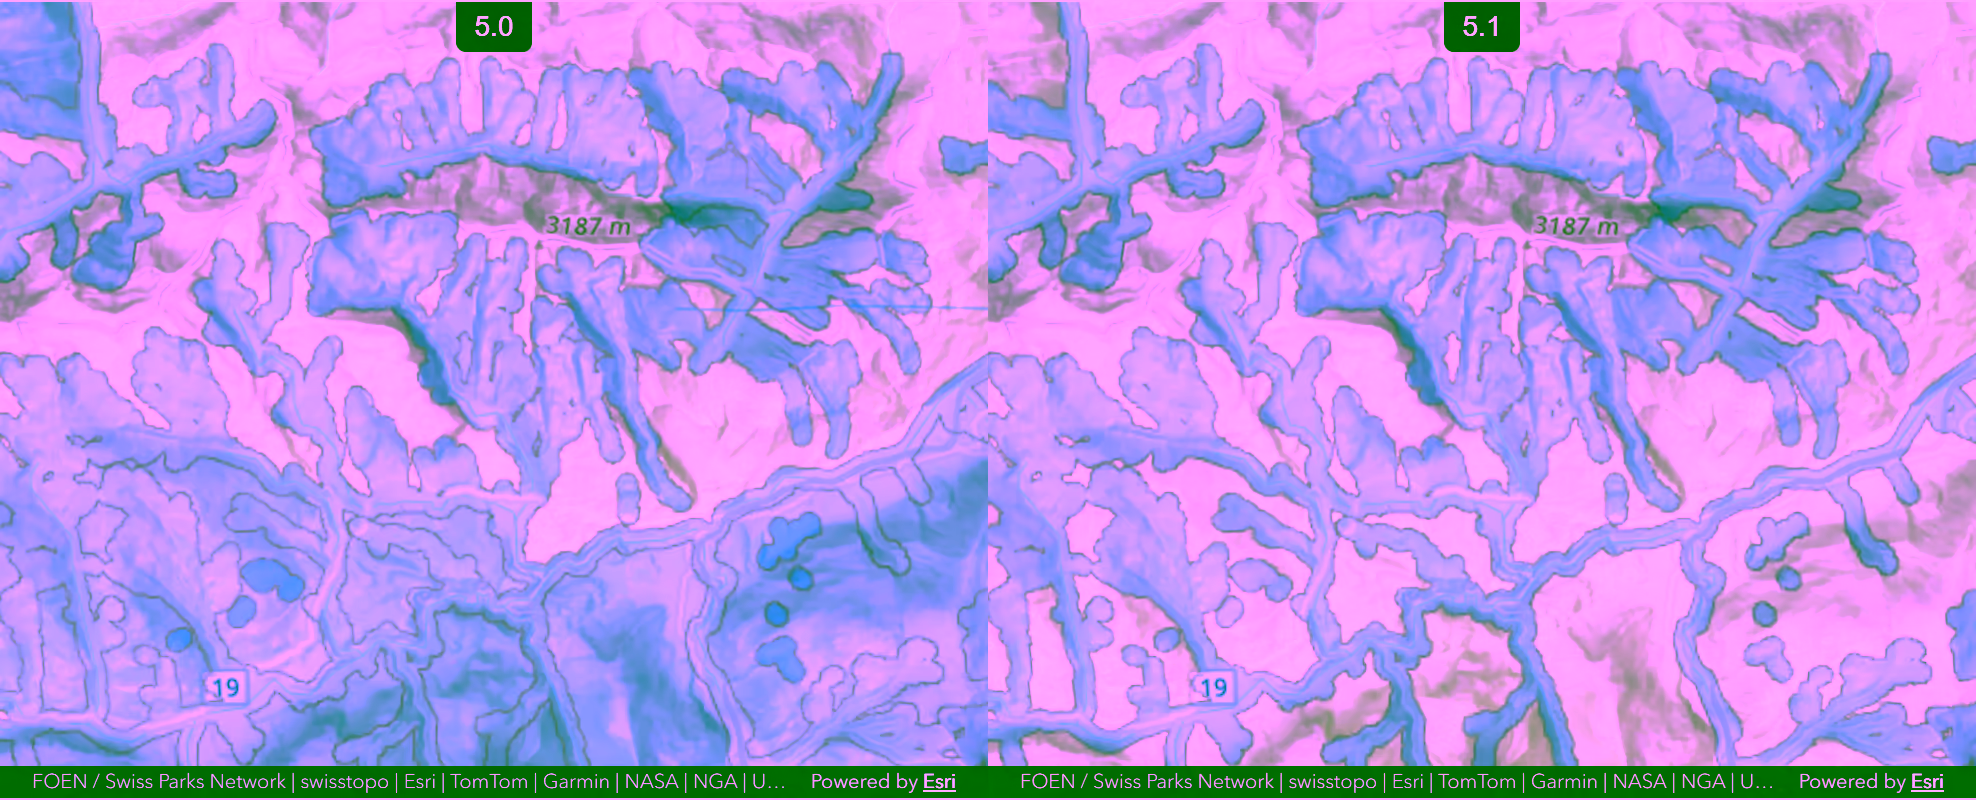
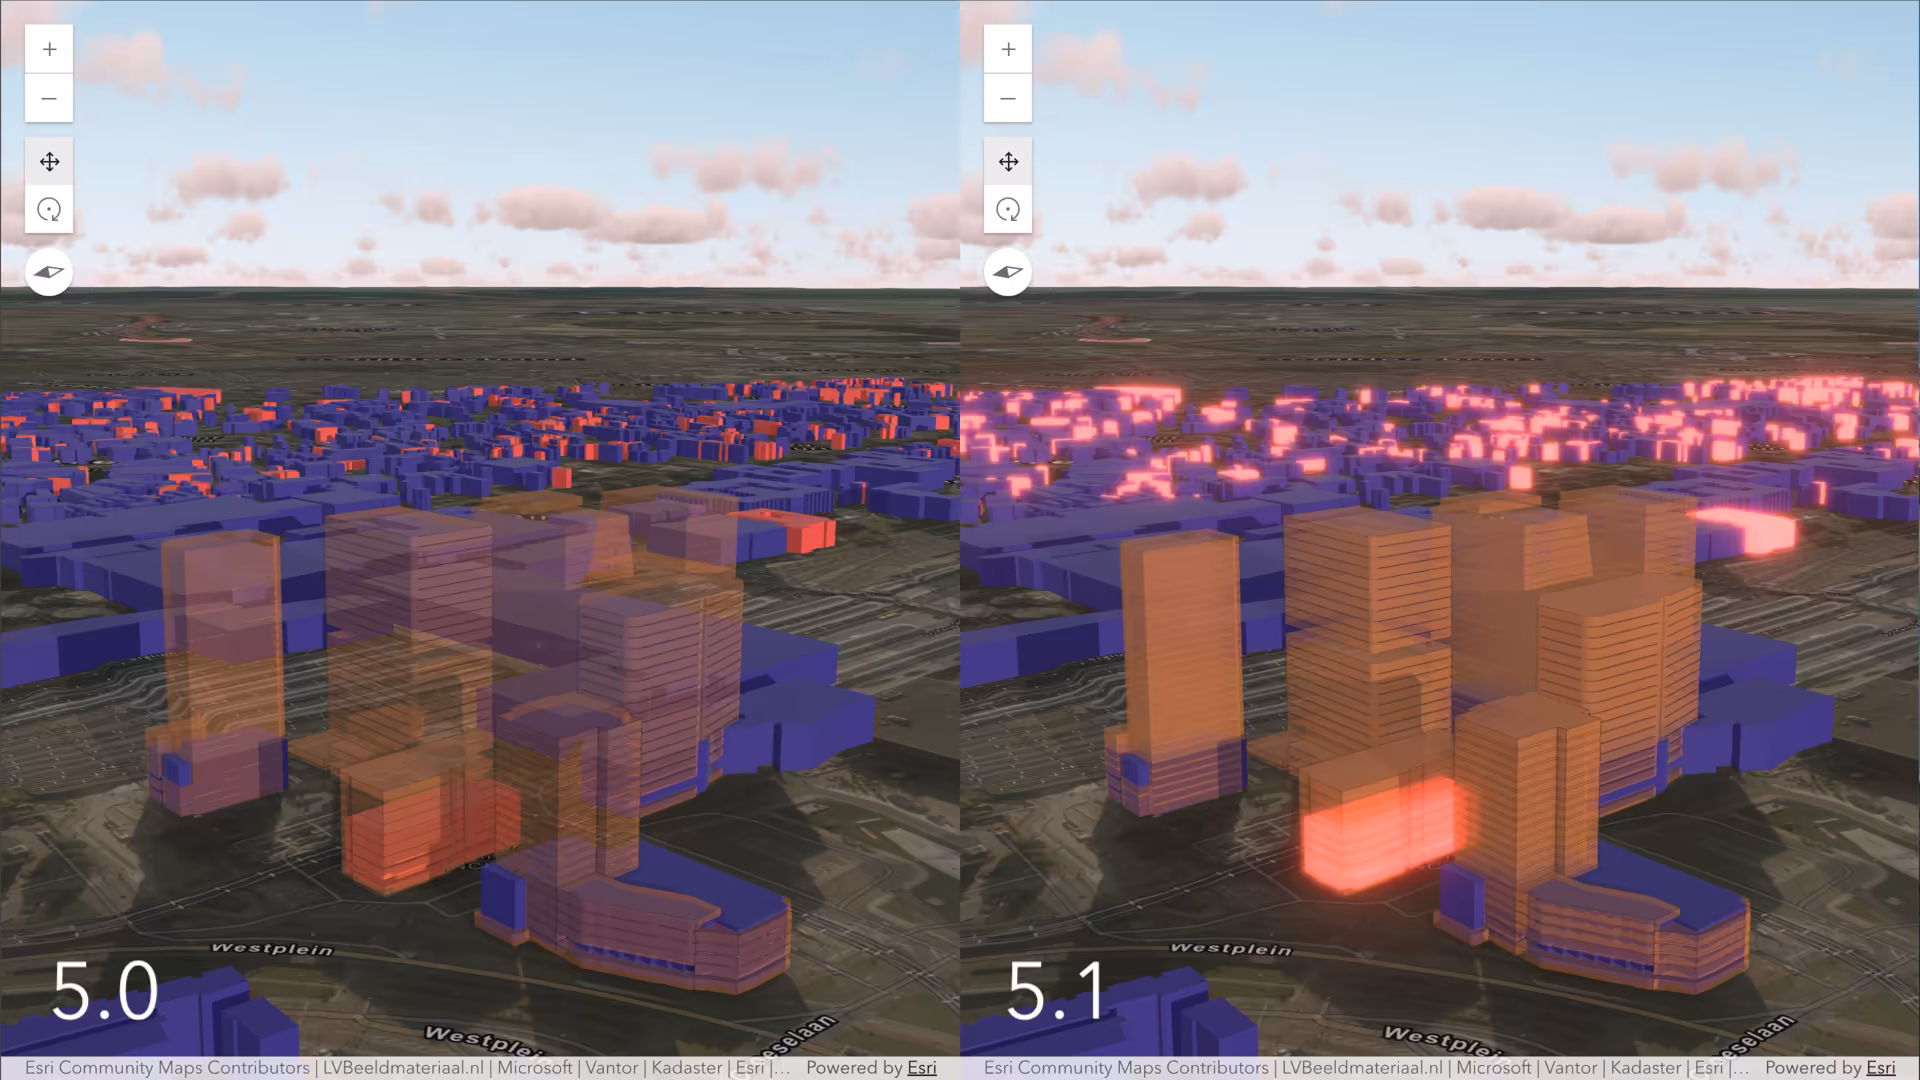
Enhanced 3D visuals on iOS
Several 3D visualization features now render consistently on devices that do not support the WebGL2
EXT_float_blend extension, such as certain iOS models. Transparent content, including terrain, now uses the same order-independent transparency
rendering across devices. In addition, emissive material properties
for volumetric symbology and the global Glow effect are also supported on all platforms.
Because EXT_float_blend is emulated on these devices, transparent and emissive content may render slightly differently in some scenarios.
See image below to compare the appearance of transparent and light-emitting elements on devices lacking the EXT_float_blend extension in 5.0 (left) and 5.1 (right).
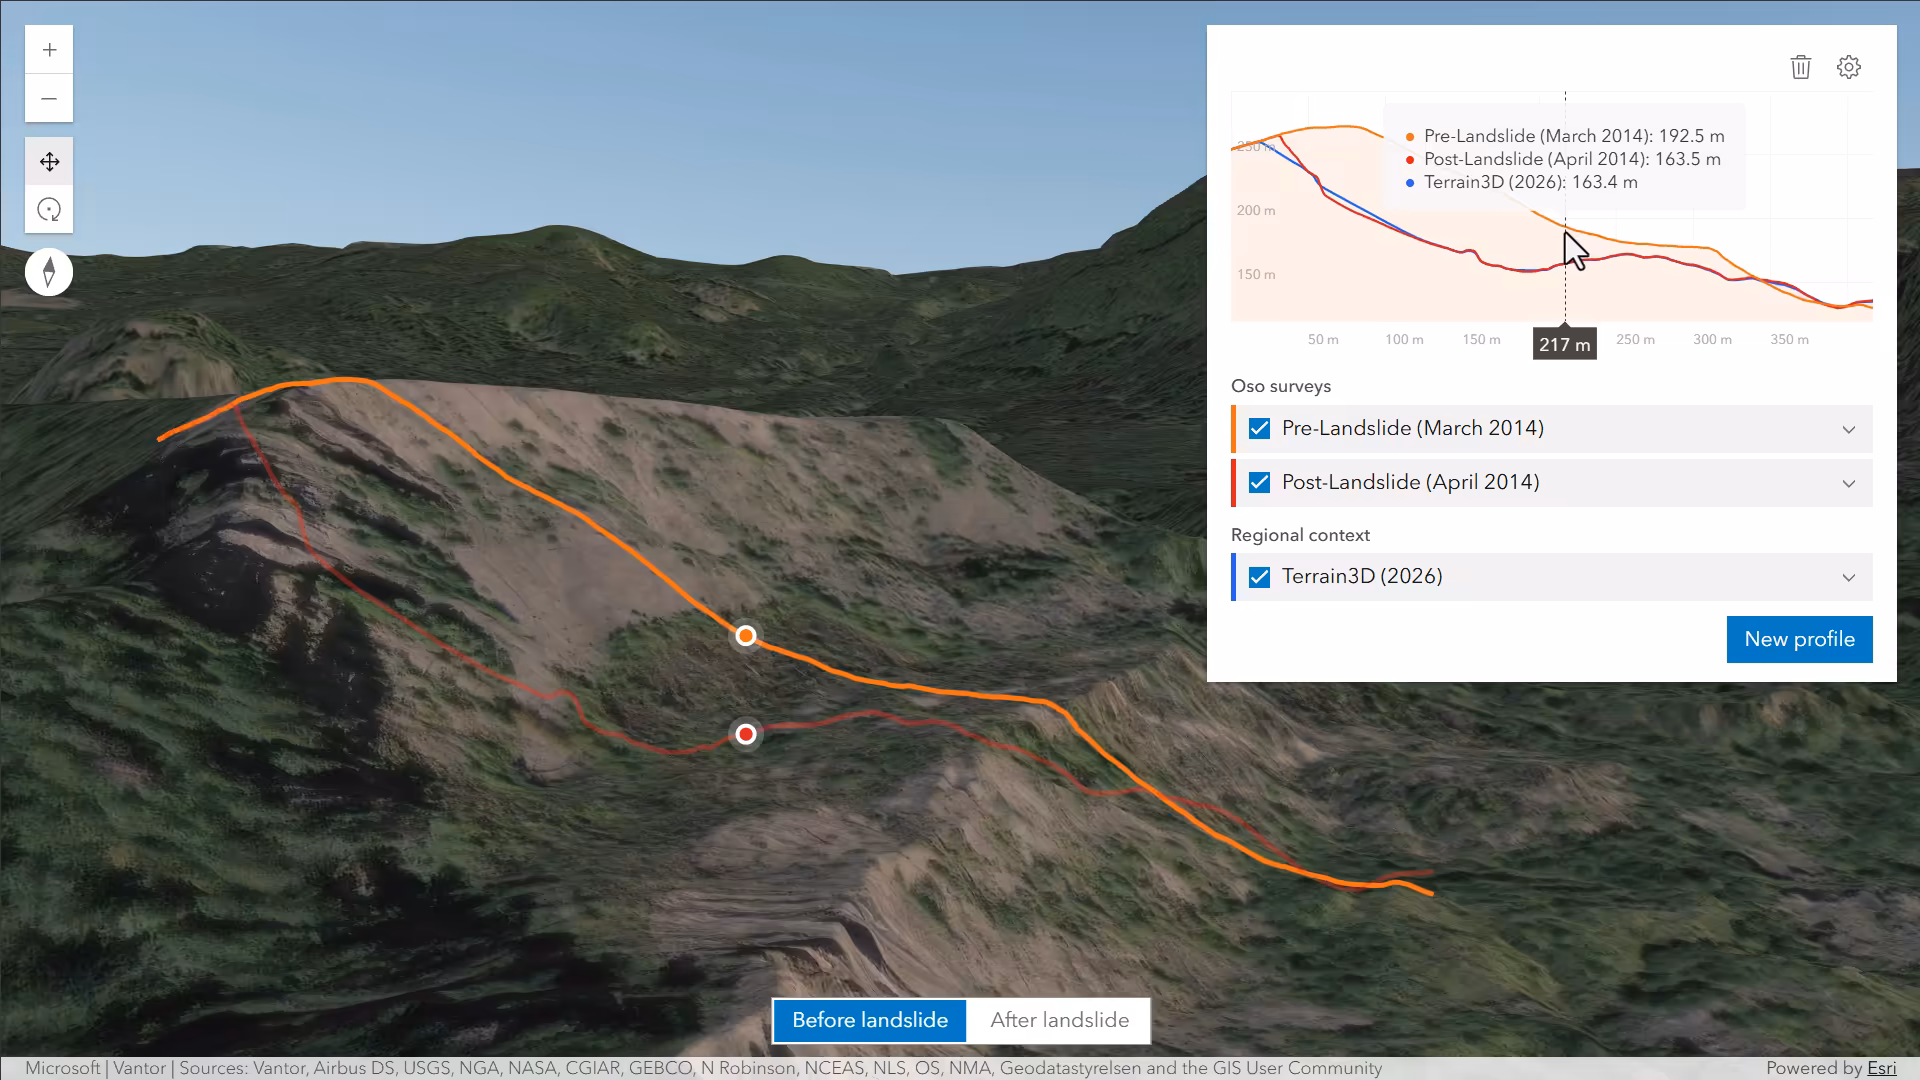
Organize Elevation Profiles into groups
ElevationProfileAnalysis now supports ElevationProfileGroup, a new profile type for organizing multiple elevation profile lines within a single logical container. As a result, the profiles collection can now contain both individual profile lines and groups. Each profile line in a group is computed independently and rendered as its own line in the chart. This is supported in both ElevationProfileAnalysis and Elevation Profile component.
For more details on how to use this capability, see the new Elevation Profile group sample.
Viewshed elevationInfo
Viewshed now supports
elevationInfo, making it possible to control how the observer position is resolved vertically in the scene.
This enables programmatic workflows that require explicit vertical placement, such as keeping the observer at an
absolute height or positioning it relative to the ground or scene with an offset.
Viewshed elevationInfo is also supported when persisting viewsheds in a
ViewshedLayer and web scenes.
Telecom Domain Networks
The Telecom Domain Network introduced with ArcGIS Pro 3.7 and ArcGIS Enterprise 12.1 is now supported in the Maps SDK for JavaScript. New classes have been introduced to facilitate working with Telecom Domain Networks. These classes include CircuitManager, UnitIdentifierManager, Circuit, etc. For more information, please visit the Telecom guide page.
Oriented Imagery improvements
Oriented Imagery introduces several enhancements designed to improve spatial understanding, navigation flexibility, and support for richer content types.
- Superimpose view has been introduced in the Oriented Imagery Viewer, allowing users to overlay the image currently displayed in the viewer directly onto a 3D scene. When enabled, the imagery is applied as a texture to a mesh positioned within the scene, enabling users to visualize the image within the spatial context in which it was originally captured.
- Sequential navigation has been enhanced with support for multi field sorting, providing customizable navigation workflows. Sorting fields are defined as an ordered array. The fields are processed from first to last, and any field without an explicit sorting direction will be sorted in ascending order by default.
- The Image overlays capability is extended for OrientedImageryLayers containing video content.
Additional Field Configuration Support
FieldConfigurations are supported in OrientedImageryLayer, SubtypeSublayer, and CatalogFootprintLayer. Incremental support for field configurations will continue to be introduced in upcoming releases, enhancing areas of the SDK that involve working with field information.
VideoLayer sensor path
The new sensorPath property allows users to display the path a moving sensor follows throughout a video collection. In past releases, sensorTrail showed where the sensor had already been. With the new sensorPath, users can now see where the sensor will be later in the video. We also added support for persisting loop and playbackRate in web maps.
Documentation improvements
Revamped Showcase applications
The showcase page has been fully refreshed with three new applications, and all 2D/3D apps now follow best programming practices, demonstrating how to build complete, real-world experiences by combining key SDK capabilities.
Updated authentication guide page
The Authentication guide has been improved to provide a more comprehensive overview of authentication workflows. The guide also includes code examples and best practices for implementing authentication to access secure ArcGIS resources in your applications.
Documentation for previous versions
Starting with version 4.34, previous SDK documentation for supported versions is available on our Downloads and previous versions page - making it easy to access the documentation of previous versions without downloading the SDK locally.
Map components changes
- components/
- arcgis-compass/
- CompassState - added type declaration
- Axes - added type declaration
- arcgis-coordinate-conversion/
- arcgis-coordinate-conversion
- expanded - deprecated property since 5.1. The expand/collapse functionality will be removed as part of migration to arcgis-coordinate-conversion-next.
- hideCaptureButton - deprecated property since 5.1. The capture button will be removed as part of migration to arcgis-coordinate-conversion-next.
- hideExpandButton - deprecated property since 5.1. The expand/collapse functionality will be removed as part of migration to arcgis-coordinate-conversion-next.
- hideInputButton - deprecated property since 5.1. The input button will be removed as part of migration to arcgis-coordinate-conversion-next.
- hideSettingsButton - deprecated property since 5.1. The settings button will be removed as part of migration to arcgis-coordinate-conversion-next.
- ignoreCoordinatePrecision - added property
- removeLeadingZeros - added property
- arcgis-coordinate-conversion
- arcgis-coordinate-conversion-next/
- arcgis-coordinate-conversion-next - added component
- types/
- StorageType - added type declaration
- arcgis-daylight/
- arcgis-daylight
- localDateAsString - added property
- arcgis-daylight
- arcgis-directions/
- arcgis-directions
- mapLayerId - added property
- arcgis-directions
- arcgis-editor/
- arcgis-editor
- hideSnappingControlsElementsGridControls - added property
- hideSnappingControlsElementsGridControlsElementsColorSelection - added property
- hideSnappingControlsElementsGridControlsElementsDynamicScaleToggle - added property
- hideSnappingControlsElementsGridControlsElementsLineIntervalInput - added property
- hideSnappingControlsElementsGridControlsElementsNumericInputs - added property
- hideSnappingControlsElementsGridControlsElementsOutOfScaleWarning - added property
- hideSnappingControlsElementsGridControlsElementsPlacementButtons - added property
- hideSnappingControlsElementsGridControlsElementsRotateWithMapToggle - added property
- hideSnappingControlsElementsGridEnabledToggle - added property
- useLegacyCreateTools - deprecated property
- arcgis-editor
- arcgis-elevation-profile/
- arcgis-elevation-profile
- settings-start - added slot
- settings-end - added slot
- arcgis-elevation-profile
- arcgis-feature/
- arcgis-feature
- viewModel - deprecated property since 5.1. Use properties directly on the component instead of accessing them through the
viewModel. For example, instead ofviewModel.graphic, usegraphic.
- viewModel - deprecated property since 5.1. Use properties directly on the component instead of accessing them through the
- arcgis-feature
- arcgis-feature-next/
- arcgis-feature-next - added component
- arcgis-feature-table/
- arcgis-feature-table
- closed - added property
- collapsed - added property
- filterByLayerScaleRange - added property
- filterByViewExtent - added property
- hideColumnVisibilityMenu - added property
- hideColumnVisibilityMenuItemsFilter - added property
- hideColumnVisibilityMenuItemsHeader - added property
- hideColumnVisibilityMenuItemsToggleAll - added property
- hideMenuItemsToggleColumns - deprecated property since 5.1. Use the ‘hideColumnVisibilityMenu’ property instead.
- mapLayerId - added property
- showClose - added property
- showCollapse - added property
- tableDisabled - deprecated property since 5.0, use
element.disabledinstead. - @arcgisCellDblClick - added event
- arcgis-feature-table
- arcgis-features/
- arcgis-features
- collapseDirection - added property
- effectiveHeading - added property
- hideSelectFeature - added property
- promises - deprecated property since 5.1.
- viewModel - deprecated property since 5.1. Use properties directly on the component instead of accessing them through the
viewModel. For example, instead ofviewModel.active, useactive. - fetchFeatures() - deprecated method since 5.1. Use the
fetchPopupFeaturesmethod on the Map, Scene, or Link Chart component to fetch features based on a screen location. - triggerAction() - deprecated method since 5.1. Trigger actions with manual user interaction within the component.
- arcgis-features
- arcgis-features-next/
- arcgis-features-next - added component
- arcgis-layer-list-next/
- arcgis-layer-list-next - added component
- types/
- CatalogLayerListParams - added type declaration
- TableListParams - added type declaration
- FlowLayer - added type declaration
- SubtablesLayer - added type declaration
- arcgis-link-chart/
- arcgis-link-chart
- fetchPopupFeatures() - added method
- —arcgis-table-row-background-color - added css property
- —arcgis-table-row-alt-background-color - added css property
- arcgis-link-chart
- arcgis-map/
- arcgis-map
- fetchPopupFeatures() - added method
- —arcgis-table-row-background-color - added css property
- —arcgis-table-row-alt-background-color - added css property
- arcgis-map
- arcgis-oriented-imagery-viewer/
- arcgis-oriented-imagery-viewer
- hideHeader - added property
- hideMenu - added property
- mapLayerId - added property
- loadBestImage() - added method
- arcgis-oriented-imagery-viewer
- arcgis-popup/
- arcgis-popup
- effectiveHeading - added property
- focusTrapDisabled - added property
- promises - deprecated property since 5.1.
- fetchFeatures() - deprecated method since 5.1. Use the
fetchPopupFeaturesmethod on the Map, Scene, or Link Chart component to fetch features based on a screen location. - triggerAction() - removed method
- arcgis-popup
- arcgis-scale-range-slider/
- arcgis-scale-range-slider - deprecated component since 5.1. Use arcgis-slider-scale-range instead.
- arcgis-scene/
- arcgis-scene
- fetchPopupFeatures() - added method
- —arcgis-table-row-background-color - added css property
- —arcgis-table-row-alt-background-color - added css property
- arcgis-scene
- arcgis-shadow-cast/
- arcgis-shadow-cast
- visualizeSunlight - added property
- arcgis-shadow-cast
- arcgis-sketch/
- arcgis-sketch
- hideSnappingControlsElementsGridControls - added property
- hideSnappingControlsElementsGridControlsElementsColorSelection - added property
- hideSnappingControlsElementsGridControlsElementsDynamicScaleToggle - added property
- hideSnappingControlsElementsGridControlsElementsLineIntervalInput - added property
- hideSnappingControlsElementsGridControlsElementsNumericInputs - added property
- hideSnappingControlsElementsGridControlsElementsOutOfScaleWarning - added property
- hideSnappingControlsElementsGridControlsElementsPlacementButtons - added property
- hideSnappingControlsElementsGridControlsElementsRotateWithMapToggle - added property
- hideSnappingControlsElementsGridEnabledToggle - added property
- scale - deprecated property since 5.0, use
element.visualScaleinstead. - updateOnGraphicClickDisabled - added property
- useLegacyCreateTools - deprecated property
- @arcgisDuplicate - added event
- arcgis-sketch
- arcgis-slider-scale-range/
- arcgis-slider-scale-range - added component
- spriteSheetsUtils/
- SupportedRegion - added type declaration
- LowerCaseRegion - added type declaration
- UpperCaseRegion - added type declaration
- arcgis-swipe/
- arcgis-swipe
- leadingLayers - deprecated property since 5.0, use startLayers instead.
- swipePosition - deprecated property since 5.0, use position instead.
- trailingLayers - deprecated property since 5.0, use endLayers instead.
- arcgis-swipe
- arcgis-table-list/
- arcgis-table-list
- headingLevel - added property
- arcgis-table-list
- arcgis-time-slider/
- arcgis-time-slider
- labelFormatFunction - added property
- arcgis-time-slider
- arcgis-track/
- arcgis-track
- currentPosition - added property
- types/
- PositionFilterFunction - added type declaration
- TrackViewModelState - added type declaration
- FilterPosition - added type declaration
- arcgis-track
- arcgis-utility-network-trace/
- arcgis-utility-network-trace - deprecated component since 5.0, use arcgis-utility-network-trace-analysis instead.
- arcgis-utility-network-validate-network-topology/
- Disabled - added type declaration
- Executing - added type declaration
- Loading - added type declaration
- Ready - added type declaration
- Success - added type declaration
- ValidateNetworkTopologyError - added type declaration
- ExtentOption - added type declaration
- State - added type declaration
- arcgis-utility-network-validate-network-topology - added component
- arcgis-utility-network-validate-topology/
- arcgis-utility-network-validate-topology - deprecated component since 5.1, use arcgis-utility-network-validate-network-topology instead.
- arcgis-video/
- arcgis-video
- operationalDataVisible - added property
- —arcgis-table-row-background-color - added css property
- —arcgis-table-row-alt-background-color - added css property
- arcgis-video
- arcgis-video-player/
- arcgis-video-player
- operationalDataVisible - added property
- arcgis-video-player
- arcgis-compass/
- utils/
- action-utils/
- VisibilityAppearance - added type declaration
- async-utils/
- AbortOptions - added type declaration
- action-utils/
Charts components changes
createModel()should now be imported from@arcgis/charts-components/model/shared/setup-utils.jsinstead of@arcgis/charts-components. The old import path is deprecated and will be removed at 6.0.
- index/
- createModel() - deprecated function since 5.1. Import from this path instead:
@arcgis/charts-components/model/shared/setup-utils.js
- createModel() - deprecated function since 5.1. Import from this path instead:
- interfaces/
- SupportedRasterLayer - added type declaration
- CSVOptions
- roundDecimals - added property
- chart-rendering/
- common/
- interfaces/
- ChartOptions
- disableInteractions - deprecated property since 5.1. Use interactionsDisabled instead.
- interactionsDisabled - added property
- hideEmptySeries - deprecated property since 5.1. Use showEmptySeries instead.
- showEmptySeries - added property
- loaderColors - deprecated property since 5.1. Won’t be replaced.
- replaceNoValueCategoryWithZero - deprecated property since 5.1. Use hideZeroCountCategories instead.
- hideZeroCountCategories - added property
- disableTogglingLegendItems - deprecated property since 5.1. Use togglingLegendItemsDisabled instead.
- togglingLegendItemsDisabled - added property
- usePopupTemplateFieldsInfo - deprecated property since 5.1. Use popupTemplateFieldInfosEnabled instead.
- popupTemplateFieldInfosEnabled - added property
- syncViewTimeZone - added property
- showUIMessages - deprecated property since 5.1. Won’t be replaced.
- dataUpdated - deprecated property since 5.1. Won’t be replaced.
- ChartOptions
- interfaces/
- common/
- components/
- arcgis-chart/
- arcgis-chart
- animationEnabled - added property
- autoDisposeChart - deprecated property since 5.0. Use autoDestroyDisabled instead.
- calciteThemingCSSVariables - added property
- configurationEnabled - added property
- disableInteractions - deprecated property since 5.1. Use interactionsDisabled instead.
- disableTogglingLegendItems - deprecated property since 5.1. Use togglingLegendItemsDisabled instead.
- enableConfiguration - deprecated property since 5.1. Use configurationEnabled instead.
- enableResponsiveFeatures - deprecated property since 5.1. Won’t be replaced.
- featureIndex - deprecated property since 5.0. Use charts model’s featureIndex prop instead.
- filterByExtent - deprecated property since 5.1. Use filterByViewExtent instead.
- filterByViewExtent - added property
- hideEmptySeries - deprecated property since 5.1. Use showEmptySeries instead.
- hideLicenseWatermark - deprecated property since 5.1. Use showLicenseWatermark instead.
- hideUIMessages - added property
- hideZeroCountCategories - added property
- ignoreSmoothRenderingLimit - deprecated property since 5.1. Won’t be replaced.
- interactionsDisabled - added property
- layerFieldsChangePolicy - deprecated property since 5.1. Won’t be replaced.
- layerFilterChangePolicy - deprecated property since 5.1. Won’t be replaced.
- layerRendererChangePolicy - deprecated property since 5.1. Won’t be replaced.
- legendPosition - deprecated property since 5.0. Use charts model’s legendPosition prop instead.
- legendVisibility - deprecated property since 5.0. Use charts model’s legendVisibility prop instead.
- loaderColors - deprecated property since 5.1. Customize the Calcite CSS variables defined by calciteThemingCSSVariables instead.
- popupTemplateFieldInfosEnabled - added property
- queueChartCreation - deprecated property since 5.1. Use skipChartCreationQueue instead.
- replaceNoValueCategoryWithZero - deprecated property since 5.0. Use hideZeroCountCategories instead.
- rotated - added property
- rotation - deprecated property since 5.0. Use either rotated or the charts model’s rotated prop instead.
- selectionManager - added property
- showEmptySeries - added property
- showLicenseWatermark - added property
- showUIMessages - deprecated property since 5.1. Use hideUIMessages instead.
- skipChartCreationQueue - added property
- syncChartsSelection - added property
- syncSelection - deprecated property since 5.1. Use syncChartsSelection prop instead.
- syncSelectionsBetweenChartAndLayerViewPolicy - deprecated property since 5.1. Use syncViewSelection prop instead.
- syncViewSelection - added property
- syncViewTimeExtent - added property
- syncViewTimeZone - added property
- syncViewTimeZoneInclusionList - deprecated property since 5.1. Use syncViewTimeZone instead.
- togglingLegendItemsDisabled - added property
- useAnimatedCharts - deprecated property since 5.1. Use animationEnabled instead.
- usePopupTemplateFieldsInfo - deprecated property since 5.1. Use popupTemplateFieldInfosEnabled instead.
- viewTimeExtentChangePolicy - deprecated property since 5.1. Use syncViewTimeExtent prop instead.
- destroy() - added method
- errorAlert() - deprecated method since 5.1. Won’t be replaced.
- @arcgisInvalidConfigWarningRaise - deprecated event since 5.1. Won’t be replaced.
- arcgis-chart
- arcgis-charts-action-bar/
- arcgis-charts-action-bar
- csvExportExclusionList - added property
- disableCSVExportForChartTypes - deprecated property since 5.1. Use csvExportExclusionList instead.
- arcgis-charts-action-bar
- arcgis-chart/
- model/
- bar-chart-model/
- bar-chart-model/
- BarChartModel
- maxXBound - added property
- minXBound - added property
- rotated - added property
- rotatedState - deprecated property since 5.1. Use rotated instead.
- timeZone - added property
- getDataTooltipFontSize() - added method
- setDataTooltipFontSize() - added method
- BarChartModel
- bar-chart-model/
- box-plot-model/
- box-plot-model/
- BoxPlotModel
- maxXBound - added property
- minXBound - added property
- rotated - added property
- rotatedState - deprecated property since 5.1. Use rotated instead.
- getDataTooltipFontSize() - added method
- setDataTooltipFontSize() - added method
- BoxPlotModel
- box-plot-model/
- chart-model/
- chart-model/
- ChartModel
- getDataTooltipFontSize() - added method
- setDataTooltipFontSize() - added method
- ChartModel
- chart-model/
- combo-bar-line-chart-model/
- combo-bar-line-chart-model/
- ComboBarLineChartModel
- maxXBound - added property
- minXBound - added property
- rotated - added property
- rotatedState - deprecated property since 5.1. Use rotated instead.
- timeZone - added property
- getDataTooltipFontSize() - added method
- setDataTooltipFontSize() - added method
- ComboBarLineChartModel
- combo-bar-line-chart-model/
- gauge-model/
- gauge-model/
- GaugeModel
- maxXBound - added property
- minXBound - added property
- progressBands - added property
- progressBandsVisibility - added property
- getDataTooltipFontSize() - added method
- setDataTooltipFontSize() - added method
- GaugeModel
- gauge-model/
- heat-chart-model/
- heat-chart-model/
- HeatChartModel
- colorRampName - added property
- isColorRampFlipped - added property
- maxXBound - added property
- minXBound - added property
- rotated - added property
- rotatedState - deprecated property since 5.1. Use rotated instead.
- timeZone - added property
- getDataTooltipFontSize() - added method
- setDataTooltipFontSize() - added method
- HeatChartModel
- heat-chart-model/
- histogram-model/
- histogram-model/
- HistogramModel
- maxXBound - added property
- minXBound - added property
- getDataTooltipFontSize() - added method
- setDataTooltipFontSize() - added method
- HistogramModel
- histogram-model/
- interfaces/
- chart-interfaces/
- ModelParams
- commonStrings - added property
- ModelParams
- common/
- ModelTypeToSeriesType - added type declaration
- ModelOfType - added type declaration
- chart-interfaces/
- line-chart-model/
- line-chart-model/
- LineChartModel
- maxXBound - added property
- minXBound - added property
- rotated - added property
- rotatedState - deprecated property since 5.1. Use rotated instead.
- timeZone - added property
- getDataTooltipFontSize() - added method
- setDataTooltipFontSize() - added method
- LineChartModel
- line-chart-model/
- mixins/
- model-with-guides/
- ModelWithGuides
- getDataTooltipFontSize() - added method
- setDataTooltipFontSize() - added method
- ModelWithGuides
- model-with-legend/
- ModelWithLegend
- getDataTooltipFontSize() - added method
- setDataTooltipFontSize() - added method
- ModelWithLegend
- model-with-line-marker-styling/
- ModelWithLineMarkerStyling
- getDataTooltipFontSize() - added method
- setDataTooltipFontSize() - added method
- ModelWithLineMarkerStyling
- model-with-multi-axes/
- ModelWithMultiAxes
- getDataTooltipFontSize() - added method
- setDataTooltipFontSize() - added method
- ModelWithMultiAxes
- model-with-temporal-binning/
- ModelWithTemporalBinning
- getDataTooltipFontSize() - added method
- setDataTooltipFontSize() - added method
- ModelWithTemporalBinning
- model-with-tooltips/
- ModelWithTooltips
- getDataTooltipFontSize() - added method
- setDataTooltipFontSize() - added method
- ModelWithTooltips
- model-with-x-guides/
- ModelWithXGuides
- getDataTooltipFontSize() - added method
- setDataTooltipFontSize() - added method
- ModelWithXGuides
- model-with-y-guides/
- ModelWithYGuides
- getDataTooltipFontSize() - added method
- setDataTooltipFontSize() - added method
- ModelWithYGuides
- model-with-guides/
- pie-chart-model/
- pie-chart-legend-model/
- PieChartLegendModel
- getDataTooltipFontSize() - added method
- setDataTooltipFontSize() - added method
- PieChartLegendModel
- pie-chart-model/
- PieChartModel
- getDataTooltipFontSize() - added method
- setDataTooltipFontSize() - added method
- PieChartModel
- pie-chart-legend-model/
- properties/
- data-tooltip-font-size/
- WithSeriesDataTooltipFontSize - added class
- rotated-state/
- WithRotatedState
- rotated - added property
- rotatedState - deprecated property since 5.1. Use rotated instead.
- WithRotatedState
- time-zone/
- WithTimeZone - added class
- axes/
- x-axis/
- x-bounds/
- x-axis/
- data-tooltip-font-size/
- radar-chart-model/
- radar-chart-model/
- RadarChartModel
- maxXBound - added property
- minXBound - added property
- rotated - added property
- rotatedState - deprecated property since 5.1. Use rotated instead.
- timeZone - added property
- getDataTooltipFontSize() - added method
- setDataTooltipFontSize() - added method
- RadarChartModel
- radar-chart-model/
- scatterplot-model/
- scatterplot-model/
- ScatterplotModel
- maxXBound - added property
- minXBound - added property
- getDataTooltipFontSize() - added method
- setDataTooltipFontSize() - added method
- ScatterplotModel
- scatterplot-model/
- serial-chart-model/
- serial-chart-model/
- SerialChartModel
- maxXBound - added property
- minXBound - added property
- rotated - added property
- rotatedState - deprecated property since 5.1. Use rotated instead.
- timeZone - added property
- getDataTooltipFontSize() - added method
- setDataTooltipFontSize() - added method
- SerialChartModel
- serial-chart-model/
- shared/
- setup-utils/
- CreateModelProps
- commonStrings - added property
- CreateModelProps
- type-guards/
- isRadarChartModel() - added function
- setup-utils/
- bar-chart-model/
- spec/
- data-source/
- WebChartHeatChartDataItem - added type declaration
- WebHeatChartAxesData - added type declaration
- rest-js-object-literals/
- RESTHorizontalAlignment - deprecated type declaration since 5.1. Won’t be replaced.
- RESTVerticalAlignment - deprecated type declaration since 5.1. Won’t be replaced.
- RESTFontStyle - deprecated type declaration since 5.1. Won’t be replaced.
- RESTFontWeight - deprecated type declaration since 5.1. Won’t be replaced.
- RESTFontDecoration - deprecated type declaration since 5.1. Won’t be replaced.
- RESTUnits - deprecated type declaration since 5.1. Use Query#units instead.
- rest-js-types/
- IPoint - added type declaration
- IPolyline - added type declaration
- IPolygon - added type declaration
- IPolygonWithCurves - added type declaration
- SpatialRelationship - deprecated type declaration since 5.1. Won’t be replaced.
- JsonCurve - deprecated type declaration since 5.1. Won’t be replaced.
- Units - deprecated type declaration since 5.1. Won’t be replaced.
- SymbolType - deprecated type declaration since 5.1. Won’t be replaced.
- IImageServiceLayer - added type declaration
- IDefinitionParameter - deprecated type declaration since 5.1. Won’t be replaced.
- IDefinitionInput - deprecated type declaration since 5.1. Won’t be replaced.
- FeatureEditTool - deprecated type declaration since 5.1. Won’t be replaced.
- ITemplate - deprecated type declaration since 5.1. Won’t be replaced.
- ITiledImageServiceLayer - added type declaration
- IWCSLayer - added type declaration
- IFeatureLayer - added type declaration
- IViewServiceSource - deprecated type declaration since 5.1. Won’t be replaced.
- name - added property
- type - added property
- url - added property
- serviceItemId - added property
- web-chart/
- WebChartGaugeFixedProgressBands - added type declaration
- WebChartGaugeAxis
- progressBands - added property
- WebChartSeries
- dataTooltipFontSize - added property
- WebChartHeatChartHeatClassBreaks
- colorRampInfo - added property
- WebChartTemporalBinningExtras
- outTimeZone - deprecated property since 5.1. Set the
timeZoneproperty on the date axisvalueFormat.intlOptionsinstead.
- outTimeZone - deprecated property since 5.1. Set the
- data-source/
- utils/
- chart-config/
- validator/
- index/
- validateWebChart() - deprecated function since 5.1. Won’t be replaced.
- interfaces/
- DataWarningObject - added type declaration
- ValidationStatus - deprecated type declaration since 5.1. Won’t be replaced.
- valid - added property
- schemaErrors - added property
- customErrors - added property
- warnings - added property
- index/
- validator/
- components/
- themes/
- CalciteThemeCSSVariables - added type declaration
- themes/
- defaults/
- index/
- featuresExtentField - added variable
- index/
- layer/
- index/
- loadLayer() - added function
- interfaces/
- QueryObjectOrRaster - added type declaration
- inline-conversion/
- interfaces/
- WebChartConfigFields - added type declaration
- interfaces/
- index/
- misc/
- index/
- ChartTypes - added type declaration
- WebChartType - added type declaration
- interfaces/
- SelectionData
- selectionPixelTarget - added property
- SelectionData
- index/
- types/
- index/
- SupportedChartSeries - added type declaration
- index/
- chart-config/
Coding components changes
- components/
- types/
- EditorProfileDefinition - added type declaration
- IEditorProfileDefinition - deprecated type declaration since 5.1. Use EditorProfileDefinition instead.
- PredefinedProfile - added type declaration
- IPredefinedProfile - deprecated type declaration since 5.1. Use PredefinedProfile instead.
- ProfileVariable - added type declaration
- IProfileVariable - deprecated type declaration since 5.1. Use ProfileVariable instead.
- ProfileVariableBase - added type declaration
- IProfileVariableBase - deprecated type declaration since 5.1. Use ProfileVariableBase instead.
- ProfileValue - added type declaration
- IProfileValue - deprecated type declaration since 5.1. Use ProfileValue instead.
- ProfileDictionary - added type declaration
- IProfileDictionary - deprecated type declaration since 5.1. Use ProfileDictionary instead.
- ProfileArray - added type declaration
- IProfileArray - deprecated type declaration since 5.1. Use ProfileArray instead.
- ProfileFeature - added type declaration
- IProfileFeature - deprecated type declaration since 5.1. Use ProfileFeature instead.
- ProfileFeatureSet - added type declaration
- IProfileFeatureSet - deprecated type declaration since 5.1. Use ProfileFeatureSet instead.
- ProfileFeatureSetCollection - added type declaration
- IProfileFeatureSetCollection - deprecated type declaration since 5.1. Use ProfileFeatureSetCollection instead.
- ProfileVoxel - added type declaration
- IProfileVoxel - deprecated type declaration since 5.1. Use ProfileVoxel instead.
- ProfilePixel - added type declaration
- IProfilePixel - deprecated type declaration since 5.1. Use ProfilePixel instead.
- FeatureLikeProfile - added type declaration
- IFeatureLikeProfile - deprecated type declaration since 5.1. Use FeatureLikeProfile instead.
- PortalItemProperties - added type declaration
- IPortalItemProperties - deprecated type declaration since 5.1. Use PortalItemProperties instead.
- PortalItemDefinition - added type declaration
- IPortalItemDefinition - deprecated type declaration since 5.1. Use PortalItemDefinition instead.
- FeatureLayerItemDefinition - added type declaration
- IFeatureLayerItemDefinition - deprecated type declaration since 5.1. Use FeatureLayerItemDefinition instead.
- UrlDefinition - added type declaration
- IUrlDefinition - deprecated type declaration since 5.1. Use UrlDefinition instead.
- FieldsDefinition - added type declaration
- IFieldsDefinition - deprecated type declaration since 5.1. Use FieldsDefinition instead.
- ExtendedPredefinedProfile - added type declaration
- IExtendedPredefinedProfile - deprecated type declaration since 5.1. Use ExtendedPredefinedProfile instead.
- EditorCodeSuggestionGroup - added type declaration
- IEditorCodeSuggestionGroup - deprecated type declaration since 5.1. Use EditorCodeSuggestionGroup instead.
- EditorCodeSuggestion - added type declaration
- IEditorCodeSuggestion - deprecated type declaration since 5.1. Use EditorCodeSuggestion instead.
- ContextReferences - added type declaration
- IContextReferences - deprecated type declaration since 5.1. Use ContextReferences instead.
- EditorTestContext - added type declaration
- IEditorTestContext - deprecated type declaration since 5.1. Use EditorTestContext instead.
- arcgis-arcade-editor/
- arcgis-arcade-editor
- disableAssistant - added property
- enableDebugger - added property
- messageOverrides - added property
- arcgis-arcade-editor
- types/
Common components changes
Embeddable components changes
- components/
- arcgis-embedded-map/
- arcgis-embedded-map
- floorFilterEnabled - added property
- locateEnabled - added property
- trackEnabled - added property
- arcgis-embedded-map
- arcgis-embedded-map/
AI components changes
- agent-utils/
- BaseAgent - added class
- FunctionAgent/
- FunctionAgentExecute - added type declaration
- FunctionAgent - added class
- FunctionAgentConstructProperties - added type declaration
- LLMAgent/
- LLMAgent - added class
- LLMAgentConstructProperties - added type declaration
- WorkflowAgent/
- WorkflowAgent - added class
- WorkflowAgentConstructProperties - added type declaration
- index/
- createSchema() - added function
- UXSuggestion - added type declaration
- sendUXSuggestion() - added function
- createFunctionAgent() - added function
- createFunctionTool() - added function
- createLLMAgent() - added function
- createWorkflowAgent() - added function
- createConditionalWorkflow() - added function
- createLoopWorkflow() - added function
- createParallelWorkflow() - added function
- createRouterWorkflow() - added function
- createSequentialWorkflow() - added function
- createSwitchWorkflow() - added function
- types/
- AgentData - added type declaration
- EmptyAgentData - added type declaration
- SchemaPrimitiveFieldType - added type declaration
- SchemaArrayItemDefinition - added type declaration
- SchemaFieldDefinition - added type declaration
- SchemaDefinition - added type declaration
- SchemaDefinitionData - added type declaration
- AgentRuntimeState - added type declaration
- AgentGraphState - added type declaration
- BaseAgentLike - added type declaration
- AgentExecutionConfig - added type declaration
- AgentCustomState - added type declaration
- AgentNodeState - added type declaration
- AgentNodeUpdate - added type declaration
- AgentStateAnnotation - added type declaration
- RunnableUpdate - added type declaration
- TypedStateGraph - added type declaration
- AgentCreateGraph - added type declaration
- ZodObjectSchema - added type declaration
- GraphNodes - added type declaration
- GraphEdge - added type declaration
- SchemaFieldData - added type declaration
- middlewares/
- humanInTheLoop/
- HumanInTheLoopInterruptRequest - added type declaration
- HumanInTheLoopInterrupt - added type declaration
- HumanInTheLoopMiddlewareOptions - added type declaration
- HumanInTheLoopToolMessageRequest - added type declaration
- HumanInTheLoopToolMiddlewareOptions - added type declaration
- createHumanInTheLoopMiddleware() - added function
- createHumanInTheLoopToolMiddleware() - added function
- getHumanInTheLoopPayload() - added function
- middleware/
- createAgentMiddleware() - added function
- createToolMiddleware() - added function
- types/
- MiddlewareHandler - added type declaration
- Middleware - added type declaration
- AgentMiddlewareAgent - added type declaration
- AgentRunRequest - added type declaration
- AgentMiddlewareHandler - added type declaration
- AgentMiddleware - added type declaration
- AfterAgentRequest - added type declaration
- AgentMiddlewareHooks - added type declaration
- ToolMiddlewareHooks - added type declaration
- LangChainMiddlewareHooks - added type declaration
- ModelLifecycleHook - added type declaration
- humanInTheLoop/
- tools/
- FunctionTool/
- FunctionToolExecute - added type declaration
- FunctionToolResult - added type declaration
- FunctionToolMiddlewareRequest - added type declaration
- FunctionToolMiddlewareHandler - added type declaration
- FunctionToolMiddleware - added type declaration
- ToolResultMode - added type declaration
- FunctionToolLike - added type declaration
- FunctionTool - added class
- FunctionToolMiddlewareTool - added type declaration
- FunctionToolConstructProperties - added type declaration
- FunctionTool/
- workflows/
- BaseWorkflow/
- WorkflowGenerateResult - added type declaration
- BaseWorkflow - added class
- ConditionalWorkflow/
- ConditionDecider - added type declaration
- ConditionalWorkflow - added class
- ConditionalWorkflowConstructProperties - added type declaration
- LoopWorkflow/
- LoopDecider - added type declaration
- LoopWorkflow - added class
- LoopWorkflowConstructProperties - added type declaration
- ParallelWorkflow/
- ParallelWorkflow - added class
- ParallelWorkflowConstructProperties - added type declaration
- RouterWorkflow/
- RouterWorkflow - added class
- RouterWorkflowConstructProperties - added type declaration
- SequentialWorkflow/
- SequentialWorkflow - added class
- SequentialWorkflowConstructProperties - added type declaration
- SwitchWorkflow/
- SwitchDecider - added type declaration
- SwitchWorkflow - added class
- SwitchWorkflowConstructProperties - added type declaration
- BaseWorkflow/
- components/
- arcgis-assistant/
- arcgis-assistant
- assistantAvatarEnabled - added property
- awaitingResponse - added property
- awaitingResponseStep - added property
- interrupt - added property
- streamingDisabled - added property
- cancelInterrupt() - added method
- submitInterrupt() - added method
- @arcgisPromptSelect - added event
- @arcgisResponse - added event
- @arcgisSlottableRequest - added event
- header-actions-start - added slot
- message-starter - added slot
- messages - added slot
- message-loading - added slot
- interrupt - added slot
- chat-entry - added slot
- entry-actions-end - added slot
-
- removed slot
- types/
- AssistantPromptSelectDetail - added type declaration
- AssistantSlottableRequestDetail - added type declaration
- AssistantSlottableRequestData - added type declaration
- AssistantSlottableRequestName - added type declaration
- AssistantMessage
- blocks - added property
- isStreaming - added property
- interrupts - added property
- arcgis-assistant
- arcgis-assistant-knowledge-agent/
- arcgis-assistant-knowledge-agent - added component
- ArcgisKnowledgeAssistantContext - added type declaration
- arcgis-assistant-chat-entry/
- arcgis-assistant-chat-entry - added component
- arcgis-assistant-interrupt/
- arcgis-assistant-interrupt - added component
- arcgis-assistant-message/
- arcgis-assistant-message - added component
- arcgis-assistant-message-block/
- arcgis-assistant-message-block - added component
- arcgis-assistant-message-feedback/
- arcgis-assistant-message-feedback - added component
- arcgis-assistant-message-footer/
- arcgis-assistant-message-footer - added component
- arcgis-assistant-message-loading/
- arcgis-assistant-message-loading - added component
- arcgis-assistant-message-log/
- arcgis-assistant-message-log - added component
- arcgis-assistant-message-read-aloud/
- arcgis-assistant-message-read-aloud - added component
- arcgis-assistant-message-text/
- arcgis-assistant-message-text - added component
- arcgis-assistant-suggested-prompts/
- arcgis-assistant-suggested-prompts - added component
- arcgis-assistant-user-message/
- arcgis-assistant-user-message - added component
- arcgis-assistant/
- utils/
- index/
- ChatHistory - added type declaration
- UXSuggestion - added type declaration
- AgentStatus - added type declaration
- PriorStep - added type declaration
- AgentExecutionContext - added type declaration
- createAgentRuntimeState() - added function
- createAgentRuntimeStateWithSharedState() - added function
- sendUXSuggestion() - added function
- SharedState - added type declaration
- SharedStatePatch - added type declaration
- ArcgisPromptOptions
- config - added property
- index/
Core API changes
- Importing JS Maps SDK modules using
require()is deprecated since version 5.0 and may be removed at version 6.0.$arcgis.import()is the preferred way to import modules in your HTML applications - The
__esrinamespace is no longer supported for importing types and will be removed at 6.0. Use individual ESM imports to directly import types from their respective module files instead. See TypeScript import changes for more information. - SASS-based styling for legacy widgets was deprecated in 4.31 and will be removed at 6.0. Migrate to Calcite styling. See the Building your UI guide for details.
- Static creation methods on Mesh are deprecated and will be removed at version 6.0. Use the corresponding functions on meshUtils instead:
createBox(),createSphere(),createCylinder(),createPlane(),createFromPolygon(), andcreateFromGLTF(). The newmeshUtils.createFromPolygon()function is asynchronous so it can load the tessellation utilities needed for complex polygons.
- WebLinkChart/
- WebLinkChartApplyLayoutOptions
- lockedNodeLocations - deprecated property since version 5.0. Use
lockedEntityLocationsinstead. - rootEntityIds - deprecated property since version 5.1. Use ‘layoutSettings.rootedLayoutSettings.rootEntities’ instead.
- lockedNodeLocations - deprecated property since version 5.0. Use
- WebLinkChartApplyLayoutOptions
- arcade/
- ExecuteContext
- lruCache - deprecated property since version 5.0. Use
cacheinstead.
- lruCache - deprecated property since version 5.0. Use
- ExecutorOptions
- lruCache - deprecated property since version 5.0. Use
cacheinstead.
- lruCache - deprecated property since version 5.0. Use
- ExecuteContext
- unionTypes/
- GeometryUnion - deprecated type declaration since version 5.0. Use GeometryUnion instead.
- SymbolUnion - deprecated type declaration since version 5.0. Use SymbolUnion instead.
- AnalysisView3DUnion - deprecated type declaration since version 5.0. Use AnalysisView3DUnion instead.
- AnalysisView2DUnion - deprecated type declaration since version 5.0. Use AnalysisView2DUnion instead.
- AnalysisUnion - deprecated type declaration since version 5.0. Use AnalysisUnion instead.
- RendererUnion - deprecated type declaration since version 5.0. Use RendererUnion instead.
- RasterRendererUnion - deprecated type declaration since version 5.0. Use RasterRendererUnion instead.
- PointCloudRendererUnion - deprecated type declaration since version 5.0. Use PointCloudRendererUnion instead.
- FillSymbol2DUnion - deprecated type declaration since version 5.0. Use FillSymbolUnion instead.
- MarkerSymbol2DUnion - deprecated type declaration since version 5.0. Use MarkerSymbolUnion instead.
- Symbol3DLayerUnion - deprecated type declaration since version 5.0. Use Symbol3DLayerUnion instead.
- Symbol3DUnion - deprecated type declaration since version 5.0. Use Symbol3DUnion instead.
- Symbol2D3DUnion - deprecated type declaration since version 5.0. Use Symbol2D3DUnion instead.
- RendererWithVisualVariablesUnion - deprecated type declaration since version 5.0. Use RendererWithVisualVariablesUnion instead.
- Symbol2DUnion - deprecated type declaration since version 5.0. Use Symbol2DUnion instead.
- AnalysisViewUnion - deprecated type declaration since version 5.0. Use AnalysisViewUnion instead.
- analysis/
- ShadowCastAnalysis
- geometry - added property
- visualizeSunlight - added property
- Viewshed
- elevationInfo - added property
- ElevationProfile/
- ElevationProfileGroup - added class
- ShadowCast/
- DiscreteOptions
- colorStops - added property
- TotalDurationOptions
- colorStops - added property
- DiscreteOptions
- ShadowCastAnalysis
- core/
- Accessor/
- WatchCallback - deprecated type declaration since version 4.32. Use watch() instead.
- Accessor
- types/
- ScreenRect - added type declaration
- accessorSupport/
- decorators/
- aliasOf() - deprecated function since version 5.0. Create a getter instead.
- types/
- decorators/
- Accessor/
- editing/
- types/
- AttachmentEditOptions - added type declaration
- AddAttachmentOptions - added type declaration
- templates/
- TemplateListItem - added class
- types/
- form/
- FormTemplate
- supportsAttachmentElements - added property
- elements/
- AttachmentElement - added type declaration
- AttachmentElement - added class
- inputs/
- MultipleChoiceInput - added type declaration
- MultipleChoiceInput - added class
- attachments/
- AttachmentInput - added class
- AudioInput - added class
- DocumentInput - added class
- ImageInput - added class
- Input - added class
- SignatureInput - added class
- VideoInput - added class
- types/
- AttachmentInputUnion - added type declaration
- AttachmentInputType - added type declaration
- NestableAttachmentInputUnion - added type declaration
- multipleChoice/
- Choice - added class
- OtherChoice - added class
- FormTemplate
- geometry/
- Circle
- centroid - deprecated property since version 4.34. Please use the centroidOperator instead.
- Mesh/
- CreateFromPolygonParameters - deprecated type declaration since version 5.1. Use CreateFromPolygonParameters in
meshUtilsinstead. - Mesh
- createBox() - deprecated method since version 5.1. Use createBox() instead.
- createCylinder() - deprecated method since version 5.1. Use createCylinder() instead.
- createFromGLTF() - deprecated method since version 5.1. Use createFromGLTF() instead.
- createFromPolygon() - deprecated method since version 5.1. Use createFromPolygon() instead.
- createPlane() - deprecated method since version 5.1. Use createPlane() instead.
- createSphere() - deprecated method since version 5.1. Use createSphere() instead.
- CreateFromPolygonParameters - deprecated type declaration since version 5.1. Use CreateFromPolygonParameters in
- Polygon
- centroid - deprecated property since version 4.34. Please use the centroidOperator instead.
- geometryEngine/
- extendedSpatialReferenceInfo() - deprecated function since version 4.32.
- clip() - deprecated function since version 4.32. Use clipOperator instead.
- cut() - deprecated function since version 4.32. Use cutOperator instead.
- contains() - deprecated function since version 4.32. Use containsOperator instead.
- crosses() - deprecated function since version 4.32. Use crossesOperator instead.
- distance() - deprecated function since version 4.32. Use distanceOperator instead.
- equals() - deprecated function since version 4.32. Use equalsOperator instead.
- intersects() - deprecated function since version 4.32. Use intersectsOperator instead.
- touches() - deprecated function since version 4.32. Use touchesOperator instead.
- within() - deprecated function since version 4.32. Use withinOperator instead.
- disjoint() - deprecated function since version 4.32. Use disjointOperator instead.
- overlaps() - deprecated function since version 4.32. Use overlapsOperator instead.
- relate() - deprecated function since version 4.32. Use relateOperator instead.
- isSimple() - deprecated function since version 4.32. Use simplifyOperator’s isSimple() method instead.
- simplify() - deprecated function since version 4.32. Use simplifyOperator instead.
- convexHull() - deprecated function since version 4.32. Use convexHullOperator instead.
- difference() - deprecated function since version 4.32. Use differenceOperator instead.
- symmetricDifference() - deprecated function since version 4.32. Use symmetricDifferenceOperator instead.
- intersect() - deprecated function since version 4.32. Use intersectionOperator instead.
- union() - deprecated function since version 4.32. Use unionOperator instead.
- offset() - deprecated function since version 4.32. Use offsetOperator instead.
- buffer() - deprecated function since version 4.32. Use bufferOperator instead.
- geodesicBuffer() - deprecated function since version 4.32. Use geodesicBufferOperator instead.
- nearestCoordinate() - deprecated function since version 4.32. Use proximityOperator’s getNearestCoordinate() method instead.
- nearestVertex() - deprecated function since version 4.32. Use proximityOperator’s getNearestVertex() method instead.
- nearestVertices() - deprecated function since version 4.32. Use proximityOperator’s getNearestVertices() method instead.
- rotate() - deprecated function since version 4.32. Use Transformation’s rotate() method and the affineTransformOperator instead.
- flipHorizontal() - deprecated function since version 4.32. Use Transformation’s flipY() method and the affineTransformOperator instead.
- flipVertical() - deprecated function since version 4.32. Use Transformation’s flipX() method and the affineTransformOperator instead.
- generalize() - deprecated function since version 4.32. Use generalizeOperator instead.
- densify() - deprecated function since version 4.32. Use densifyOperator instead.
- geodesicDensify() - deprecated function since version 4.32. Use geodeticDensifyOperator instead.
- planarArea() - deprecated function since version 4.32. Use areaOperator instead.
- planarLength() - deprecated function since version 4.32. Use lengthOperator instead.
- geodesicArea() - deprecated function since version 4.32. Use geodeticAreaOperator instead.
- geodesicLength() - deprecated function since version 4.32. Use geodeticLengthOperator instead.
- intersectLinesToPoints() - deprecated function since version 4.32. Use intersectionOperator’s executeMany() method instead.
- geometryEngineTypes/
- LinearUnit - deprecated type declaration since version 4.32. Use LengthUnit instead.
- AreaUnit - deprecated type declaration since version 4.32. Use AreaUnit instead.
- ExtendedSpatialReferenceInfo - deprecated type declaration since version 4.32.
- NearestPointResult - deprecated type declaration since version 4.32. Use proximityOperator’s ProximityResult instead.
- support/
- geodesicUtils/
- geodesicAreas() - deprecated function since version 4.33. Use geodeticAreaOperator instead.
- geodesicLengths() - deprecated function since version 4.33. Use geodeticLengthOperator instead.
- geodesicDensify() - deprecated function since version 4.33. Use geodeticDensifyOperator instead.
- geodesicDistance() - deprecated function since version 4.33. Use geodeticUtilsOperator’s calculateDistanceAndAzimuth method instead.
- pointFromDistance() - deprecated function since version 4.33. Use geodeticUtilsOperator’s pointFromDistance method instead.
- InverseGeodeticSolverResult - deprecated type declaration since version 4.33. Use geodeticUtilsOperator’s CalculateDistanceAndAzimuthResult instead.
- meshUtils/
- createBox() - added function
- createSphere() - added function
- createCylinder() - added function
- createPlane() - added function
- createFromPolygon() - added function
- createFromGLTF() - added function
- CreateFromPolygonParameters - added type declaration
- geodesicUtils/
- Circle
- graphic/
- AnnotationFeatureGraphicOrigin - added class
- DimensionFeatureGraphicOrigin - added class
- isAnnotationFeatureGraphicOrigin() - added function
- isDimensionFeatureGraphicOrigin() - added function
- layers/
- BingMapsLayer - deprecated class since version 4.33.
- AnnotationFeatureLayer/
- AnnotationFeatureLayerEvents - added type declaration
- AnnotationFeatureLayer - added class
- CatalogLayer
- effectiveUniqueIdFields - added property
- DimensionFeatureLayer/
- DimensionFeatureLayerEvents - added type declaration
- DimensionFeatureLayer - added class
- FeatureLayer
- dataSeriesInfos - added property
- effectiveUniqueIdFields - added property
- reloading - added property
- symbolLayerDrawing - added property
- reload() - added method
- ImageryLayer
- charts - added property
- createQuery() - added method
- ImageryTileLayer
- charts - added property
- IntegratedMesh3DTilesLayer
- clone() - added method
- OrientedImageryLayer
- dataSeriesInfos - added property
- effectiveUniqueIdFields - added property
- reloading - added property
- sequenceOrderFields - added property
- symbolLayerDrawing - added property
- reload() - added method
- ParquetLayer
- data - added property
- definitionExpression - added property
- urls - deprecated property since 5.1. Use data with ParquetFilesData instead.
- createQuery() - added method
- SceneLayer
- queryModel() - added method
- queryModels() - added method
- SubtypeGroupLayer
- effectiveUniqueIdFields - added property
- VideoLayer
- coverage - added property
- previewsInfo - added property
- sensorPathSymbol - added property
- WCSLayer
- charts - added property
- types/
- DataCapabilities
- queryFormats - added property
- sourceFormats - added property
- QueryCapabilities
- supportsTrueCurve - deprecated property since version 5.0. Use DataCapabilities.supportsTrueCurve instead.
- AttachmentCapabilities
- supportsCountOnly - added property
- DataCapabilities
- catalog/
- CatalogFootprintLayer
- fieldConfigurations - added property
- createFieldConfigurations() - added method
- getFieldAlias() - added method
- getFieldConfiguration() - added method
- CatalogFootprintLayer
- mixins/
- DataSeriesLayer - added mixin
- ArcGISImageService
- createQuery() - added method
- FeatureLayerBase
- effectiveUniqueIdFields - added property
- orientedImagery/
- types/
- SequenceOrderFieldInfoJSON - added type declaration
- types/
- scene/
- ModelFileInfo - added class
- ModelInfo - added class
- types/
- QueryModelOptions - added type declaration
- support/
- AnnotationFeatureSublayer - added class
- GeometryEncodingLocation - added class
- GeometryEncodingWkb - added class
- ParquetFilesData - added class
- ParquetPortalItemData - added class
- SymbolLayerDrawing - added class
- TimeSeriesFieldTimeMapping - added class
- ParquetGeometryEncodingLocation - removed class
- ParquetGeometryEncodingWkb - removed class
- SpriteSource/
- GetSpriteInfo - deprecated type declaration since 5.0. use getSpriteInfo() instead.
- Sublayer
- effectiveUniqueIdFields - added property
- geometryType - added property
- loaded - added property
- uniqueIdFields - added property
- SubtypeSublayer
- fieldConfigurations - added property
- createFieldConfigurations() - added method
- getFieldAlias() - added method
- getFieldConfiguration() - added method
- TelemetryData
- sensorPath - added property
- TelemetryDisplay
- sensorPath - added property
- TimeSeriesInfo/
- TimeSeriesInfo - added class
- DataSeriesInfo - added type declaration
- dataSeriesUtils/
- getDataSeriesInfo() - added function
- parquetUtils/
- ParquetLayerInfo
- data - added property
- ParquetLayerInfo
- timeSeriesUtils/
- createTimeSeriesExpression() - added function
- getArcadeTimeFormatString() - added function
- types/
- ParquetDataUnion - added type declaration
- video/
- types/
- Coverage - added type declaration
- PreviewsInfo - added type declaration
- types/
- linkChart/
- RootedLayoutSettings - added class
- LayoutSettings
- rootedLayoutSettings - added property
- networks/
- CircuitManager/
- CommonCircuitQueryProperties - added type declaration
- QueryCircuitByNamesProperties - added type declaration
- QueryCircuitByIdsProperties - added type declaration
- QueryCircuitByLocationsProperties - added type declaration
- CircuitExportProperties - added type declaration
- CircuitVerifyProperties - added type declaration
- QueryCircuitProperties - removed type declaration
- ExportCircuitsProperties - removed type declaration
- VerifyCircuitsProperties - removed type declaration
- CircuitManager
- submitExportJob() - added method
- submitVerifyJob() - added method
- UnitIdentifierManager
- generateCombineNetworkElements() - added method
- generateDivideNetworkElements() - added method
- reserve() - added method
- insertGap() - removed method
- UtilityNetwork
- generateCombineNetworkElements() - removed method
- generateDivideNetworkElements() - removed method
- support/
- CircuitExportJobInfo/
- CircuitExportJobStatus - added type declaration
- WaitForExportOptions - added type declaration
- CircuitExportJobInfo - added class
- CircuitVerifyJobInfo/
- CircuitVerifyJobStatus - added type declaration
- WaitForVerifyOptions - added type declaration
- CircuitVerifyJobInfo - added class
- NamedTraceConfiguration
- clone() - added method
- TopologyValidationJobInfo/
- WaitForValidateOptions
- interval - removed property
- statusCallback - removed property
- WaitForValidateOptions
- TraceConfiguration
- clone() - added method
- UNTraceConfiguration
- useDigitizedDirection - added property
- jsonTypes/
- DividePolicyType - added type declaration
- CombinePolicyType - added type declaration
- WavelengthSchemeJSON - added type declaration
- WavelengthJSON - added type declaration
- ColorSetJSON - added type declaration
- ColorCodeJSON - added type declaration
- ColorSchemeGroupJSON - added type declaration
- DividePolicyJSON - added type declaration
- CombinePolicyJSON - added type declaration
- PolicyType - removed type declaration
- ColorGroupJSON - removed type declaration
- PolicyJSON - removed type declaration
- CircuitExportResult
- isDefaultTraceConfigurationModified - added property
- status - added property
- circuitHasBeenDeleted - removed property
- NetworkSourceJSON
- usesGeometry - added property
- DomainNetworkJSON
- colorSets - added property
- wavelengthSchemes - added property
- ColorSchemeJSON
- colorSetId - added property
- FunctionJSON
- functionName - added property
- ResultType
- includeFlowDirections - added property
- typeUtils/
- WaitOptions - added type declaration
- CircuitHierarchy - added type declaration
- CircuitExportJobInfo/
- CircuitManager/
- popup/
- types/
- PopupAction - added type declaration
- InitialDisplayOptions - added type declaration
- PopupOpenOptions - added type declaration
- State - added type declaration
- FeatureFormattedAttributes - added type declaration
- LastEditInfo - added type declaration
- LayerInfo - added type declaration
- RelatedInfo - added type declaration
- support/
- FeatureAbilities - added class
- types/
- portal/
- jsonTypes/
- TelemetryElementFilter - added type declaration
- jsonTypes/
- renderers/
- support/
- AuthoringInfo
- dataSeriesName - added property
- AuthoringInfoVisualVariable
- dataSeriesName - added property
- ClassBreakInfo
- alternateSymbols - added property
- UniqueValueClass
- alternateSymbols - added property
- UniqueValueInfo
- alternateSymbols - added property
- AuthoringInfo
- support/
- rest/
- knowledgeGraphService/
- executeCreateReplica() - added function
- fetchReplicaDefinition() - added function
- fetchReplicasInformation() - added function
- executeUnregisterReplica() - added function
- knowledgeGraph/
- CreateReplicaResponse/
- CreateReplicaResponse - added class
- CreateReplicaResult - added type declaration
- GraphApplyEditsResult
- GraphDeleteNamedTypeResult
- warnings - added property
- GraphQueryStreamingResult
- resultHeader - added property
- ReplicaDefinition/
- ReplicaDefinition - added class
- ReplicaReference - added type declaration
- ReplicaProvenanceOptions - added type declaration
- ReplicaDocumentOptions - added type declaration
- ReplicaNamedTypeDefinition - added type declaration
- ReplicaEntityTypeDefinition - added type declaration
- ReplicaRelationshipTypeDefinition - added type declaration
- ReplicaStaticDefinition - added type declaration
- ReplicaFilters - added type declaration
- ReplicaSyncDirection - added type declaration
- ReplicaSyncDataFormat - added type declaration
- BaseReplicaOptions - added type declaration
- ReferenceReplicaOptions - added type declaration
- FilterReplicaOptions - added type declaration
- ReplicasInformationResponse/
- ReplicasInformationResponse - added class
- ReplicaInformation - added type declaration
- UnregisterReplicaResponse/
- UnregisterReplicaResponse - added class
- UnregisterReplicaResult - added type declaration
- UnregisterReplicaOptions - added type declaration
- UnregisterAllReplicaOptions - added type declaration
- UnregisterReplicaIdsOptions - added type declaration
- CreateReplicaResponse/
- networks/
- circuits/
- support/
- ExportCircuitsResult - added class
- VerifyCircuitsResult - added class
- ExportCircuitsParameters
- outSpatialReference - added property
- QueryCircuitsParameters
- circuitHierarchy - added property
- circuitStatus - added property
- locations - added property
- location - removed property
- returnConsumerCircuits - removed property
- VerifyCircuitsParameters
- outSpatialReference - added property
- allCircuits - removed property
- continueOnFailure - removed property
- support/
- support/
- FunctionResult
- functionName - added property
- NetworkElement
- flowDirection - added property
- TelecomNetworkElement
- flowDirection - added property
- FunctionResult
- circuits/
- support/
- LocationToAddressParameters
- apiKey - added property
- featureTypes - added property
- language - added property
- preferredLabelValues - added property
- returnInputLocation - added property
- PrintParameters
- datumTransformations - added property
- types/
- GeocodeFeatureType - added type declaration
- GeocodePreferredLabel - added type declaration
- LocationToAddressParameters
- versionManagement/
- gdbVersion/
- support/
- DifferencesResult/
- DifferencesType - added type declaration
- FeaturesType - added type declaration
- DifferencesResult/
- support/
- gdbVersion/
- knowledgeGraphService/
- smartMapping/
- renderers/
- color/
- VisualVariableParametersBase
- dataSeriesName - added property
- ClassBreaksRendererParameters
- dataSeriesName - added property
- VisualVariableParametersBase
- opacity/
- VisualVariableParameters
- dataSeriesName - added property
- VisualVariableParameters
- size/
- VisualVariableParamsBase
- dataSeriesName - added property
- ClassBreaksRendererParameters
- dataSeriesName - added property
- VisualVariableParamsBase
- type/
- RendererParameters
- dataSeriesName - added property
- RendererParameters
- univariateColorSize/
- VisualVariablesParamsBase
- dataSeriesName - added property
- VisualVariablesParamsBase
- color/
- statistics/
- types/
- SummaryStatisticsParameters
- features - deprecated property since version 4.23. Use
useFeaturesInViewinstead.
- features - deprecated property since version 4.23. Use
- ClassBreaksParameters
- features - deprecated property since version 4.23. Use
useFeaturesInViewinstead.
- features - deprecated property since version 4.23. Use
- HistogramParameters
- features - deprecated property since version 4.23. Use
useFeaturesInViewinstead.
- features - deprecated property since version 4.23. Use
- UniqueValuesParameters
- features - deprecated property since version 4.23. Use
useFeaturesInViewinstead.
- features - deprecated property since version 4.23. Use
- SummaryStatisticsParameters
- types/
- renderers/
- support/
- actions/
- ActionBase
- className - deprecated property since version 5.1. Use the
iconproperty to set a Calcite icon instead.
- className - deprecated property since version 5.1. Use the
- ActionButton
- className - deprecated property since version 5.1. Use the
iconproperty to set a Calcite icon instead.
- className - deprecated property since version 5.1. Use the
- ActionToggle
- className - deprecated property since version 5.1. Use the
iconproperty to set a Calcite icon instead.
- className - deprecated property since version 5.1. Use the
- ActionBase
- actions/
- symbols/
- cim/
- types/
- CIMCharacterMarker - added type declaration
- CIMMarkerPlacementAtMeasuredUnits - added type declaration
- CIMMaterialSymbolLayer - added type declaration
- CIMObjectMarker3D - added type declaration
- MovementAlongLineType - added type declaration
- CIMSymbolAnimationMoveAlongLine - added type declaration
- CIMSymbolLayer
- name - added property
- CIMGeometricEffectControlMeasureLine
- width - added property
- types/
- cim/
- tables/
- elements/
- AttributeTableElement - deprecated type declaration since version 4.34. Import individual element modules directly instead.
- AttributeTableFieldElement - deprecated type declaration since version 4.34. Import AttributeTableFieldElement directly instead.
- AttributeTableGroupElement - deprecated type declaration since version 4.34. Import AttributeTableGroupElement directly instead.
- AttributeTableRelationshipElement - deprecated type declaration since version 4.34. Import AttributeTableRelationshipElement directly instead.
- AttributeTableAttachmentElement - deprecated type declaration since version 4.34. Import AttributeTableAttachmentElement directly instead.
- support/
- tablesUtils/
- NestedAttributeTableElement - deprecated type declaration since version 5.1. Use NestedAttributeTableElementUnion instead.
- templateUtils/
- createAttributeTableTemplateFromLayer() - added function
- createAttributeTableElementsFromColumns() - added function
- createNestedAttributeTableElementFromColumn() - added function
- createTableTemplateFromLayer() - added function
- createTableTemplateFromAttributeTableTemplate() - added function
- createColumnTemplatesFromElements() - added function
- createColumnTemplatesFromColumns() - added function
- createNestedColumnTemplateFromColumn() - added function
- createNestedColumnTemplateFromElement() - added function
- isTableTemplate() - added function
- isAttributeTableTemplate() - added function
- syncAttributeTableTemplateWithTable() - added function
- syncAttributeTableTemplateWithColumns() - added function
- types/
- AttributeTableElementUnion - added type declaration
- NestedAttributeTableElementUnion - added type declaration
- CreateTemplateParameters - added type declaration
- CreateTableTemplateFromAttributeTableTemplateParameters - added type declaration
- tablesUtils/
- elements/
- views/
- DOMContainer
- ui - deprecated property since 5.1. Please use arcgis-map, arcgis-scene or arcgis-link-chart with slots instead.
- LinkChartView
- ui - deprecated property since 5.1. Please use arcgis-map, arcgis-scene or arcgis-link-chart with slots instead.
- fetchPopupFeatures() - added method
- MapView
- ui - deprecated property since 5.1. Please use arcgis-map, arcgis-scene or arcgis-link-chart with slots instead.
- fetchPopupFeatures() - added method
- PopupView/
- FetchPopupFeaturesOptions - added type declaration
- PopupView
- fetchPopupFeatures() - added method
- SceneView
- ui - deprecated property since 5.1. Please use arcgis-map, arcgis-scene or arcgis-link-chart with slots instead.
- fetchPopupFeatures() - added method
- VideoView
- operationalDataVisible - added property
- ui - deprecated property since 5.1. Please use arcgis-map, arcgis-scene or arcgis-link-chart with slots instead.
- View2D
- ui - deprecated property since 5.1. Please use arcgis-map, arcgis-scene or arcgis-link-chart with slots instead.
- fetchPopupFeatures() - added method
- hitTest() - added method
- types/
- LayerHit - added type declaration
- RasterHit - added type declaration
- SceneViewLayerHit - added type declaration
- 2d/
- types/
- LayerView2DMap
- annotation-feature - added property
- dimension-feature - added property
- LayerView2DMap
- types/
- 3d/
- types/
- LayerView3DMap
- annotation-feature - added property
- dimension-feature - added property
- LayerView3DMap
- webgl/
- ManagedColorAttachment
- declaredClass - added property
- ManagedDepthAttachment
- declaredClass - added property
- ManagedFBO
- declaredClass - added property
- ManagedFBOAttachment
- declaredClass - added property
- ManagedFBOResource
- declaredClass - added property
- ManagedColorAttachment
- types/
- layers/
- AnnotationFeatureLayerView - added class
- DimensionFeatureLayerView - added class
- CSVLayerView
- hasM - added property
- hasZ - added property
- highlightOptions - deprecated property since version 4.34. Use the View.highlights property instead.
- CatalogFootprintLayerView
- hasM - added property
- hasZ - added property
- highlightOptions - deprecated property since version 4.34. Use the View.highlights property instead.
- FeatureLayerView
- hasM - added property
- hasZ - added property
- highlightOptions - deprecated property since version 4.34. Use the View.highlights property instead.
- FeatureLikeLayerView
- hasM - added property
- hasZ - added property
- highlightOptions - deprecated property since version 4.34. Use the View.highlights property instead.
- GeoJSONLayerView
- hasM - added property
- hasZ - added property
- highlightOptions - deprecated property since version 4.34. Use the View.highlights property instead.
- GraphicsLayerView
- highlightOptions - deprecated property since version 4.34. Use the View.highlights property instead.
- ImageryLayerView
- highlightOptions - deprecated property since version 4.34. Use the View.highlights property instead.
- KnowledgeGraphSublayerView
- hasM - added property
- hasZ - added property
- highlightOptions - deprecated property since version 4.34. Use the View.highlights property instead.
- OGCFeatureLayerView
- hasM - added property
- hasZ - added property
- highlightOptions - deprecated property since version 4.34. Use the View.highlights property instead.
- OrientedImageryLayerView
- hasM - added property
- hasZ - added property
- highlightOptions - deprecated property since version 4.34. Use the View.highlights property instead.
- ParquetLayerView
- hasM - added property
- hasZ - added property
- highlightOptions - deprecated property since version 4.34. Use the View.highlights property instead.
- StreamLayerView
- hasM - added property
- hasZ - added property
- highlightOptions - deprecated property since version 4.34. Use the View.highlights property instead.
- SubtypeGroupLayerView
- hasM - added property
- hasZ - added property
- highlightOptions - deprecated property since version 4.34. Use the View.highlights property instead.
- WFSLayerView
- hasM - added property
- hasZ - added property
- highlightOptions - deprecated property since version 4.34. Use the View.highlights property instead.
- selection/
- SelectionOperation - added class
- types/
- SelectableParentLayerUnion - added type declaration
- SelectableLayerSourceUnion - added type declaration
- SelectionSource - added type declaration
- SelectableViewUnion - added type declaration
- SelectorGeometry - added type declaration
- SelectionToolName - added type declaration
- SelectionOperationType - added type declaration
- SelectableLayerViewBase - added type declaration
- SelectableLayerViewWithGraphics - added type declaration
- SelectableLayerViewWithObjectIds - added type declaration
- SelectableLayerView - added type declaration
- SelectionOperationEvents - added type declaration
- SelectionCompleteEventInfo - added type declaration
- SelectionChangeEventInfo - added type declaration
- SelectionOperationCreateTool - added type declaration
- ui/
- DefaultUI - deprecated class since 5.1. Please use arcgis-map, arcgis-scene or arcgis-link-chart with slots instead.
- DOMContainer
- webdoc/
- widgets/
- FloorFilter/
- FloorVisibilityMode - added type declaration
- FloorFilter
- floorVisibilityMode - added property
- FloorFilter/
- widgets/
- widgets/
- AreaMeasurement2D - deprecated class since version 5.0. Use the Area Measurement 2D component instead. For information on widget deprecation, read about Esri’s move to web components.
- AreaMeasurement3D - deprecated class since version 4.33. Use the Area Measurement 3D component instead. For information on widget deprecation, read about Esri’s move to web components.
- Attachments - deprecated class since version 5.0. Use the Popup and Editor components to view and edit attachments instead. For information on widget deprecation, read about Esri’s move to web components.
- Attribution - deprecated class since version 5.0. As of 5.0, attribution is handled automatically by the Map, Scene, and Link Chart components, with properties for extracting attribution items, hiding the attribution, as well as setting dark and light mode for the attribution. For information on widget deprecation, read about Esri’s move to web components.
- BasemapGallery - deprecated class since version 4.32. Use the Basemap Gallery component instead. For information on widget deprecation, read about Esri’s move to web components.
- BasemapLayerList - deprecated class since version 5.0. Use the Basemap Layer List component instead. For information on widget deprecation, read about Esri’s move to web components.
- BasemapToggle - deprecated class since version 4.32. Use the Basemap Toggle component instead. For information on widget deprecation, read about Esri’s move to web components.
- Bookmarks - deprecated class since version 4.34. Use the Bookmarks component instead. For information on widget deprecation, read about Esri’s move to web components.
- CatalogLayerList - deprecated class since version 5.0. Use the Catalog Layer List component instead. For information on widget deprecation, read about Esri’s move to web components.
- Compass - deprecated class since version 4.32. Use the Compass component instead. For information on widget deprecation, read about Esri’s move to web components.
- DirectLineMeasurement3D - deprecated class since version 4.33. Use the Direct Line Measurement 3D component instead. For information on widget deprecation, read about Esri’s move to web components.
- DirectionalPad - deprecated class since version 4.32. Use the Directional Pad component instead. For information on widget deprecation, read about Esri’s move to web components.
- Directions - deprecated class since version 5.0. Use the Directions component instead. For information on widget deprecation, read about Esri’s move to web components.
- DistanceMeasurement2D - deprecated class since version 5.0. Use the Distance Measurement 2D component instead. For information on widget deprecation, read about Esri’s move to web components.
- ElevationProfile - deprecated class since version 5.0. Use the Elevation Profile component instead. For information on widget deprecation, read about Esri’s move to web components.
- Expand - deprecated class since version 4.34. Use the Expand component instead. For information on widget deprecation, read about Esri’s move to web components.
- Feature - deprecated class since version 4.34. Use the Feature component instead. For information on widget deprecation, read about Esri’s move to web components.
- FeatureForm - deprecated class since version 5.0. Use the Feature Form component instead. For information on widget deprecation, read about Esri’s move to web components.
- FeatureTemplates - deprecated class since version 5.0. Use the Feature Templates (Legacy) component instead. For information on widget deprecation, read about Esri’s move to web components.
- Features - deprecated class since version 4.34. Use the Features component instead. For information on widget deprecation, read about Esri’s move to web components.
- FloorFilter - deprecated class since version 5.0. Use the Floor Filter component instead. For information on widget deprecation, read about Esri’s move to web components.
- Fullscreen - deprecated class since version 4.32. Use the Fullscreen component instead. For information on widget deprecation, read about Esri’s move to web components.
- Histogram - deprecated class since version 5.0. Use the Histogram component instead. For information on widget deprecation, read about Esri’s move to web components.
- HistogramRangeSlider - deprecated class since version 5.0. Use the Histogram and Slider components instead. For information on widget deprecation, read about Esri’s move to web components.
- Home - deprecated class since version 4.32. Use the Home component instead. For information on widget deprecation, read about Esri’s move to web components.
- LayerList - deprecated class since version 5.0. Use the Layer List component instead. For information on widget deprecation, read about Esri’s move to web components.
- Legend - deprecated class since version 4.34. Use the Legend component instead. For information on widget deprecation, read about Esri’s move to web components.
- LineOfSight - deprecated class since version 4.33. Use the Line Of Sight component instead. For information on widget deprecation, read about Esri’s move to web components.
- Locate - deprecated class since version 4.32. Use the Locate component instead. For information on widget deprecation, read about Esri’s move to web components.
- Measurement - deprecated class since version 5.0. Use the Area Measurement 2D, Area Measurement 3D, Direct Line Measurement 3D, or Distance Measurement 2D components instead. For information on widget deprecation, read about Esri’s move to web components.
- NavigationToggle - deprecated class since version 4.32. Use the Navigation Toggle component instead. For information on widget deprecation, read about Esri’s move to web components.
- Popup - deprecated class since 5.0. Use the Popup component instead. For information on widget deprecation, read about Esri’s move to web components.
- Print - deprecated class since version 4.33. Use the Print component instead. For information on widget deprecation, read about Esri’s move to web components.
- ScaleBar - deprecated class since version 4.32. Use the Scale Bar component instead. For information on widget deprecation, read about Esri’s move to web components.
- ScaleRangeSlider - deprecated class since version 5.0. Use the Scale Range Slider component instead. For information on widget deprecation, read about Esri’s move to web components.
- Search - deprecated class since version 4.33. Use the Search component instead. For information on widget deprecation, read about Esri’s move to web components.
- ShadowCast - deprecated class since version 5.0. Use the Shadow Cast component instead. For information on widget deprecation, read about Esri’s move to web components.
- Slice - deprecated class since version 4.33. Use the Slice component instead. For information on widget deprecation, read about Esri’s move to web components.
- Slider - deprecated class since version 5.0. Use the Slider component instead. For information on widget deprecation, read about Esri’s move to web components.
- Swipe - deprecated class since version 4.32. Use the Swipe component instead. For information on widget deprecation, read about Esri’s move to web components.
- TableList - deprecated class since version 5.0. Use the Table List component instead. For information on widget deprecation, read about Esri’s move to web components.
- TimeSlider - deprecated class since version 5.0. Use the Time Slider component instead. For information on widget deprecation, read about Esri’s move to web components.
- TimeZoneLabel - deprecated class since version 4.33. Use the Time Zone Label component instead.
- Track - deprecated class since version 4.32. Use the Track component instead. For information on widget deprecation, read about Esri’s move to web components.
- UtilityNetworkAssociations - deprecated class since version 5.0. Use the Utility Network Associations component instead. For information on widget deprecation, read about Esri’s move to web components.
- UtilityNetworkTrace - deprecated class since version 5.0. Use the Utility Network Trace Analysis component instead. For information on widget deprecation, read about Esri’s move to web components.
- UtilityNetworkValidateTopology - deprecated class since version 5.0. Use the Utility Network Validate Topology component instead. For information on widget deprecation, read about Esri’s move to web components.
- ValuePicker - deprecated class since version 5.0. Use the Value Picker (Legacy) component instead. For information on widget deprecation, read about Esri’s move to web components.
- VideoPlayer - deprecated class since version 4.33. Use the Video Player component instead. For information on widget deprecation, read about Esri’s move to web components.
- Weather - deprecated class since version 4.33. Use the Weather component instead. For information on widget deprecation, read about Esri’s move to web components.
- Zoom - deprecated class since version 4.32. Use the Zoom component instead. For information on widget deprecation, read about Esri’s move to web components.
- BatchAttributeForm - deprecated class since version 5.0. Use the Editor component to edit attributes of multiple features instead. For information on widget deprecation, read about Esri’s move to web components.
- @attachments-change - added event
- @value-change - deprecated event since 5.1. Use
"values-change"instead, as it provides more comprehensive information about changes to field values. - @values-change - added event
- BatchAttributeFormViewModel/
- BatchAttributeFormViewModelEvents
- value-change - deprecated property since 5.1. Use
"values-change"instead, as it provides more comprehensive information about changes to field values. - values-change - added property
- attachments-change - added property
- value-change - deprecated property since 5.1. Use
- BatchAttributeFormViewModel
- @attachments-change - added event
- @value-change - deprecated event since 5.1. Use
"values-change"instead, as it provides more comprehensive information about changes to field values. - @values-change - added event
- BatchAttributeFormViewModelEvents
- VisibleElements
- readOnlyNotice - added property
- types/
- PendingAttachmentEdits - added type declaration
- BaseAttachmentEdit - added type declaration
- AddAttachmentEdit - added type declaration
- UpdateAttachmentEdit - added type declaration
- DeleteAttachmentEdit - added type declaration
- AttachmentsChangeEvent - added type declaration
- SelectedAttachmentIdentifier - added type declaration
- ValueChangeActor - added type declaration
- ValuesChangeEvent - added type declaration
- ValuesChangeData - added type declaration
- ValueChange - added type declaration
- SubmitResult
- attachmentEdits - added property
- invalidAttachmentElementIds - added property
- expressions/
- types/
- ArcadeBatchFormCalculationContextInfo - added type declaration
- types/
- inputs/
- AttachmentElementInput - added class
- RelationshipElementInput - added class
- UtilityNetworkAssociationsElementInput - added class
- BatchFormInputs
- allAttachmentElementInputs - added property
- allEditableInputs - added property
- allGroupInputs - added property
- EditableInput
- valid - added property
- FieldInput/
- MultipleChoiceOtherChoiceRenderState - added type declaration
- FieldInput
- input - added property
- multipleChoiceOtherChoiceCheckboxState - added property
- getExplicitMultipleChoiceOtherChoiceCheckedState() - added method
- getMultipleChoiceOtherChoiceRenderState() - added method
- hasExplicitMultipleChoiceOtherChoiceCheckedState() - added method
- initializeExplicitMultipleChoiceOtherChoiceCheckedState() - added method
- setExplicitMultipleChoiceOtherChoiceCheckedState() - added method
- BuildingExplorer/
- VisibleElements - deprecated type declaration since version 5.0. Use the Building Explorer component instead. For information on widget deprecation, read about Esri’s move to web components.
- BuildingExplorer - deprecated class since version 5.0. Use the Building Explorer component instead. For information on widget deprecation, read about Esri’s move to web components.
- BuildingExplorerViewModel - deprecated class since version 5.0. Use the Building Explorer component instead. For information on widget deprecation, read about Esri’s move to web components.
- BuildingLevel - deprecated class since version 5.0. Use the Building Explorer component instead. For information on widget deprecation, read about Esri’s move to web components.
- BuildingNumericFilterViewModel - deprecated class since version 5.0. Use the Building Explorer component instead. For information on widget deprecation, read about Esri’s move to web components.
- BuildingPhase - deprecated class since version 5.0. Use the Building Explorer component instead. For information on widget deprecation, read about Esri’s move to web components.
- CoordinateConversion - deprecated class since version 4.34. Use the CoordinateConversion component instead. For information on widget deprecation, read about Esri’s move to web components.
- calculateCoordinatePrecision - added property
- removeLeadingZeros - added property
- CoordinateConversionViewModel
- calculateCoordinatePrecision - added property
- removeLeadingZeros - added property
- Daylight/
- DaylightEvents - deprecated type declaration since version 4.34. Use the Daylight component instead. For information on widget deprecation, read about Esri’s move to web components.
- Daylight - deprecated class since version 4.34. Use the Daylight component instead. For information on widget deprecation, read about Esri’s move to web components.
- VisibleElements - deprecated class since version 4.34. Use the Daylight component instead. For information on widget deprecation, read about Esri’s move to web components.
- DaylightViewModel/
- DaylightViewModelEvents - deprecated type declaration since version 4.34. Use the Daylight component instead. For information on widget deprecation, read about Esri’s move to web components.
- DaylightViewModel - deprecated class since version 4.34. Use the Daylight component instead. For information on widget deprecation, read about Esri’s move to web components.
- types/
- DateOrSeason - deprecated type declaration since version 4.34. Use the Daylight component instead. For information on widget deprecation, read about Esri’s move to web components.
- Season - deprecated type declaration since version 4.34. Use the Daylight component instead. For information on widget deprecation, read about Esri’s move to web components.
- Editor - deprecated class since version 5.0. Use the Editor component instead. For information on widget deprecation, read about Esri’s move to web components.
- formSystem - deprecated property This property, including support for using legacy form APIs, will be removed at 6.0 when ‘next’ becomes default.
- isUsingLegacyCreateTools - deprecated property
- useLegacyCreateTools - deprecated property
- deleteFeatureFromWorkflow() - deprecated method since version 4.33. Use deleteFeatures() instead.
- EditorViewModel
- formSystem - deprecated property This property, including support for using legacy form APIs, will be removed at 6.0 when ‘next’ becomes default.
- isUsingLegacyCreateTools - deprecated property
- useLegacyCreateTools - deprecated property
- deleteFeatureFromWorkflow() - deprecated method since version 4.33. Use deleteFeatures() instead.
- types/
- BatchAttributeFormProperties - added type declaration
- SupportingWidgetDefaults
- attachments - deprecated property since 5.1.
- batchAttributeForm - added property
- featureForm - deprecated property since 5.1.
- FeatureTable - deprecated class since version 5.0. Use the Feature Table component instead. For information on widget deprecation, read about Esri’s move to web components.
- allColumnsVisible - added property
- closed - added property
- collapsed - added property
- defaultSelectionManager - added property
- effectiveSelectionManager - added property
- filterByLayerScaleRange - added property
- filterByViewExtent - added property
- hideAllColumns() - added method
- @close - added event
- @toggle - added event
- ColumnVisibilityMenuVisibleElements - added class
- FeatureTableViewModel/
- FeatureTableViewModelEvents
- FeatureTableViewModel
- declaredClass - added property
- defaultSelectionManager - added property
- effectiveSelectionManager - added property
- filterByLayerScaleRange - added property
- filterByViewExtent - added property
- emit() - added method
- hasEventListener() - added method
- on() - added method
- @close - added event
- @toggle - added event
- FieldColumn
- VisibleElements
- close - added property
- collapse - added property
- columnVisibilityMenu - added property
- columnVisibilityMenuItems - added property
- Grid/
- GridViewModel - deprecated class Not for direct use. See FeatureTableViewModel.
- declaredClass - added property
- emit() - added method
- hasEventListener() - added method
- on() - added method
- types/
- TableMenuItemConfigDisabledFunction - added type declaration
- ColumnTableMenuConfig
- TableMenuItemConfig
- iconClass - deprecated property Since version 4.30. Use
iconinstead.
- iconClass - deprecated property Since version 4.30. Use
- GridViewModel - deprecated class Not for direct use. See FeatureTableViewModel.
- support/
- types/
- ActionColumnConfig
- frozen - added property
- ActionColumnConfig
- types/
- OrientedImageryViewer/
- OrientedImageryViewerEvents - added type declaration
- OrientedImageryViewerVisibleElements - added class
- OrientedImageryViewer - deprecated class since version 5.0. Use the Oriented Imagery Viewer component instead. For information on widget deprecation, read about Esri’s move to web components.
- visibleElements - added property
- loadBestImage() - added method
- @no-image-found - added event
- types/
- OrientedImageryViewerViewModelEvents - added type declaration
- Sketch - deprecated class since version 5.0. Use the Sketch component instead. For information on widget deprecation, read about Esri’s move to web components.
- isUsingLegacyCreateTools - deprecated property
- useLegacyCreateTools - deprecated property
- @duplicate - added event
- SketchViewModel/
- SketchViewModelEvents
- duplicate - added property
- SketchViewModel
- geometrySimplificationInProgress - added property
- isUsingLegacyCreateTools - deprecated property
- useLegacyCreateTools - deprecated property
- @duplicate - added event
- SketchViewModelEvents
- VisibleElements
- geometrySimplificationActivityIndicator - added property
- types/
- DuplicateEvent - added type declaration
- AreaMeasurement3D/
- AreaMeasurement3DViewModel/
- AreaMeasurement3DViewModel - deprecated class since version 4.33. Use the AreaMeasurementAnalysis or Area Measurement 3D component instead. For information on widget deprecation, read about Esri’s move to web components.
- MeasurementValue - deprecated type declaration since version 4.33. Use the AreaMeasurementAnalysis or Area Measurement 3D component instead. For information on widget deprecation, read about Esri’s move to web components.
- Measurement - deprecated type declaration since version 4.33. Use the AreaMeasurementAnalysis or Area Measurement 3D component instead. For information on widget deprecation, read about Esri’s move to web components.
- AreaMeasurement3DViewModel/
- Attachments/
- types/
- AttachmentsDisplay - deprecated type declaration since 5.0, use the Popup and Editor component to view and edit attachments instead.
- Operations - deprecated type declaration since 5.0, use the Popup and Editor component to view and edit attachments instead.
- AttachmentsCapabilities - deprecated type declaration since 5.0, use the Popup and Editor component to view and edit attachments instead.
- types/
- Attribution/
- AttributionViewModel - deprecated class since version 5.0. Attribution is handled automatically by the Map and Scene components, with properties for extracting attribution items, hiding the attribution, as well as setting dark and light mode for the attribution.
- Bookmarks/
- BookmarksViewModel - deprecated class since version 5.0. Use the Bookmarks component directly instead.
- Compass/
- CompassViewModel - deprecated class since version 5.1. Use the Compass component instead. For information on widget deprecation, read about Esri’s move to web components.
- DirectLineMeasurement3D/
- DirectLineMeasurement3DViewModel/
- DirectLineMeasurement3DViewModel - deprecated class since version 4.33. Use the DirectLineMeasurementAnalysis or Direct Line Measurement 3D component instead. For information on widget deprecation, read about Esri’s move to web components.
- MeasurementValue - deprecated type declaration since version 4.33. Use the Direct Line Measurement 3D component instead. For information on widget deprecation, read about Esri’s move to web components.
- Measurement - deprecated type declaration since version 4.33. Use the Direct Line Measurement 3D component instead. For information on widget deprecation, read about Esri’s move to web components.
- DirectLineMeasurement3DViewModel/
- ElevationProfile/
- ElevationProfileLine - deprecated class since version 5.0. Use the Elevation Profile component or ElevationProfileLine from ElevationProfileAnalysis instead. For information on widget deprecation, read about Esri’s move to web components.
- ElevationProfileLineGround - deprecated class since version 5.0. Use the Elevation Profile component or ElevationProfileLineGround from ElevationProfileAnalysis instead. For information on widget deprecation, read about Esri’s move to web components.
- ElevationProfileLineInput - deprecated class since version 5.0. Use the Elevation Profile component or ElevationProfileLineInput from ElevationProfileAnalysis instead. For information on widget deprecation, read about Esri’s move to web components.
- ElevationProfileLineQuery - deprecated class since version 5.0. Use the Elevation Profile component or ElevationProfileLineQuery from ElevationProfileAnalysis instead. For information on widget deprecation, read about Esri’s move to web components.
- ElevationProfileViewModel - deprecated class since version 5.0. Use the ElevationProfileAnalysis or Elevation Profile component instead. For information on widget deprecation, read about Esri’s move to web components.
- ElevationProfileVisibleElements - deprecated class since version 5.0. Use the Elevation Profile component instead. For information on widget deprecation, read about Esri’s move to web components.
- ElevationProfileLineView/
- ElevationProfileLineView - deprecated class since version 5.0. Use the Elevation Profile component or ElevationProfileLineScene from ElevationProfileAnalysis instead. For information on widget deprecation, read about Esri’s move to web components.
- HitTestOptionsItem - deprecated type declaration since version 5.0. Use the Elevation Profile component or ElevationProfileLineScene from ElevationProfileAnalysis instead. For information on widget deprecation, read about Esri’s move to web components.
- types/
- ElevationProfileState - deprecated type declaration since version 5.0. Use the Elevation Profile component or ElevationProfileLineScene from ElevationProfileAnalysis instead. For information on widget deprecation, read about Esri’s move to web components.
- ElevationProfileLineUnion - deprecated type declaration since version 5.0. Use the Elevation Profile component or ElevationProfileLineScene from ElevationProfileAnalysis instead. For information on widget deprecation, read about Esri’s move to web components.
- ElevationQuerySource - deprecated type declaration since version 5.0. Use the Elevation Profile component or ElevationProfileLineScene from ElevationProfileAnalysis instead. For information on widget deprecation, read about Esri’s move to web components.
- ElevationProfileSample - deprecated type declaration since version 5.0. Use the Elevation Profile component or ElevationProfileLineScene from ElevationProfileAnalysis instead. For information on widget deprecation, read about Esri’s move to web components.
- ElevationProfileStatistics - deprecated type declaration since version 5.0. Use the Elevation Profile component or ElevationProfileLineScene from ElevationProfileAnalysis instead. For information on widget deprecation, read about Esri’s move to web components.
- EffectiveUnits - deprecated type declaration since version 5.0. Use the Elevation Profile component or ElevationProfileLineScene from ElevationProfileAnalysis instead. For information on widget deprecation, read about Esri’s move to web components.
- ElevationProfileLineType - deprecated type declaration since version 5.0. Use the Elevation Profile component or ElevationProfileLineScene from ElevationProfileAnalysis instead. For information on widget deprecation, read about Esri’s move to web components.
- InteractionMode - deprecated type declaration since version 5.0. Use the Elevation Profile component or ElevationProfileLineScene from ElevationProfileAnalysis instead. For information on widget deprecation, read about Esri’s move to web components.
- InteractionStartOptions - deprecated type declaration since version 5.0. Use the Elevation Profile component or ElevationProfileLineScene from ElevationProfileAnalysis instead. For information on widget deprecation, read about Esri’s move to web components.
- Expand/
- ExpandViewModel - deprecated class since version 5.0. Use the Expand component directly instead.
- Features/
- FeaturesVisibleElements - deprecated class since 5.0, use the Features component instead.
- FloorFilter/
- FloorFilterViewModel
- floorVisibilityMode - added property
- FloorFilterViewModel
- Fullscreen/
- FullscreenViewModel - deprecated class since version 4.33. Use the JavaScript Fullscreen API directly instead.
- Histogram/
- HistogramViewModel - deprecated class since 5.1. Use the Histogram component instead. For information on widget deprecation, read about Esri’s move to web components.
- Home/
- HomeViewModel - deprecated class since 5.0. Use the Home component directly instead.
- LineOfSight/
- LineOfSightTarget - deprecated class since version 4.33. Use the LineOfSightAnalysisTarget on LineOfSightAnalysis instead.
- LineOfSightViewModel - deprecated class since version 4.33. Use the LineOfSightAnalysis or Line Of Sight component instead. For information on widget deprecation, read about Esri’s move to web components.
- Locate/
- LocateViewModel - deprecated class since version 4.34. Use the Locate component instead. For information on widget deprecation, read about Esri’s move to web components.
- NavigationToggle/
- NavigationToggleViewModel - deprecated class since version 4.33. Use the Navigation Toggle component instead. For information on widget deprecation, read about Esri’s move to web components.
- Popup/
- PopupVisibleElements - deprecated class since 5.0, use the Popup component instead.
- Print/
- CustomTemplate
- type - deprecated property since version 5.0.
- PrintViewModel
- datumTransformations - added property
- portalTemplateIds - deprecated property since version 5.0.
- CustomTemplate
- ShadowCast/
- DiscreteOptions - deprecated class since version 5.0. Use the Shadow Cast component or ShadowCastAnalysis instead. For information on widget deprecation, read about Esri’s move to web components.
- DurationOptions - deprecated class since version 5.0. Use the Shadow Cast component or ShadowCastAnalysis instead. For information on widget deprecation, read about Esri’s move to web components.
- ShadowCastVisibleElements - deprecated class since version 5.0. Use the ShadowCastAnalysis or Shadow Cast component instead. For information on widget deprecation, read about Esri’s move to web components.
- ThresholdOptions - deprecated class since version 5.0. Use the ShadowCastAnalysis or Shadow Cast component instead. For information on widget deprecation, read about Esri’s move to web components.
- ShadowCastViewModel/
- ShadowCastState - deprecated type declaration since version 5.0. Use the ShadowCastAnalysis or Shadow Cast component instead. For information on widget deprecation, read about Esri’s move to web components.
- ShadowCastViewModel - deprecated class since version 5.0. Use the Shadow Cast component or ShadowCastAnalysis instead. For information on widget deprecation, read about Esri’s move to web components.
- types/
- ShadowVisualizationType - deprecated type declaration since version 5.0. Use the ShadowCastAnalysis or Shadow Cast component instead. For information on widget deprecation, read about Esri’s move to web components.
- DurationMode - deprecated type declaration since version 5.0. Use the Shadow Cast component or ShadowCastAnalysis instead. For information on widget deprecation, read about Esri’s move to web components.
- Slice/
- SliceViewModel - deprecated class since version 4.33. Use the SliceAnalysis or Slice component instead. For information on widget deprecation, read about Esri’s move to web components.
- Slider/
- SliderViewModel - deprecated class since version 5.1. Use the Slider component instead. For information on widget deprecation, read about Esri’s move to web components.
- Track/
- TrackViewModel - deprecated class since version 5.1. Use the Track component instead. For information on widget deprecation, read about Esri’s move to web components.
- UtilityNetworkAssociations/
- UtilityNetworkAssociationsViewModel - deprecated class since version 5.0. Use UtilityNetwork.synthesizeAssociationGeometries() instead.
- UtilityNetworkTrace/
- UtilityNetworkTraceViewModel - deprecated class since version 5.0. Use UtilityNetworkTraceAnalysis.
- UtilityNetworkTraceAnalysis/
- UtilityNetworkTraceAnalysisViewModel - deprecated class since version 5.0. Use UtilityNetworkTraceAnalysis.
- UtilityNetworkValidateTopology/
- UtilityNetworkValidateTopologyViewModel - deprecated class since version 5.0. Use UtilityNetwork.validateTopology() instead.
- VersionManagement/
- VersionManagementViewModel - deprecated class since version 5.0. Use VersionManager instead since the VersionManagementViewModel will be removed in 6.0.
- VideoPlayer/
- VideoPlayerViewModel
- previewsInfo() - added method
- toggleLoopPlayback() - added method
- toggleSensorPathDisplay() - added method
- VideoPlayerViewModel
- Weather/
- VisibleElements - deprecated class since version 4.33. Use the Weather component instead. For information on widget deprecation, read about Esri’s move to web components.
- WeatherViewModel - deprecated class since version 4.33. Use the Weather component instead. For information on widget deprecation, read about Esri’s move to web components.
- types/
- WeatherState - deprecated type declaration since version 4.33. Use the Weather component instead. For information on widget deprecation, read about Esri’s move to web components.
- Zoom/
- ZoomViewModel - deprecated class since 5.0. Use the Zoom component instead. To access the
canZoomIn,canZoomOut,zoomIn(), andzoomOut()functionality, use the corresponding properties and methods on the Map component, Scene component, MapView, or SceneView directly.
- ZoomViewModel - deprecated class since 5.0. Use the Zoom component instead. To access the
- smartMapping/
- BinaryColorSizeSlider - deprecated class since version 5.0. Use the Slider Binary Color Size component instead. For information on widget deprecation, read about Esri’s move to web components.
- ClassedColorSlider - deprecated class since version 5.0. Use the Slider Classed Color component instead. For information on widget deprecation, read about Esri’s move to web components.
- ClassedSizeSlider - deprecated class since version 5.0. Use the Slider Classed Size component instead. For information on widget deprecation, read about Esri’s move to web components.
- ColorSizeSlider - deprecated class since version 5.0. Use the Slider Color Size component instead. For information on widget deprecation, read about Esri’s move to web components.
- ColorSlider - deprecated class since version 5.0. Use the Slider Color component instead. For information on widget deprecation, read about Esri’s move to web components.
- HeatmapSlider - deprecated class since version 5.0. Use the Slider Heatmap component instead. For information on widget deprecation, read about Esri’s move to web components.
- OpacitySlider - deprecated class since version 5.0. Use the Slider Opacity component instead. For information on widget deprecation, read about Esri’s move to web components.
- SizeSlider - deprecated class since version 5.0. Use the Slider Size component instead. For information on widget deprecation, read about Esri’s move to web components.
- SmartMappingSliderBase - deprecated class since version 5.0. For information on widget deprecation, read about Esri’s move to web components.
- support/
- GeolocationPositioning - deprecated class since version 5.1. Use the Track component or Locate component instead. For information on widget deprecation, read about Esri’s move to web components.
- GridControls - deprecated class since version 4.33. Use the Grid Controls component instead. For information on widget deprecation, read about Esri’s move to web components.
Bug fixes and enhancements
- BUG-000129846: Fixed an issue where specific Unicode characters did not render properly when labeling.
- BUG-000139362: Fixed an issue where certain complex languages did not render properly when labeling.
- BUG-000139656 and BUG-000156126: Added 2D support for
mandzvalues in MapView and map component. See Support for m and z values for more information. - BUG-000151798: Labeling using a field containing certain characters makes the feature(s) and labels disappear.
- BUG-000157856: Fixed an issue where Burmese did not render properly when labeling.
- BUG-000160070: Fixed an issue where TextSymbol] ‘baseline’ multiline text should be placed at the baseline of the last row of text.
- BUG-000164881: Fixed an issue where Khmer (Cambodian) did not render properly when labeling.
- BUG-000172379: Fixed an issue where a
/revokeTokenrequest was sent in response to a 498 invalid token error, which caused the user to have to sign in again to access the map. - BUG-000173133: Fixed an issue where grouped unique value renderer labels were displaying in the Popup, FeatureTable, and FeatureForm instead of the unique values.
- BUG-000173246: Fixed an issue where the aria-pressed attribute was not present on the visibility toggle buttons in the next version of the Layer List component.
- BUG-000175025: Fixed an issue where visual artifacts were appearing at large scales when using a CIMSymbol with a CIMTextSymbol placed along a line in a FeatureLayer.
- BUG-000177209: Fixed a visual misalignment in the locator drop-down of the Search component.
- BUG-000178857: Fixed as issue where Distance Measurement 2D component could not complete on double-click.
- BUG-000182065: Fixed an issue where a
CIMPrimitiveOverrideon therotationvariable of aCIMVectorMarkersymbol layer was applied incorrectly when the markerGraphics included aCIMHatchFillorCIMGradientFill. - BUG-000182065: Fixed an issue where a
CIMPrimitiveOverrideon therotationvariable of aCIMVectorMarkersymbol layer was applied incorrectly when the markerGraphics included aCIMHatchFillorCIMGradientFill. - BUG-000182312: Fixed an issue where saving a sublayer of a SceneLayer rewrote the layer item to a single-layer structure.
- BUG-000183250: Fixed a an issue where MapView.hitTest failed to return hits for features that use rotated text symbols.
- BUG-000183250: Fixed a an issue where MapView.hitTest failed to return hits for features that use rotated text symbols.
- BUG-000183287: Fixed an issue where the measurement components and widgets were not properly displaying the “Decimeters” unit in its plural form.
- BUG-000183287: Fixed an issue where the measurement components and widgets were not properly displaying the “Decimeters” unit in its plural form.
- BUG-000183304: Fixed an issue where the displayed value no longer matches the selected unit when switching between
basemapandddformats with the Coordinate Conversion next component - BUG-000183691: Fixed an issue where ‘Search by Layer’ configured with a numeric field returns irrelevant search results when layer filters are applied.
- BUG-000183702: Fixed an issue where printing using
MAP_ONLY, the show print area did not automatically update when the DPI value was changed. - BUG-000183704: Fixed an issue where it was not possible to erase the first character within the DPI box under the Advanced options of the Print component.
- BUG-000183831: Fixed an issue where the opacity of underground symbols did not adjust properly based on the ground transparency.
- BUG-000184206: Fixed an issue where attachment previews in Popup didn’t show for SceneLayer.
- BUG-000184411: Fixed an issue where map component’s hitTest() incorrectly returned results for hidden style layers within a VectorTileLayer when their visibility was set to
none. - BUG-000184578: Fixed an issue where the Version Management component allowed users to input unlimited text in the branch ‘New Version Description’ field, despite the documented 64‑character limit.
- BUG-000184965: Fixed an issue where the Trace widget was ignoring barriers placed at scale of 1:000 or further.
- BUG-000185331: Fixed an issue where the Trace Analysis component was causing slow pan and zoom operations.
- BUG-000185593: Fixed an issue on iPhones where Gaussian Splat layers could have missing tiles while navigating in scenes.
- Esri Community - 1585060: Fixed an issue where labels can be duplicated across features.
- Esri Community - 1688881: Fixed an issue where image media referencing a URL attribute value was not displaying in the Popup.
- Fixed an issue where CIMTextSymbol was not rendering properly in Safari and Firefox on macOS.
- Fixed an issue where drag-and-drop did not work correctly for KnowledgeGraphLayer tables in the Layer List.
- Fixed an accessibility issue where the Layer List list item action menu was missing the
aria-haspopupattribute. - Fixed an issue where Popup, Features, and Feature components were not honoring supported HTML in the
heading. - Fixed an issue where a private or secure Sublayer failed to print.
- ENH-000135285: Improved support for keyboard navigation in the Map components package.
- ENH-000151461: Reduced the number of significant digits for small-value coordiante numbers with the Coordinate Conversion next component.
- ENH-000173338: Added support for scale based rendering with the new
alternateSymbolsproperty on UniqueValueInfo and ClassBreakInfo. - ENH-000173743: Updated the CustomTemplate documentation to indicate that the ‘Get Layout Template’ info task is essential.
- ENH-000173894: Added support for the search result popup’s
Collapsebutton to have a more descriptive accessible name label to aid navigation for users of assistive technology. - Enhanced the Bookmarks component so the heading stays fixed while scrolling, and the Add bookmark button remains accessible by floating above the list when visible.
- Enhanced the Legend’s ActiveLayerInfo to prevent duplicate legend requests by sharing pending requests across legend instances.
- Enhanced the Legend to support
alternateSymbolsfor UniqueValueRenderer’s UniqueValueInfo and ClassBreaksRenderer’s ClassBreakInfo. - Enhanced the Popup so you no longer need to call
clear()before opening it with a new set of features; the popup now automatically clears previous content when features are updated. - Enhanced the Print component and print() method to support
Datum Transformation. - Enhanced the Print component to support accessibility enabled PDF output.
- When
featuresis set to a polyline graphic and the popup is opened via theopenproperty, the Popup is now anchored to the middle of the polyline feature’s geometry. - Improved performance of Trace Analysis component related to snapping and error handling.
- Improved the
shouldFocuspropertyopenmethod on the Popup widget such that the popup will trap focus within itself when opened, and return focus to the previously focused element when closed.
Charts components fixes and enhancements
- Bar charts, line charts and combo bar line charts can now be configured with time only fields that do not have a date component.
- New property
syncViewTimeZoneon the chart component. When set totrue, the chart’s data will be in sync with the view’stimeZone. This applies to charts that supporting temporal data. - Chart tooltip’s font size can now be customized by using the new model method
setDataTooltipFontSize(). This allows you to adjust the tooltip font size for a specific series to better fit the design of your application or to improve readability. - Added support for automatically inverse data label colors on poor contrasting heat chart cell background to improve readability. This can be enabled by setting
autoInverseDataLabelTextColortotrueon the chart component. - Added support for exporting heat charts as CSV. When the charts action bar is slotted within the chart component, the export action will now include an option to export as CSV in addition to the existing image export option.
- Added screen reader support for chart title, descriptions, legend titles and gauge values.
- Progress bands can now be configured for gauges via the
progressBandsVisibilityandprogressBandsproperties on the GaugeModel.
Patch fixes
5.1.12 (07/09/2026)
Core API:
- Fixed an issue where popups were not working correctly when using the Measurement tools.
Components:
- BUG-000186158: Fixed an issue where labels were not allowing selection of fields when the fields have uppercase display names in ArcGIS Enterprise map services versions < 10.9.1.
5.1.11 (07/08/2026)
Core API:
- BUG-000185988: Fixed an issue in
Editorwhere date fields would automatically send millisecond precision when applying time values. - BUG-000186088: Fixed an issue where Popup content would not display and infinite query requests were sent to the service when using attribute expressions utilizing the
First(Intersect())Arcade function. - Fixed an issue in
Editorforms where an error in one calculated field expression prevented other calculated expressions from running. - Fixed an issue where
Editorfailed to delete a feature if there is a pending attachment edit. - Fixed an issue where
FeatureTablejumped to the first record after refreshing. - Fixed an issue where time resolution settings with seconds were not honored in
Editorforms. - Fixed an issue where, when multiple fields are selected for editing, “Different values” was cleared after tabbing out of the focused element.
Components:
- BUG-000186078: Fixed an issue where
arcgis-popupandarcgis-features-nextcomponents were not displaying related features from non-hosted ArcGIS Enterprise feature services in relationship elements. - Fixed an issue in the
arcgis-layer-list-nextcomponent where visibility changes on sublayers were bubbling up to their parent group layers - Fixed an issue in the
arcgis-utility-network-trace-analysiscomponent where switching utility networks after running a trace could cause the results tab to display incorrect results. The previous trace results are now preserved until a new trace is executed. - Fixed an issue where
arcgis-featureandarcgis-feature-nextcomponents were not displaying Arcade attribute expressions when used without anarcgis-mapcomponent. - Fixed an issue where the maximum statistical value did not respect data filters when authoring a gauge with the
arcgis-chartcomponent.
5.1.10 (07/06/2026)
Core API:
- BUG-000185886: Fixed an issue where zooming in and out on some polylines did not render labels properly.
- BUG-000185914: Fixed an issue in
Editorwhere attachments were not available and editable for features from older feature service versions. (Reported for ArcGIS Enterprise 10.9.1 and 10.8.1 feature services). - BUG-000185955: Fixed an issue where
Formsincorrectly nulled field values when the “Preserve field values when hidden” option was disabled. - Fixed an issue where
Sketchwould not emit the arcgisDuplicate event
Components:
- Fixed an issue in the Arcade Editor showing outdated SDK documentation.
- Various fixes to support ArcGIS Online.
5.1.9 (07/02/2026)
Core API:
- BUG-000185874: Fixed an issue where
Editorfailed to submit edits after snapping features for layers that do not support z values with the error: “Edits could not be saved: Layer does not support z values while feature has z values.” - BUG-000185905: Fixed an issue where
Editordid not honor attachment size when maximizing attachment images.
Components:
- BUG-000185908: When displaying image attachments in
previewdisplay mode usingarcgis-popupandarcgis-features-next, attachment file names no longer display. - BUG-000185927: Fixed an issue where the
arcgis-popupandarcgis-features-nextcomponents were not displaying field or media elements that didn’t includefieldInfosormediaInfoswhen returned fromExpressionContent. - Fixed an issue in the
Editorwhere maximized attachments were not displayed with the correct proportions. - Fixed an issue where
arcgis-popupandarcgis-features-nextcomponents no longer defaulted date/time field formatting toshort-date-short-timewhen noformatwas set for Map Image Layer sublayers. - Fixed an issue where some polyline features could not be added as trace locations in the
arcgis-utility-network-trace-analysisdue to an error in the percent-along calculation. - Fixed an issue where the
arcgis-popupandarcgis-features-nextcomponents were displaying the raw codes for coded value domains instead of the coded values for Map Image Layer sublayers.
5.1.8 (07/01/2026)
Core API:
- BUG-000185913: Fixed an issue preventing
VectorTileLayertiles from rendering when the service references an invalid font name. - Fixed an issue in
Editorwhere replacing attachments then resetting the name would also reset the file name extension.
Components:
- Various fixes to support ArcGIS Online.
5.1.7 (06/30/2026)
Core API:
- BUG-000185811: Fixed an issue where
Editorallowed creating multiple related records for features with a 1-to-1 relationship cardinality in Owner/Admin workflow. - BUG-000185851: Fixed an issue where queries timed out on hosted feature services when query requests included geometry filter, pagination, and
resultType:standard. - BUG-000185883: Fixed an issue where some polyline labels can become duplicated.
- BUG-000185915: Fixed an issue in
Editorwhere field inputs would lose focus when entering a value for inputs with calculated expressions. - Fixed an issue where
Editorwould send feature updates inapplyEdits()when only attachments were added, updated, or deleted in the features. - Fixed an issue in
Editorwhere radio buttons were not setting the input values when multiple forms were available on the map referencing the same feature.
Components:
- Various fixes to support ArcGIS Online.
5.1.6 (06/27/2026)
Core API:
- BUG-000185815 & BUG-000185829: Fixed an issue where
Editorprevented submitting edits for invalid forms with the error: “form failed to run calculations”. - BUG-000185834: Fixed an issue where
Editorsubmittednullvalues for date fields when creating features with a calculated expression. - BUG-000185835: Fixed an issue where
Editorwould throw an error “Missing value for required property “inputTypes” when selecting a feature with attachments enabled and noAttachmentElementconfigured.
Components:
- Various fixes to support ArcGIS Online.
5.1.5 (06/26/2026)
Core API:
- Fixed an issue where
Sketchreturned “point” for the activeTool when creating “text” features inarcgis-scene. - Fixed an issue in
Editorwhere the “Create” button would continuously enable and disable while drawing geometries in a batch create workflow. - Fixed an issue where the latest editMoment was being set to null when querying associations in forms or popups while in an edit session.
- Fixed issues where ParquetLayers were failing to render after panning and could freeze when enabling labels.
Components:
- Fixed an overlapping symbol issue in the side-by-side card style legend.
- Fixed an issue where the latest editMoment was being set to null when querying associations in popups while in an edit session.
- Various other fixes to support ArcGIS Online.
5.1.4 (06/25/2026)
Core API:
- Fixed an issue in the client-side
FeatureLayerwhereYYYY/MM/DDstrings were not being parsed as date values, resulting in null for a date field. - Fixed an issue in
Editorwhere disabled group inputs were not expandable or collapsible. - Fixed an issue in
Editorto allow replacing attachments with different file types if there were no file type limitations configured. - Fixed an issue in
Editorwhen replacing an attachment and downloading the new attachment would result in the replaced attachment being downloaded.
Components:
- Fixed a layout issue with the
arcgis-histogramcomponent when set to a custom height. - Various fixes to support ArcGIS Online.
5.1.3 (06/23/2026)
Core API:
- Fixed a bug in Sketch and Editor where segment labels were not visible when toggling them off and then back on.
Components:
- Various fixes to support ArcGIS Online.
5.1.2 (06/23/2026)
Core API:
- Fixed an issue with
Editor, where theAttachmentElementstill allowed you to edit attachments despite the editability expression on the element evaluating tofalse. - Fixed an issue with
Editor, where attachments were not visible because theattachmentAssociationTypewas not being read correctly.
Components:
- Various fixes to support ArcGIS Online.
5.1.1 (06/22/2026)
Core API:
- Fixed minor issues with Google basemaps.
- Fixed issues with 3D emissive materials and transparency gradient not being displayed correctly in certain scenarios.
Components:
- Various fixes to support ArcGIS Online.
Additional packages
Version 5.1 of the ArcGIS Maps SDK for JavaScript uses ArcGIS Arcade 1.36 (since 5.1).
Version 5.1 of the ArcGIS Maps SDK for JavaScript uses Calcite Design System, version 5.1.1. In your application, we recommend using the same version or any minor version greater than ^5.1.1.
How to access the SDK
- The API library is available on both CDN and npm, read more at Get started.
- For supported versions, you can also download both the documentation and the API library. These downloads are typically available 3-4 weeks after release.