Weather stations styled with a simple render and visual variables to show air temperature
What are visual variables?
Visual variables
There are four visual variables that can be overridden with data values.
- Color
- Size
- Opacity
- Rotation
How visual variables work
All visual variables are added to a renderer’s visualVariables property. A renderer can contain more than one visual variable, but adding more than one at a time may cause confusion.
Multivariate visualizations
Learn how to style layers with a simple renderer using 2D and 3D symbols.
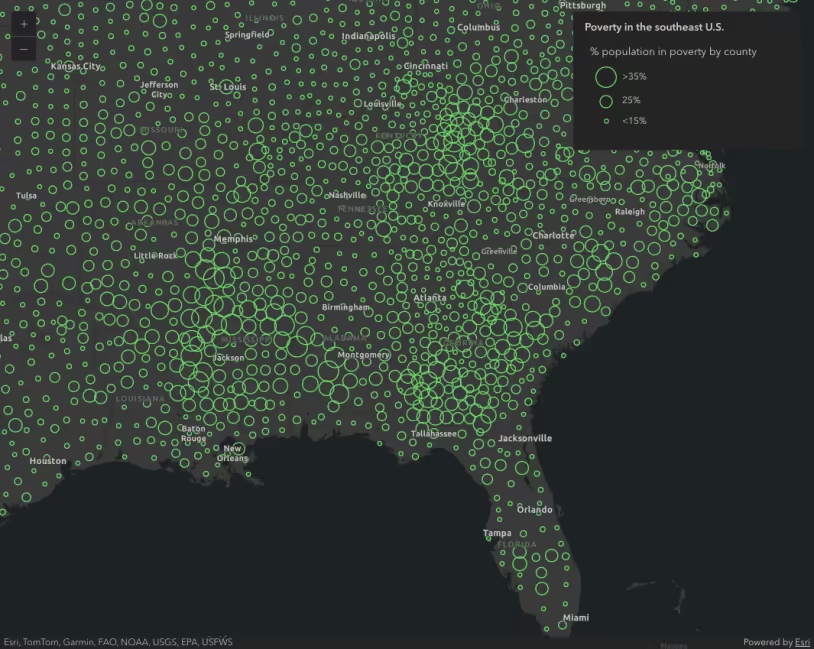
Color
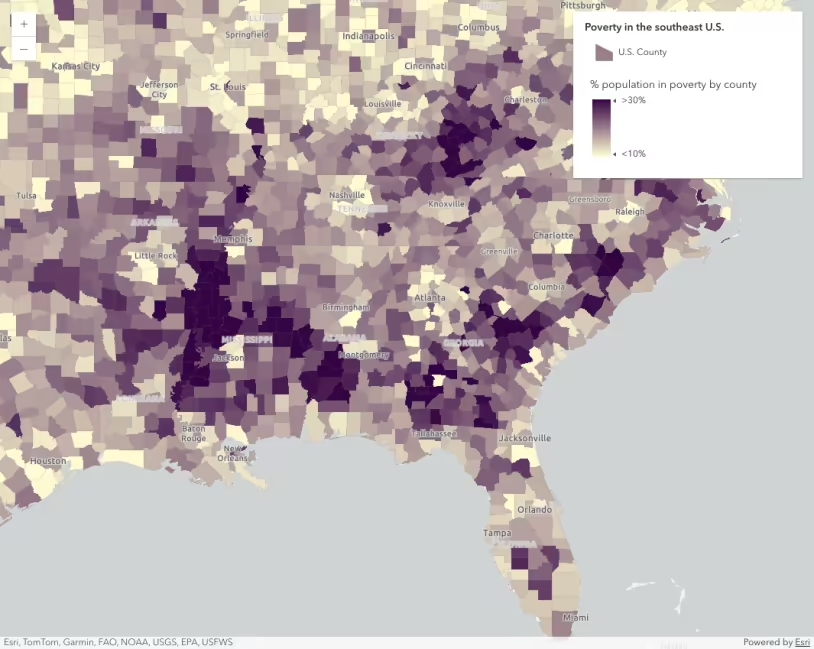
A color variable
Color visual variables require the following:
- A reference to a data value either from a field name, or an Arcade expression.
- At least two color stops that match data values to colors. The colors of symbols with data values between the designated stops are linearly interpolated.
The following example renders the current temperature reported by weather stations along a continuous color ramp.
44 collapsed lines
<!doctype html><html> <head> <meta charset="utf-8" /> <meta name="viewport" content="width=device-width, initial-scale=1, shrink-to-fit=no" /> <title>Esri Developer Guide: Visual variables (color)</title> <style> html, body, #viewDiv { height: 100%; margin: 0; } </style>
<link rel="stylesheet" href="https://js.arcgis.com/5.1/esri/themes/light/main.css" /> <!-- Load the ArcGIS Maps SDK for JavaScript from CDN --> <script type="module" src="https://js.arcgis.com/5.1/"></script>
<script type="module"> const [Map, MapView, FeatureLayer, Legend, Expand] = await $arcgis.import([ "@arcgis/core/Map.js", "@arcgis/core/views/MapView.js", "@arcgis/core/layers/FeatureLayer.js", "@arcgis/core/widgets/Legend.js", "@arcgis/core/widgets/Expand.js", ]);
const referenceScale = 9244650 * 4;
const renderer = { type: "simple", symbol: { type: "simple-marker", style: "circle", color: [250, 250, 250], outline: { color: [255, 255, 255, 0.5], width: 0.5, }, size: "8px", },
visualVariables: [ { type: "color", field: "TEMP", stops: [ { value: 20, color: "#2b83ba" }, { value: 35, color: "#abdda4" }, { value: 50, color: "#ffffbf" }, { value: 65, color: "#fdae61" }, { value: 80, color: "#d7191c" }, ], }, ],48 collapsed lines
};
// Set the renderer on the feature layer const layer = new FeatureLayer({ portalItem: { id: "cb1886ff0a9d4156ba4d2fadd7e8a139", }, title: "Current weather conditions", renderer: renderer, });
const map = new Map({ basemap: { portalItem: { id: "ba223f982a3c4a0ea8c9953346e2a201", }, }, layers: [layer], });
const view = new MapView({ container: "viewDiv", map: map, scale: referenceScale, center: [-95, 38.5], constraints: { snapToZoom: false, }, });
view.ui.add( new Expand({ content: new Legend({ view: view, }), view: view, expanded: false, }), "top-right", ); </script> </head> <body> <div id="viewDiv"></div> </body></html>Size
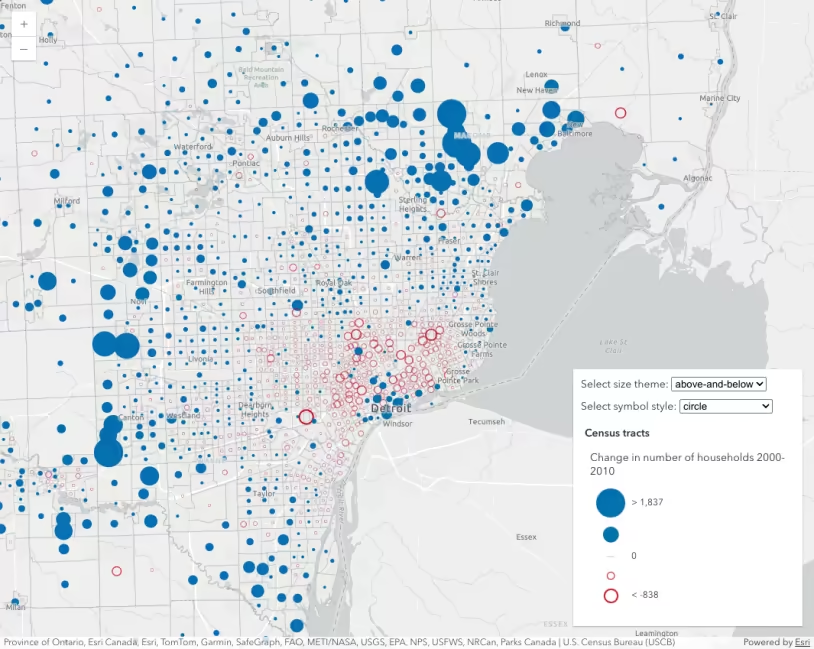
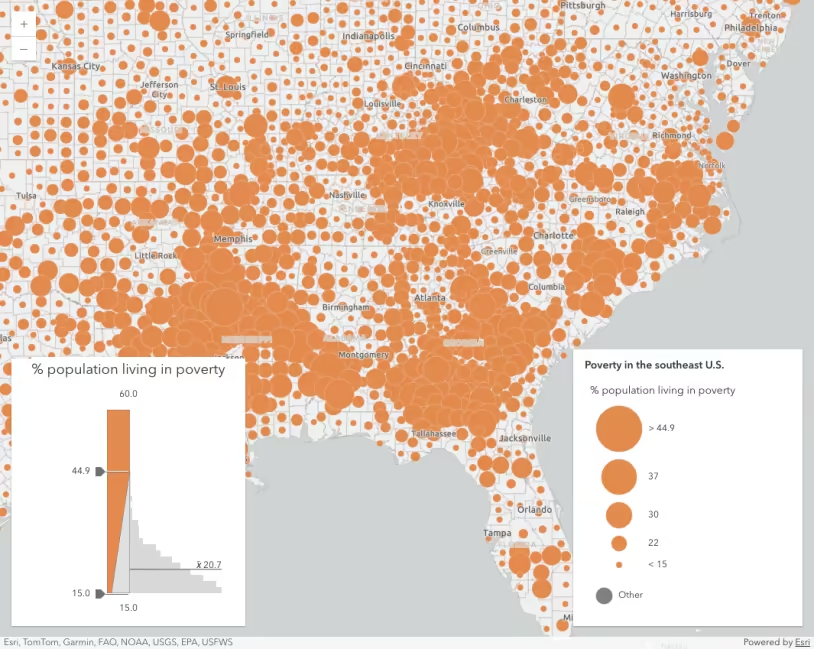
A size variable
The size visual variable can be defined in two different ways:
- With size stops, or
- Matching a
maxDataValuewith amaxSize, and aminDataValuewith aminSize.
Size visual variables require the following:
- A reference to a data value either from a field name, or an Arcade expression.
- At least two size stops that match data values to sizes. The sizes of symbols with data values between the designated stops are linearly interpolated.
The following example renders the current wind speed reported by weather stations along a continuous size ramp.
44 collapsed lines
<!doctype html><html> <head> <meta charset="utf-8" /> <meta name="viewport" content="width=device-width, initial-scale=1, shrink-to-fit=no" /> <title>Size visual variable</title> <style> html, body, #viewDiv { height: 100%; margin: 0; } </style>
<link rel="stylesheet" href="https://js.arcgis.com/5.1/esri/themes/light/main.css" /> <!-- Load the ArcGIS Maps SDK for JavaScript from CDN --> <script type="module" src="https://js.arcgis.com/5.1/"></script>
<script type="module"> const [Map, MapView, FeatureLayer, Legend, Expand] = await $arcgis.import([ "@arcgis/core/Map.js", "@arcgis/core/views/MapView.js", "@arcgis/core/layers/FeatureLayer.js", "@arcgis/core/widgets/Legend.js", "@arcgis/core/widgets/Expand.js", ]);
const referenceScale = 9244650 * 2;
const renderer = { type: "simple", symbol: { type: "simple-marker", style: "circle", color: [50, 50, 50, 0.4], outline: { color: [255, 255, 255, 0.3], width: 0.2, }, size: "8px", },
visualVariables: [ { type: "size", field: "WIND_SPEED", minDataValue: 5, maxDataValue: 60, minSize: 4, maxSize: 22, }, ],48 collapsed lines
};
// Set the renderer on the feature layer const layer = new FeatureLayer({ portalItem: { id: "cb1886ff0a9d4156ba4d2fadd7e8a139", }, title: "Current weather conditions", renderer: renderer, });
const map = new Map({ basemap: { portalItem: { id: "ba223f982a3c4a0ea8c9953346e2a201", }, }, layers: [layer], });
const view = new MapView({ container: "viewDiv", map: map, scale: referenceScale, center: [-95, 38.5], constraints: { snapToZoom: false, }, });
view.ui.add( new Expand({ content: new Legend({ view: view, }), view: view, expanded: false, }), "top-right", ); </script> </head> <body> <div id="viewDiv"></div> </body></html>Rotation
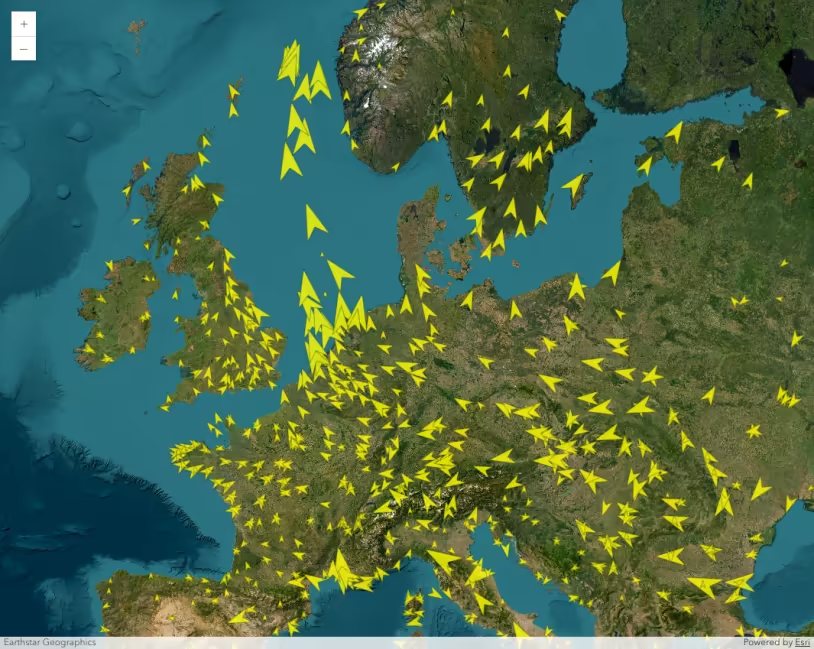
A rotation variable
- wind direction
- traffic flow
- aspect
Rotation visual variables are different from other visual variables in that they only require a data value without the need for stops.
- A reference to a data value either from a field name, or an Arcade expression.
- An optional rotation type indicating a geometry or arithmetic rotation.
The following example visualizes weather stations with arrow markers and rotates them based on wind direction.
Pan and zoom the map to explore weather stations and their rotation based on wind direction.
46 collapsed lines
<!doctype html><html> <head> <meta charset="utf-8" /> <meta name="viewport" content="width=device-width, initial-scale=1, shrink-to-fit=no" /> <title>Rotation visual variable</title> <style> html, body, #viewDiv { height: 100%; margin: 0; } </style>
<link rel="stylesheet" href="https://js.arcgis.com/5.1/esri/themes/light/main.css" /> <!-- Load the ArcGIS Maps SDK for JavaScript from CDN --> <script type="module" src="https://js.arcgis.com/5.1/"></script>
<script type="module"> const [Map, MapView, FeatureLayer, Legend, Expand] = await $arcgis.import([ "@arcgis/core/Map.js", "@arcgis/core/views/MapView.js", "@arcgis/core/layers/FeatureLayer.js", "@arcgis/core/widgets/Legend.js", "@arcgis/core/widgets/Expand.js", ]);
const referenceScale = 9244650 * 2;
const renderer = { type: "simple", symbol: { type: "simple-marker", // Arrow marker defined as SVG path path: "M14.5,29 23.5,0 14.5,9 5.5,0z", color: [50, 50, 50], outline: { color: [255, 255, 255, 0.5], width: 0.5, }, angle: 180, size: "20px", },
visualVariables: [ { type: "rotation", field: "WIND_DIRECT", rotationType: "geographic", }, ],48 collapsed lines
};
// Set the renderer on the feature layer const layer = new FeatureLayer({ portalItem: { id: "cb1886ff0a9d4156ba4d2fadd7e8a139", }, title: "Current weather conditions", renderer: renderer, });
const map = new Map({ basemap: { portalItem: { id: "ba223f982a3c4a0ea8c9953346e2a201", }, }, layers: [layer], });
const view = new MapView({ container: "viewDiv", map: map, scale: referenceScale, center: [-95, 38.5], constraints: { snapToZoom: false, }, });
view.ui.add( new Expand({ content: new Legend({ view: view, }), view: view, expanded: false, }), "top-right", ); </script> </head> <body> <div id="viewDiv"></div> </body></html>Opacity
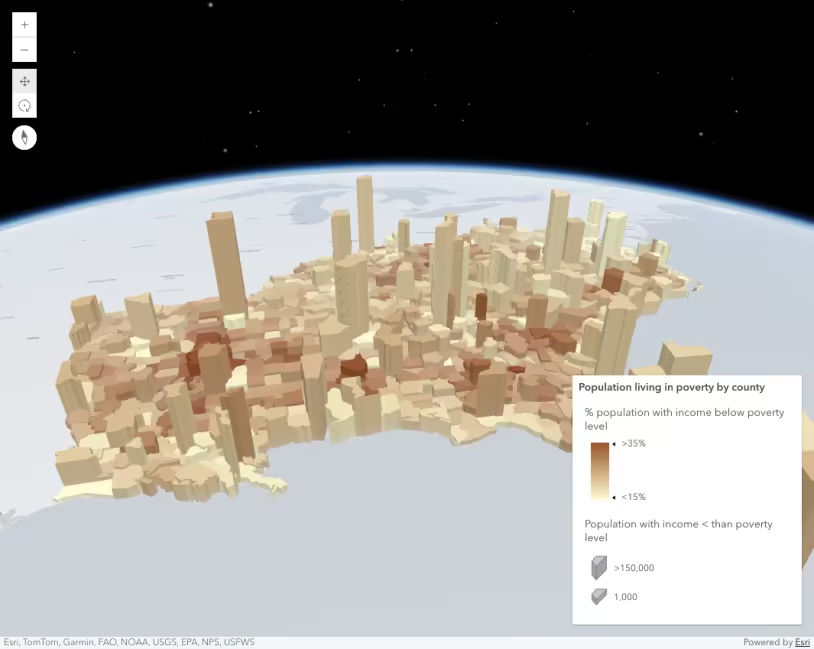
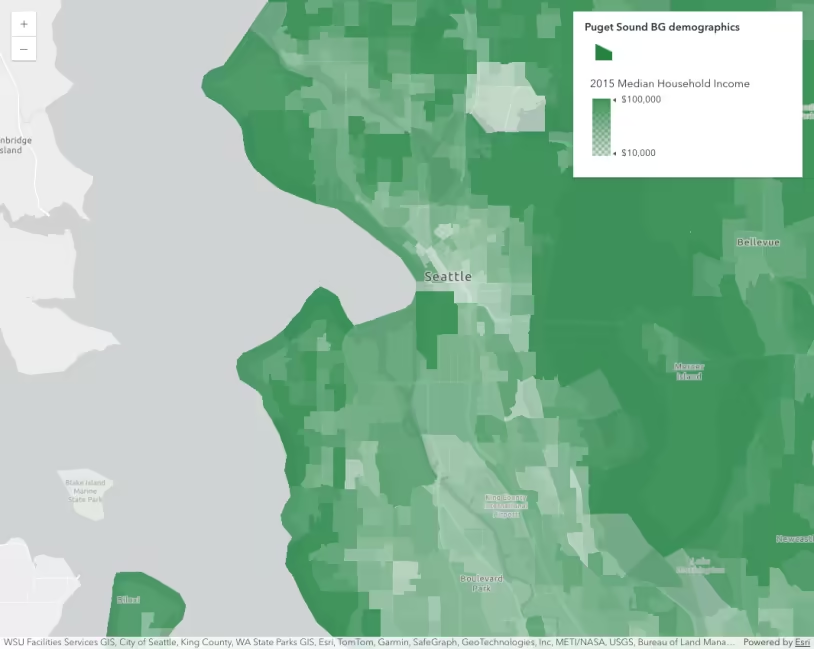
An opacity variable
Opacity visual variables require the following:
- A reference to a data value either from a field name or an Arcade expression.
- At least two opacity stops that match data values to opacity values between
0and1. The opacity of symbols with data values between the designated stops are linearly interpolated.
The following example visualizes the predominant crop for each U.S. county. The renderer has an opacity variable to emphasize counties with a lot of cropland and subdue counties that have very little cropland by comparison.
Pan and zoom the map to explore the predominant crop for each US county.
69 collapsed lines
<!doctype html><html> <head> <meta charset="utf-8" /> <meta name="viewport" content="width=device-width, initial-scale=1, shrink-to-fit=no" /> <title>Esri Developer Guide: Visual variables (opacity)</title> <style> html, body, #viewDiv { height: 100%; margin: 0; } </style>
<link rel="stylesheet" href="https://js.arcgis.com/5.1/esri/themes/dark/main.css" /> <!-- Load the ArcGIS Maps SDK for JavaScript from CDN --> <script type="module" src="https://js.arcgis.com/5.1/"></script>
<script type="module"> const [Map, MapView, FeatureLayer, Legend, Expand] = await $arcgis.import([ "@arcgis/core/Map.js", "@arcgis/core/views/MapView.js", "@arcgis/core/layers/FeatureLayer.js", "@arcgis/core/widgets/Legend.js", "@arcgis/core/widgets/Expand.js", ]);
const referenceScale = 9244650 * 2;
function createSymbol(color) { return { type: "simple-fill", outline: { color: "rgba(50,50,50,0.1)", width: 0.5, }, color, style: "solid", }; }
const renderer = { type: "unique-value", field: "DOM_CROP_ACRES", uniqueValueInfos: [ { value: "Corn", symbol: createSymbol("#e6d800"), }, { value: "Wheat", symbol: createSymbol("#9b19f5"), }, { value: "Soybeans", symbol: createSymbol("#0bb4ff"), }, { value: "Cotton", symbol: createSymbol("#50e991"), }, { value: "Vegetables", symbol: createSymbol("#e60049"), }, ],
visualVariables: [ { type: "opacity", field: "TotalFarmedAcres", normalizationField: "AREA_ACRES", legendOptions: { showLegend: false, }, stops: [ { value: 0.0, opacity: 0.2 }, { value: 0.1, opacity: 0.5 }, { value: 0.5, opacity: 0.8 }, { value: 0.9, opacity: 1.0 }, ], }, ],43 collapsed lines
};
// Set the renderer on the feature layer const layer = new FeatureLayer({ url: "https://services.arcgis.com/V6ZHFr6zdgNZuVG0/arcgis/rest/services/US_county_crops_2007_clean/FeatureServer/0", title: "U.S. counties", renderer: renderer, });
const map = new Map({ basemap: "dark-gray-vector", layers: [layer], });
const view = new MapView({ container: "viewDiv", map: map, scale: referenceScale, center: [-95, 38.5], constraints: { snapToZoom: false, }, });
view.ui.add( new Expand({ content: new Legend({ view: view, }), view: view, expanded: false, }), "top-right", ); </script> </head>
<body> <div id="viewDiv"></div> </body></html>Related samples and resources
Data-driven continuous color
Size visual variable themes
Data-driven extrusion
Visualize data with rotation
Data-driven continuous size
Data-driven opacity
Generate data-driven continuous size visualization
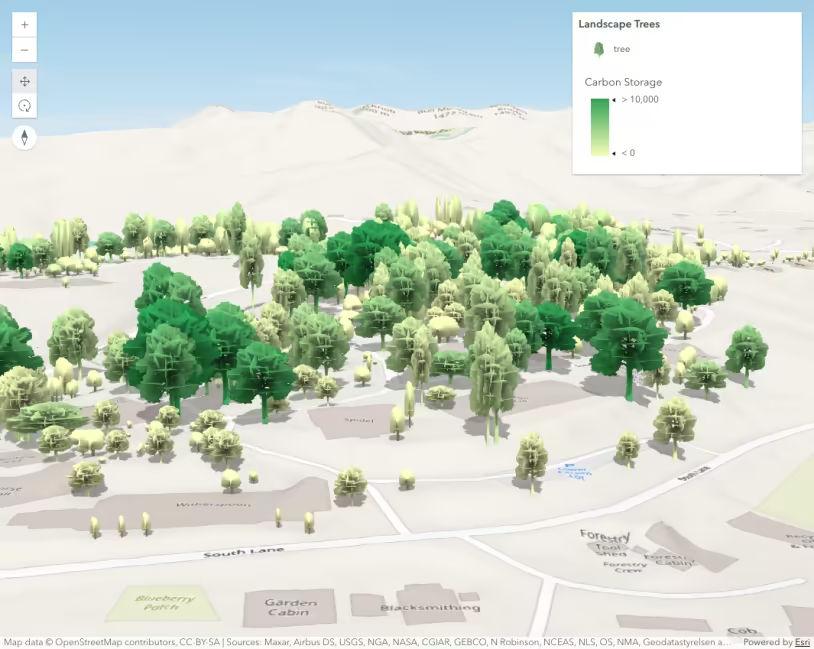
Thematic visualization with realistic 3D symbols
API support
| 2D | 3D | Arcade | Points | Lines | Polygons | Mesh | |
|---|---|---|---|---|---|---|---|
| | | | | | | | |
| | | | | | | | |
| | | | | | | ||
| | | | | | | | |
| | | | | | | | |
| | | | | | | | |
| | | | | | | | |
| | | | | | | | |
| | | | | | | | |
| | | |
- Color only
- Size variable creators only supported for points
- Size variable creators not supported in 3D