Create graphics for utility associations in a utility network.
Use case
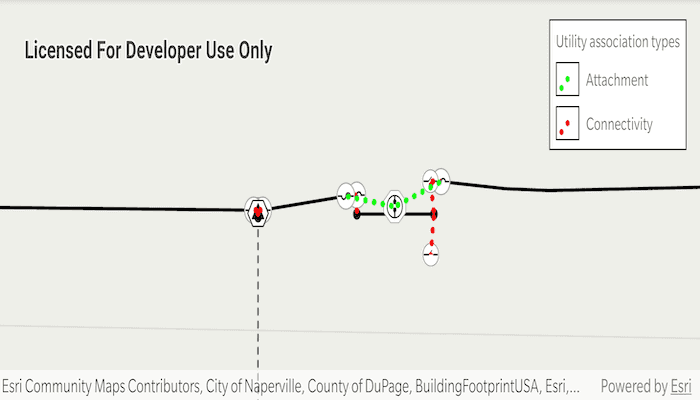
Visualizing utility associations can help you to better understand trace results and the topology of your utility network. For example, connectivity associations allow you to model connectivity between two junctions that don't have geometric coincidence (are not in the same location); structural attachment associations allow you to model equipment that may be attached to structures; and containment associations allow you to model features contained within other features.
How to use the sample
Pan and zoom around the map. Observe graphics that show utility associations between junctions.
How it works
- Create an
UtilityNetworkwith a feature service URL, add it to the map'sutilityNetworkslist and load it. - Add a
FeatureLayerto the map for everyUtilityNetworkSourceof typeEDGEorJUNCTION. - Create a
GraphicsOverlayfor the utility associations. - Add a
NavigationChangedListenerto listen forNavigationChangedEvents. - When the sample starts and every time the viewpoint changes:
- Get the geometry of the map view's extent.
- Get the associations that are within the current extent using
getAssociationsAsync(extent). - Get the
UtilityAssociationTypefor each association. - Create a
Graphicusing theGeometryproperty of the association and a preferred symbol. - Add the graphic to the graphics overlay.
Relevant API
- GraphicsOverlay
- ServiceGeodatabase
- UtilityAssociation
- UtilityAssociationType
- UtilityNetwork
About the data
The Naperville electrical feature service in this sample represents an electric network in Naperville, Illinois, which contains a utility network used to run the subnetwork-based trace.
Using utility network on ArcGIS Enterprise 10.8 requires an ArcGIS Enterprise member account licensed with the Utility Network user type extension. Please refer to the utility network services documentation.
Tags
associating, association, attachment, connectivity, containment, relationships
Sample Code
/*
* Copyright 2020 Esri
*
* Licensed under the Apache License, Version 2.0 (the "License");
* you may not use this file except in compliance with the License.
* You may obtain a copy of the License at
*
* http://www.apache.org/licenses/LICENSE-2.0
*
* Unless required by applicable law or agreed to in writing, software
* distributed under the License is distributed on an "AS IS" BASIS,
* WITHOUT WARRANTIES OR CONDITIONS OF ANY KIND, either express or implied.
* See the License for the specific language governing permissions and
* limitations under the License.
*/
package com.esri.arcgisruntime.sample.displayutilityassociations
import android.graphics.Color
import android.os.Bundle
import androidx.appcompat.app.AppCompatActivity
import androidx.appcompat.widget.AppCompatImageView
import com.esri.arcgisruntime.ArcGISRuntimeEnvironment
import com.esri.arcgisruntime.layers.FeatureLayer
import com.esri.arcgisruntime.mapping.ArcGISMap
import com.esri.arcgisruntime.mapping.BasemapStyle
import com.esri.arcgisruntime.mapping.Viewpoint
import com.esri.arcgisruntime.mapping.view.Graphic
import com.esri.arcgisruntime.mapping.view.GraphicsOverlay
import com.esri.arcgisruntime.mapping.view.MapView
import com.esri.arcgisruntime.security.UserCredential
import com.esri.arcgisruntime.symbology.SimpleLineSymbol
import com.esri.arcgisruntime.utilitynetworks.UtilityAssociationType
import com.esri.arcgisruntime.utilitynetworks.UtilityNetwork
import com.esri.arcgisruntime.utilitynetworks.UtilityNetworkSource
import com.esri.arcgisruntime.sample.displayutilityassociations.databinding.ActivityMainBinding
import java.util.UUID
class MainActivity : AppCompatActivity() {
// max scale at which to create graphics for the associations
private val maxScale = 2000
// create the utility network
private val utilityNetwork =
UtilityNetwork("https://sampleserver7.arcgisonline.com/server/rest/services/UtilityNetwork/NapervilleElectric/FeatureServer").apply {
// set user credentials to authenticate with the service
// NOTE: a licensed user is required to perform utility network operations
credential = UserCredential("viewer01", "I68VGU^nMurF")
}
// overlay to hold graphics for all of the associations
private val associationsOverlay by lazy { GraphicsOverlay() }
// create a green dotted line symbol for attachment
private val attachmentSymbol by lazy {
SimpleLineSymbol(
SimpleLineSymbol.Style.DOT,
Color.GREEN,
5.0f
)
}
// create a red dotted line symbol for connectivity
private val connectivitySymbol by lazy {
SimpleLineSymbol(
SimpleLineSymbol.Style.DOT,
Color.RED,
5.0f
)
}
private val activityMainBinding by lazy {
ActivityMainBinding.inflate(layoutInflater)
}
private val mapView: MapView by lazy {
activityMainBinding.mapView
}
private val attachmentSwatch: AppCompatImageView by lazy {
activityMainBinding.subLayout.attachmentSwatch
}
private val connectivitySwatch: AppCompatImageView by lazy {
activityMainBinding.subLayout.connectivitySwatch
}
override fun onCreate(savedInstanceState: Bundle?) {
super.onCreate(savedInstanceState)
setContentView(activityMainBinding.root)
// authentication with an API key or named user is required to access basemaps and other
// location services
ArcGISRuntimeEnvironment.setApiKey(BuildConfig.API_KEY)
// create a new map and add the utility network to it
val utilityNetworkMap = ArcGISMap(BasemapStyle.ARCGIS_TOPOGRAPHIC).apply {
utilityNetworks.add(utilityNetwork)
}
mapView.apply {
// add a topographic basemap with a viewpoint at several utility network associations
map = utilityNetworkMap
setViewpoint(Viewpoint(41.8057655, -88.1489692, 50.0))
// add the a graphics overlay to hold association graphics
graphicsOverlays.add(associationsOverlay)
}
// load the utility network
utilityNetwork.loadAsync()
utilityNetwork.addDoneLoadingListener {
// get all of the edges and junctions in the network
val edges =
utilityNetwork.definition.networkSources.filter { it.sourceType == UtilityNetworkSource.Type.EDGE }
val junctions =
utilityNetwork.definition.networkSources.filter { it.sourceType == UtilityNetworkSource.Type.JUNCTION }
// add all edges that are not subnet lines to the map
edges.filter { it.sourceUsageType != UtilityNetworkSource.UsageType.SUBNET_LINE }
.forEach { source ->
mapView.map.operationalLayers.add(FeatureLayer(source.featureTable))
}
// add all junctions to the map
junctions.forEach { source ->
mapView.map.operationalLayers.add(FeatureLayer(source?.featureTable))
}
// populate the legend in the UI
val attachmentSwatchFuture = attachmentSymbol.createSwatchAsync(this, Color.TRANSPARENT)
attachmentSwatch.setImageBitmap(attachmentSwatchFuture.get())
val connectSwatchFuture = connectivitySymbol.createSwatchAsync(this, Color.TRANSPARENT)
connectivitySwatch.setImageBitmap(connectSwatchFuture.get())
// add association graphics at the initial view point
addAssociationGraphicsAsync()
// listen for navigation changes
mapView.addNavigationChangedListener {
// add association graphics for viewpoint after navigation change
addAssociationGraphicsAsync()
}
}
}
/**
* Add association graphics for the map view's current extent.
*/
private fun addAssociationGraphicsAsync() {
// if the current viewpoint is outside of max scale, return and don't add association graphics
if (mapView.getCurrentViewpoint(Viewpoint.Type.CENTER_AND_SCALE).targetScale >= maxScale) {
return
}
// check if the current viewpoint has an extent
(mapView.getCurrentViewpoint(Viewpoint.Type.BOUNDING_GEOMETRY).targetGeometry.extent)?.let { extent ->
// get all of the associations in extent
val associationsFuture = utilityNetwork.getAssociationsAsync(extent)
associationsFuture.addDoneListener {
val associations = associationsFuture.get()
associations.forEach { association ->
// if the graphics overlay doesn't already contain the association
if (!associationsOverlay.graphics.any {
UUID.fromString(it.attributes["GlobalId"]?.toString()) == association.globalId
}) {
// add a graphic for the association
val symbol = when (association.associationType) {
UtilityAssociationType.ATTACHMENT -> attachmentSymbol
UtilityAssociationType.CONNECTIVITY -> connectivitySymbol
else -> null
}
val graphic = Graphic(association.geometry, symbol).apply {
attributes["GlobalId"] = association.globalId
}
associationsOverlay.graphics.add(graphic)
}
}
}
}
}
override fun onResume() {
super.onResume()
mapView.resume()
}
override fun onPause() {
mapView.pause()
super.onPause()
}
override fun onDestroy() {
mapView.dispose()
super.onDestroy()
}
}