Apply a renderer to a sublayer.
Use case
A layer showing animal populations contains sublayers for different species. A renderer could be applied which gives each sublayer a different color, so that populations of each species can be compared visually.
How to use the sample
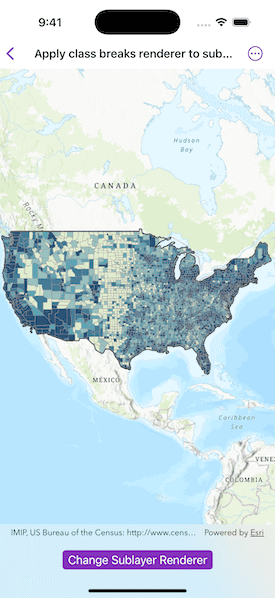
Wait for the map image layer to load. Tap the 'Change Sublayer Renderer' button to apply a unique value renderer to see different population ranges in the counties sub-layer data.
How it works
- Create an
ArcGISMapImageLayerfrom its URL. - After it is done loading, get its map image sublayers.
- Get the
MapImageSublayeryou want. - Create a
ClassBreaksRendererwith a collection ofClassBreaks for different population ranges. - Set class breaks renderer as the renderer of the sublayer.
Relevant API
- ArcGISMapImageLayer
- ArcGISMapImageSubLayer
- ClassBreak
- ClassBreaksRenderer
About the data
This application displays census data from an ArcGIS Server map service. It contains various population statistics, including total population for each county in 2007.
Additional information
The service hosting the layer must support dynamic layers to be able to change the rendering of sublayers.
Tags
class breaks, dynamic layer, dynamic rendering, renderer, sublayer, symbology, visualization
Sample Code
// Copyright 2025 Esri
//
// Licensed under the Apache License, Version 2.0 (the "License");
// you may not use this file except in compliance with the License.
// You may obtain a copy of the License at
//
// https://www.apache.org/licenses/LICENSE-2.0
//
// Unless required by applicable law or agreed to in writing, software
// distributed under the License is distributed on an "AS IS" BASIS,
// WITHOUT WARRANTIES OR CONDITIONS OF ANY KIND, either express or implied.
// See the License for the specific language governing permissions and
// limitations under the License.
import ArcGIS
import SwiftUI
struct ApplyClassBreaksRendererToSublayerView: View {
/// The map image layer.
@State private var mapImageLayer = ArcGISMapImageLayer(url: URL(string: "https://sampleserver6.arcgisonline.com/arcgis/rest/services/Census/MapServer")!)
/// The counties sublayer.
@State private var countiesSublayer: ArcGISMapImageSublayer?
/// The original renderer used to symbolize the sublayer.
@State private var originalRenderer: Renderer?
/// A Boolean value indicating that the class breaks renderer is applied.
@State private var classBreaksRendererIsApplied = false
/// The map with a topographic basemap style.
@State private var map: Map = {
let map = Map(basemapStyle: .arcGISTopographic)
// Sets the initial viewpoint.
map.initialViewpoint = Viewpoint(
boundingGeometry: Envelope(
xMin: -13934661.666904,
yMin: 331181.323482,
xMax: -7355704.998713,
yMax: 9118038.075882,
spatialReference: .webMercator
)
)
return map
}()
/// The error shown in the error alert.
@State private var error: (any Error)?
var body: some View {
MapView(map: map)
.task {
// Adds the map image layer to the map.
map.addOperationalLayer(mapImageLayer)
do {
// Loads the map image layer.
try await mapImageLayer.load()
// Gets the sublayers.
let mapImageSublayers = mapImageLayer.mapImageSublayers
// Gets the third sublayer.
let sublayer = mapImageSublayers[2]
// Loads the sublayer.
try await sublayer.load()
countiesSublayer = sublayer
originalRenderer = sublayer.renderer
} catch {
self.error = error
}
}
.toolbar {
ToolbarItem(placement: .bottomBar) {
Toggle("Change Sublayer Renderer", isOn: $classBreaksRendererIsApplied)
.disabled(countiesSublayer == nil)
}
}
.onChange(of: classBreaksRendererIsApplied) {
countiesSublayer?.renderer = if classBreaksRendererIsApplied {
// Applies the class breaks renderer.
.populationRenderer
} else {
// Applies the original renderer.
originalRenderer
}
}
.errorAlert(presentingError: $error)
}
}
private extension Renderer {
/// Creates a class breaks renderer for counties in the US based on their
/// population in 2007.
static var populationRenderer: ClassBreaksRenderer {
// Outline symbol.
let lineSymbol = SimpleLineSymbol(style: .solid, color: UIColor(white: 0.6, alpha: 1), width: 0.5)
// Symbol for each class break.
let symbol1 = SimpleFillSymbol(style: .solid, color: UIColor(red: 0.89, green: 0.92, blue: 0.81, alpha: 1), outline: lineSymbol)
let symbol2 = SimpleFillSymbol(style: .solid, color: UIColor(red: 0.59, green: 0.76, blue: 0.75, alpha: 1), outline: lineSymbol)
let symbol3 = SimpleFillSymbol(style: .solid, color: UIColor(red: 0.38, green: 0.65, blue: 0.71, alpha: 1), outline: lineSymbol)
let symbol4 = SimpleFillSymbol(style: .solid, color: UIColor(red: 0.27, green: 0.49, blue: 0.59, alpha: 1), outline: lineSymbol)
let symbol5 = SimpleFillSymbol(style: .solid, color: UIColor(red: 0.16, green: 0.33, blue: 0.47, alpha: 1), outline: lineSymbol)
// Class breaks.
let classBreak1 = ClassBreak(description: "-99 to 8,560", label: "-99 to 8,560", minValue: -99, maxValue: 8_560, symbol: symbol1)
let classBreak2 = ClassBreak(description: "> 8,560 to 18,109", label: "> 8,560 to 18,109", minValue: 8_561, maxValue: 18_109, symbol: symbol2)
let classBreak3 = ClassBreak(description: "> 18,109 to 35,501", label: "> 18,109 to 35,501", minValue: 18_110, maxValue: 35_501, symbol: symbol3)
let classBreak4 = ClassBreak(description: "> 35,501 to 86,100", label: "> 35,501 to 86,100", minValue: 35_502, maxValue: 86_100, symbol: symbol4)
let classBreak5 = ClassBreak(description: "> 86,100 to 10,110,975", label: "> 86,100 to 10,110,975", minValue: 86_101, maxValue: 10_110_975, symbol: symbol5)
return ClassBreaksRenderer(fieldName: "POP2007", classBreaks: [classBreak1, classBreak2, classBreak3, classBreak4, classBreak5])
}
}
#Preview {
ApplyClassBreaksRendererToSublayerView()
}