Display common symbols for all graphics in a graphics overlay with a renderer.
Use case
Graphics are often used to display data that changes location regularly because they are held in memory instead of being persisted to the map. When a number of graphics are required to share the same style, a simple renderer can be applied to the graphics overlay containing the graphics. For example, the location of mobile taxis from a same company could be plotted on a map with each taxi marked by a relevant symbol.
How to use the sample
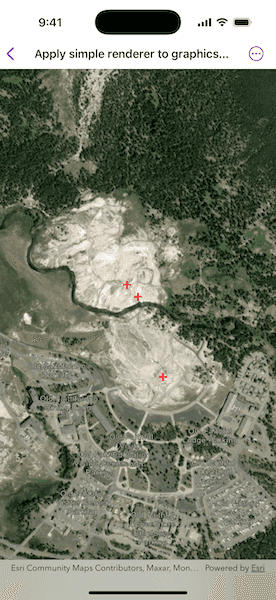
The sample loads with a predefined simple renderer, which displays a red cross simple marker symbol for the graphics in the graphics overlay.
How it works
- Create a
GraphicsOverlay. - Create a number of
Pointobjects with x, y, and spatial reference parameters. - Create a number of
Graphicobjects with the points from step 2. - Add the graphics to the graphics overlay.
- Create a
SimpleMarkerSymbolpassing in style, color, and size as parameters. - Create a
SimpleRenderer. - Set the simple renderer to the graphics overlay.
Relevant API
- Graphic
- GraphicsOverlay
- Point
- SimpleMarkerSymbol
- SimpleRenderer
Additional information
Renderers are used to display graphics that don't already have a symbol set. A renderer will not override a graphic's symbol if one has been set.
Tags
graphics, marker, renderer, symbol, symbolize, symbology
Sample Code
// Copyright 2025 Esri
//
// Licensed under the Apache License, Version 2.0 (the "License");
// you may not use this file except in compliance with the License.
// You may obtain a copy of the License at
//
// https://www.apache.org/licenses/LICENSE-2.0
//
// Unless required by applicable law or agreed to in writing, software
// distributed under the License is distributed on an "AS IS" BASIS,
// WITHOUT WARRANTIES OR CONDITIONS OF ANY KIND, either express or implied.
// See the License for the specific language governing permissions and
// limitations under the License.
import ArcGIS
import SwiftUI
struct ApplySimpleRendererToGraphicsOverlayView: View {
/// A map with imagery basemap centered on Yellowstone National Park.
@State private var map: Map = {
let map = Map(basemapStyle: .arcGISImagery)
map.initialViewpoint = Viewpoint(latitude: 44.462, longitude: -110.829, scale: 1e4)
return map
}()
/// A graphics overlay to add graphics with a renderer to style them.
@State private var graphicsOverlay: GraphicsOverlay = {
// Creates a graphics overlay to add graphics to the map.
let overlay = GraphicsOverlay()
// Creates points to add graphics with a renderer to style them.
let oldFaithful = Point(latitude: 44.460458, longitude: -110.828140)
let cascadeGeyser = Point(latitude: 44.462438, longitude: -110.829004)
let plumeGeyser = Point(latitude: 44.462735, longitude: -110.829381)
// Creates graphics from the points.
let oldFaithfulGraphic = Graphic(geometry: oldFaithful)
let cascadeGeyserGraphic = Graphic(geometry: cascadeGeyser)
let plumeGeyserGraphic = Graphic(geometry: plumeGeyser)
// Adds the graphics to the graphics overlay.
overlay.addGraphics([oldFaithfulGraphic, cascadeGeyserGraphic, plumeGeyserGraphic])
// Creates a simple renderer with red cross symbol.
let simpleRenderer = SimpleRenderer(
symbol: SimpleMarkerSymbol(style: .cross, color: .red, size: 12)
)
overlay.renderer = simpleRenderer
return overlay
}()
var body: some View {
MapView(map: map, graphicsOverlays: [graphicsOverlay])
}
}
#Preview {
ApplySimpleRendererToGraphicsOverlayView()
}