Create a simple electric distribution report that displays the count of customers and total load per phase by tracing downstream from a given point.
Use case
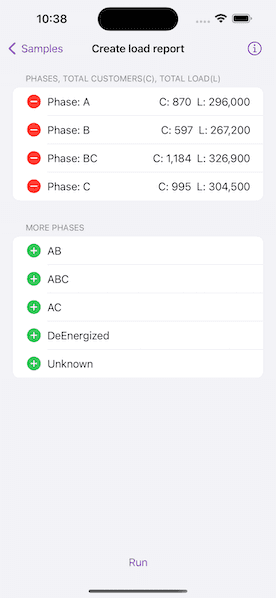
You can use a load report to display the customers per phase as well as the load per phase based on a chosen starting point in a utility network. Load reports are used for electric load restoration and balancing.
How to use the sample
Choose phases to be included in the report. Tap "Run" to initiate a downstream trace on the network and create a load report.
How it works
- Create and load a
UtilityNetworkwith aServiceGeodatabasefrom a feature service URL, then get an asset type, tier, network attributes, and category by their names. - Create a
UtilityElementfrom the asset type to use as the starting location for the trace. - Get a base condition by calling the utility tier's
makeDefaultTraceConfigurationmethod. - Create
UtilityTraceParameterspassing indownstreamtrace type and the default starting location. Set itstraceConfigurationproperty with the trace configuration above, and setincludesBarrierstofalse. - Create a
UtilityCategoryComparisonwhere "ServicePoint" category exists. - Reset the
functionsproperty of the trace configuration with a newUtilityTraceFunctionadding a "Service Load" network attribute where this category comparison applies. This will limit the function results. - Set
outputConditionwith this category comparison to limit the element results. - Populate the choice list for phases using the network attribute's
codedValuesproperty. - When the "Add" button is tapped, add the selected phase to a phases list.
- When the "Run" button is tapped, run a trace for every
CodedValuein the phases list. Do this by creating anUtilityTraceOrConditionwith the base condition and anUtilityNetworkAttributeComparisonwhere the "Phases Current" network attribute does not include the coded value. - Display the count of "Total Customers" using the
elementsproperty of the result, and the result of "Total Load" using the first and only output infunctionOutputsproperty.
Relevant API
- UtilityAssetType
- UtilityCategoryComparison
- UtilityDomainNetwork
- UtilityElement
- UtilityElementTraceResult
- UtilityNetwork
- UtilityNetworkAttribute
- UtilityNetworkAttributeComparison
- UtilityNetworkDefinition
- UtilityNetworkSource
- UtilityTerminal
- UtilityTier
- UtilityTraceConfiguration
- UtilityTraceFunction
- UtilityTraceParameters
- UtilityTraceResult
- UtilityTraceType
- UtilityTraversability
Tags
condition barriers, downstream trace, network analysis, subnetwork trace, trace configuration, traversability, upstream trace, utility network, validate consistency
Sample Code
// Copyright 2023 Esri
//
// Licensed under the Apache License, Version 2.0 (the "License");
// you may not use this file except in compliance with the License.
// You may obtain a copy of the License at
//
// https://www.apache.org/licenses/LICENSE-2.0
//
// Unless required by applicable law or agreed to in writing, software
// distributed under the License is distributed on an "AS IS" BASIS,
// WITHOUT WARRANTIES OR CONDITIONS OF ANY KIND, either express or implied.
// See the License for the specific language governing permissions and
// limitations under the License.
import SwiftUI
struct CreateLoadReportView: View {
/// The view model for the sample.
@StateObject private var model = Model()
var body: some View {
LoadReportView(model: model)
.task {
await model.setup()
}
.errorAlert(presentingError: $model.error)
.toolbar {
ToolbarItem(placement: .bottomBar) {
Button("Run") {
Task {
await model.createLoadReport()
}
}
.disabled(!model.allowsCreateLoadReport)
}
}
.overlay(alignment: .center) {
if let status = model.statusText {
ZStack {
Color.clear.background(.ultraThinMaterial)
VStack {
Text(status)
ProgressView()
.progressViewStyle(.circular)
}
.padding()
.background(.ultraThickMaterial)
.clipShape(.rect(cornerRadius: 10))
.shadow(radius: 50)
}
}
}
.onTeardown {
model.tearDown()
}
}
}
#Preview {
NavigationStack {
CreateLoadReportView()
}
}