Query a table to get aggregated statistics back for a specific field.
Use case
For example, a county boundaries table with population information can be queried to return aggregated results for total, average, maximum, and minimum population, rather than downloading the values for every county and calculating statistics manually.
How to use the sample
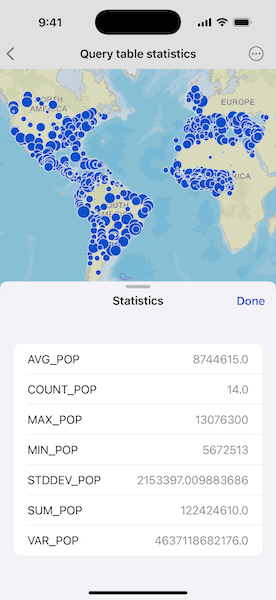
Pan and zoom to define the extent for the query. Use the "Include Cities Outside Extent" toggle to control whether the query only includes features in the visible extent. Use the "Include Cities Under 5M" toggle to filter the results to only those cities with a population greater than 5 million people. Tap "Query Statistics" to perform the query and view the statistics. The query will return population-based statistics from the combined results of all features matching the query criteria.
How it works
- Create a
ServiceFeatureTablewith a URL to the feature service. - Create
StatisticsQueryParametersusing an array ofStatisticDefinitionobjects. Depending on the state of the two toggles, additional parameters are set. - Query the feature table by passing the parameters to
queryStatistics(using:) - Display each
StatisticRecordin the returnedQueryStatisticsResult.
Relevant API
- ServiceFeatureTable
- StatisticDefinition
- StatisticRecord
- StatisticsQueryParameters
- StatisticsQueryResult
- StatisticType
Tags
analysis, average, bounding geometry, filter, intersect, maximum, mean, minimum, query, spatial query, standard deviation, statistics, sum, variance
Sample Code
// Copyright 2025 Esri
//
// Licensed under the Apache License, Version 2.0 (the "License");
// you may not use this file except in compliance with the License.
// You may obtain a copy of the License at
//
// https://www.apache.org/licenses/LICENSE-2.0
//
// Unless required by applicable law or agreed to in writing, software
// distributed under the License is distributed on an "AS IS" BASIS,
// WITHOUT WARRANTIES OR CONDITIONS OF ANY KIND, either express or implied.
// See the License for the specific language governing permissions and
// limitations under the License.
import ArcGIS
import SwiftUI
struct QueryTableStatisticsView: View {
/// The view model for the sample.
@State private var model = Model()
/// The current viewpoint of the map view.
@State private var viewpoint: Viewpoint?
/// The statistic records resulting from a query.
@State private var statisticRecords: [StatisticRecord] = []
/// A Boolean value indicating whether queries will include cities outside
/// of the map view's current extent.
@State private var includesCitiesOutsideExtent = false
/// A Boolean value indicating whether queries will include cities with
/// populations under 5 million.
@State private var includesCitiesUnder5M = false
/// A Boolean value indicating whether there is an ongoing query operation.
@State private var isQuerying = false
/// A Boolean value indicating whether the settings view is showing.
@State private var isShowingSettings = false
/// A Boolean value indicating whether the statistic list is showing.
@State private var isShowingStatistics = false
/// An error thrown from a query.
@State private var queryError: (any Error)?
var body: some View {
MapView(map: model.map, viewpoint: viewpoint)
.onViewpointChanged(kind: .boundingGeometry) { viewpoint = $0 }
.toolbar {
ToolbarItemGroup(placement: .bottomBar) {
Button("Query Statistics") {
isQuerying = true
}
.disabled(isQuerying)
.task(id: isQuerying) {
// Queries the statistics when the button is pressed.
guard isQuerying else {
return
}
defer { isQuerying = false }
do {
let extent = includesCitiesOutsideExtent ? nil : viewpoint?.targetGeometry
statisticRecords = try await model.queryStatistics(
within: extent,
includesCitiesUnder5M: includesCitiesUnder5M
)
isShowingStatistics = true
} catch {
self.queryError = error
}
}
.sheet(isPresented: $isShowingStatistics) {
StatisticList(records: statisticRecords)
.presentationDetents([.medium, .large])
}
Spacer()
Button("Settings", systemImage: "gear") {
isShowingSettings = true
}
.labelStyle(.iconOnly)
.popover(isPresented: $isShowingSettings) {
Form {
Toggle("Include Cities Outside Extent", isOn: $includesCitiesOutsideExtent)
Toggle("Include Cities Under 5M", isOn: $includesCitiesUnder5M)
}
.frame(idealWidth: 320, idealHeight: 160)
.presentationCompactAdaptation(.popover)
}
}
}
.errorAlert(presentingError: $queryError)
}
}
/// A view that displays the statistics from a given list of statistic records.
private struct StatisticList: View {
/// The statistic records containing the statistics to display.
let records: [StatisticRecord]
/// The action to dismiss the view.
@Environment(\.dismiss) private var dismiss
var body: some View {
NavigationStack {
List(records, id: \.objectID) { record in
Section {
let statistics = record.statistics.sorted(by: { $0.key < $1.key })
ForEach(statistics, id: \.key) { name, value in
if let integer = value as? Int {
LabeledContent(name, value: integer, format: .number)
} else if let double = value as? Double {
LabeledContent(name, value: double, format: .number)
}
}
.textSelection(.enabled)
}
}
.navigationTitle("Statistics")
.navigationBarTitleDisplayMode(.inline)
.toolbar {
ToolbarItem(placement: .confirmationAction) {
Button("Done") {
dismiss()
}
}
}
}
}
}
/// The view model for this sample.
@Observable
private final class Model: Sendable {
/// A map with a streets basemap.
let map: Map = {
let map = Map(basemapStyle: .arcGISStreets)
let envelope = Envelope(
xRange: -14_803_800...5_233_700,
yRange: -15_950_300...17_262_800,
spatialReference: .webMercator
)
map.initialViewpoint = Viewpoint(boundingGeometry: envelope)
return map
}()
/// The service feature table containing the data to query.
private let serviceFeatureTable = ServiceFeatureTable(url: .sampleWorldCitiesLayer)
/// The parameters to use in the statistics query.
private let statisticsQueryParameters = StatisticsQueryParameters(
// Creates a statistic definition for the "POP" field and each of the statistic types.
statisticDefinitions: StatisticDefinition.StatisticType.allCases
.map { .init(fieldName: "POP", statisticType: $0) }
)
init() {
// Adds the table to the map as an operational layer.
let featureLayer = FeatureLayer(featureTable: serviceFeatureTable)
map.addOperationalLayer(featureLayer)
}
/// Queries the statistics of the data in the given extent.
/// - Parameters:
/// - extent: The geometry to query within.
/// - includesCitiesUnder5M: A Boolean value indicating whether queries
/// will include cities with populations under 5 million.
/// - Returns: The statistic records resulting from the query.
func queryStatistics(
within extent: Geometry?,
includesCitiesUnder5M: Bool
) async throws -> [StatisticRecord] {
// Sets up the parameters for the query.
statisticsQueryParameters.geometry = extent
statisticsQueryParameters.whereClause = includesCitiesUnder5M ? "" : "POP_RANK = 1"
// Queries the feature table using the parameters.
let result = try await serviceFeatureTable.queryStatistics(using: statisticsQueryParameters)
// Gets the statistic records from the query result.
let statisticRecords = Array(result.statisticRecords())
return statisticRecords
}
}
private extension StatisticRecord {
/// The object identifier for this statistic record.
var objectID: ObjectIdentifier { .init(self) }
}
private extension StatisticDefinition.StatisticType {
/// All the statistic types.
static var allCases: [Self] {
return [average, count, maximum, minimum, standardDeviation, sum, variance]
}
}
private extension URL {
/// The URL to the "Cities" layer on the "SampleWorldCities" map service.
static var sampleWorldCitiesLayer: URL {
URL(string: "https://sampleserver6.arcgisonline.com/arcgis/rest/services/SampleWorldCities/MapServer/0")!
}
}
#Preview {
QueryTableStatisticsView()
}