Query a feature table for statistics, grouping and sorting by different fields.

Use case
You can use statistical queries, grouping, and sorting to process large amounts of data saved in feature tables. This is helpful for identifying trends and relationships within the data, which can be used to support further interpretations and decisions. For example, a health agency can use information on medical conditions occurring throughout a country to identify at-risk areas or demographics, and decide on further action and preventive measures.
How to use the sample
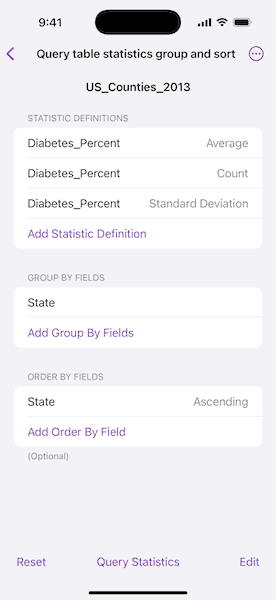
Select a combination of fields and statistic types to include in the query. Choose one or more fields by which to group the results. For example, selecting "State" will calculate the results by state. Choose one or more fields to order results by. Only those fields selected for grouping are valid choices for ordering results. Tap "Edit" to rearrange and delete the fields and statistic types. Tap the "Query Statistics" button to execute the query. Results will be displayed in a hierarchical view that is grouped and sorted according to the chosen fields. Tap "Reset" to clear the fields and statistic types.
How it works
- Create a
ServiceFeatureTableusing the URL of a feature service and load the table. - Create
StatisticDefinitionobjects and use them to createStatisticsQueryParameters. - To have the results grouped by fields, add the field names to the query parameters'
groupByFieldNamesarray. - To have the results ordered by fields, create
OrderByobjects, specifying the field name andSortOrder. Add theseOrderBys to the parameters'orderByFieldscollection. - To execute the query, call
FeatureTable.queryStatistics(using:). - From the
StatisticQueryResult, you can useStatisticsQueryResult.statisticRecords()to loop through and display theStatisticRecordobjects.
Relevant API
- Field
- OrderBy
- QueryParameters
- ServiceFeatureTable
- StatisticDefinition
- StatisticRecord
- StatisticsQueryParameters
- StatisticsQueryResult
- StatisticType
About the data
This sample uses a Diabetes, Obesity, and Inactivity by US County feature layer hosted on ArcGIS Online.
Tags
correlation, data, fields, filter, group, sort, statistics, table
Sample Code
// Copyright 2025 Esri
//
// Licensed under the Apache License, Version 2.0 (the "License");
// you may not use this file except in compliance with the License.
// You may obtain a copy of the License at
//
// https://www.apache.org/licenses/LICENSE-2.0
//
// Unless required by applicable law or agreed to in writing, software
// distributed under the License is distributed on an "AS IS" BASIS,
// WITHOUT WARRANTIES OR CONDITIONS OF ANY KIND, either express or implied.
// See the License for the specific language governing permissions and
// limitations under the License.
import ArcGIS
import SwiftUI
struct QueryTableStatisticsGroupAndSortView: View {
/// The view model containing the feature table to query.
@State private var model = Model()
/// The definitions for the statistics to be queried for in the feature table.
@State private var statisticDefinitions: [StatisticDefinition] = []
/// The field names by which statistical query results will be grouped.
@State private var groupByFields: [String] = []
/// The fields by which statistical query results will be ordered.
@State private var orderByFields: [OrderBy] = []
/// The records resulting from a statistical query.
@State private var statisticRecords: [StatisticRecord] = []
/// A Boolean value indicating whether there is an ongoing query operation.
@State private var isQuerying = false
/// A view that can be displayed in the sheet for this sample.
private enum SheetView: Identifiable {
case addStatisticDefinition, addGroupByFields, addOrderByField, statisticRecordsList
var id: Self { self }
}
/// The view currently presented in the sheet.
@State private var presentedSheetView: SheetView?
/// The error shown in the error alert.
@State private var error: (any Error)?
/// A Boolean value indicating whether edits have been made to the from.
private var formHasEdits: Bool {
!statisticDefinitions.isEmpty || !groupByFields.isEmpty || !orderByFields.isEmpty
}
var body: some View {
VStack {
Text(model.tableName)
.font(.headline.bold())
.padding(.top)
Form {
Section("Statistic Definitions") {
ForEach(statisticDefinitions, id: \.objectID) { definition in
LabeledContent(definition.fieldName, value: definition.statisticType.label)
}
.onDelete { statisticDefinitions.remove(atOffsets: $0) }
Button("Add Statistic Definition") {
presentedSheetView = .addStatisticDefinition
}
}
Section("Group By Fields") {
ForEach(groupByFields, id: \.self) { field in
Text(field)
}
.onDelete { offsets in
// Removes the corresponding order by fields.
let groupByFieldsToRemove = Set(offsets.map { groupByFields[$0] })
orderByFields.removeAll(
where: { groupByFieldsToRemove.contains($0.fieldName) }
)
groupByFields.remove(atOffsets: offsets)
}
.onMove { groupByFields.move(fromOffsets: $0, toOffset: $1) }
Button("Add Group By Fields") {
presentedSheetView = .addGroupByFields
}
}
Section {
ForEach(orderByFields, id: \.fieldName) { field in
let sortByLabel = field.sortOrder == .ascending ? "Ascending" : "Descending"
LabeledContent(field.fieldName, value: sortByLabel)
}
.onDelete { orderByFields.remove(atOffsets: $0) }
.onMove { orderByFields.move(fromOffsets: $0, toOffset: $1) }
Button("Add Order By Field") {
presentedSheetView = .addOrderByField
}
.disabled(groupByFields.isEmpty)
} header: {
Text("Order By Fields")
} footer: {
Text("(Optional)")
}
}
}
.background(Color(.systemGroupedBackground))
.overlay(alignment: .center) {
if isQuerying {
ProgressView("Querying Statistics")
.padding()
.background(.ultraThickMaterial)
.clipShape(.rect(cornerRadius: 10))
.shadow(radius: 50)
}
}
.toolbar {
ToolbarItemGroup(placement: .bottomBar) {
Button("Reset") {
statisticDefinitions.removeAll()
groupByFields.removeAll()
orderByFields.removeAll()
}
.disabled(!formHasEdits)
Spacer()
Button("Query Statistics") {
isQuerying = true
}
.disabled(isQuerying || statisticDefinitions.isEmpty || groupByFields.isEmpty)
.task(id: isQuerying) {
// Queries the statistics when the button is pressed.
guard isQuerying else {
return
}
defer { isQuerying = false }
do {
statisticRecords = try await queryStatistics()
presentedSheetView = .statisticRecordsList
} catch {
self.error = error
}
}
Spacer()
EditButton()
.disabled(!formHasEdits)
}
}
.sheet(item: $presentedSheetView) { sheetView in
NavigationStack {
switch sheetView {
case .addStatisticDefinition:
AddStatisticDefinitionView(
definitions: $statisticDefinitions,
fieldOptions: model.numericFields
)
case .addGroupByFields:
let unselectedFields = model.fields.filter { !groupByFields.contains($0) }
AddGroupByFieldsView(
groupByFields: $groupByFields,
fieldOptions: unselectedFields
)
case .addOrderByField:
let unselectedGroupByFields = groupByFields.filter { field in
!orderByFields.contains(where: { $0.fieldName == field })
}
AddOrderByFieldView(
orderByFields: $orderByFields,
fieldOptions: unselectedGroupByFields
)
case .statisticRecordsList:
StatisticRecordsList(records: statisticRecords, groupByFields: groupByFields)
}
}
}
.task {
// Sets up the model when the sample opens.
do {
try await model.setUp()
} catch {
self.error = error
}
}
.errorAlert(presentingError: $error)
}
/// Queries the feature table's statistics using the current view state.
/// - Returns: The statistic records resulting from the query.
private func queryStatistics() async throws -> [StatisticRecord] {
// Creates query parameters using the added definitions and fields.
let queryParameters = StatisticsQueryParameters(statisticDefinitions: statisticDefinitions)
queryParameters.addGroupByFieldNames(groupByFields)
queryParameters.addOrderByFields(orderByFields)
// Queries the feature table's statistics using the parameters.
let queryResult = try await model.featureTable.queryStatistics(using: queryParameters)
// Gets the statistic records from the query result.
return Array(queryResult.statisticRecords())
}
}
/// The view model containing the feature table to query.
@Observable
private final class Model {
/// A feature table containing 2013 diabetes, inactivity, and obesity data
/// for counties in the US.
let featureTable = ServiceFeatureTable(url: .usCounties2013Layer)
/// The name of the feature table in its source dataset.
private(set) var tableName = ""
/// The names of the feature table's fields.
@ObservationIgnored private(set) var fields: [String] = []
/// The names of the feature table fields that have a numeric field type.
@ObservationIgnored private(set) var numericFields: [String] = []
/// Loads the feature table and sets up the model's properties.
@MainActor
func setUp() async throws {
try await featureTable.load()
tableName = featureTable.tableName
fields = featureTable.fields.compactMap { field in
field.type != .oid && field.type != .globalID
? field.name
: nil
}
let numericFieldTypes: Set<FieldType> = [.int16, .int32, .int64, .float32, .float64]
numericFields = featureTable.fields.compactMap { field in
if let type = field.type, numericFieldTypes.contains(type) {
field.name
} else {
nil
}
}
}
}
private extension StatisticDefinition {
/// The identifier for the statistic definition object.
var objectID: ObjectIdentifier { .init(self) }
}
extension StatisticDefinition.StatisticType {
/// A human-readable label for the statistic type.
var label: String {
switch self {
case .average: "Average"
case .count: "Count"
case .maximum: "Maximum"
case .minimum: "Minimum"
case .standardDeviation: "Standard Deviation"
case .sum: "Sum"
case .variance: "Variance"
@unknown default: "Unknown"
}
}
}
private extension URL {
/// A URL to the "US_Counties_2013" layer on the
/// "Counties_Obesity_Inactivity_Diabetes_2013" feature service.
static var usCounties2013Layer: URL {
URL(string: "https://services.arcgis.com/jIL9msH9OI208GCb/arcgis/rest/services/Counties_Obesity_Inactivity_Diabetes_2013/FeatureServer/0")!
}
}
#Preview {
QueryTableStatisticsGroupAndSortView()
}