Create and display geodesic sectors and ellipses.
Use case
Geodesic sectors and ellipses can be used in a wide range of analyses ranging from projectile landing zones to antenna coverage. For example, given the strength and direction of a cellular tower's signal, you could generate cell coverage geometries to identify areas without sufficient connectivity.
How to use the sample
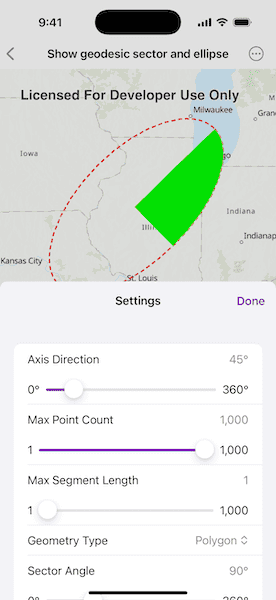
The geodesic sector and ellipse will display with default parameters at the start. Click anywhere on the map to change the center of the geometries. Adjust any of the controls to see how they affect the sector and ellipse on the fly.
How it works
To create a geodesic sector and ellipse:
- Create
GeodesicSectorParametersandGeodesicEllipseParametersvalues. - Use
center,axisDirection,semiAxis1Length, andsemiAxis2Lengthto set the general ellipse position, shape, and orientation. - Use
sectorAngleandstartDirectionto set the sector's shape and orientation. - Use
maxPointCountandmaxSegmentLengthto control the complexity of the geometries and the approximation of the ellipse curve. - Use
geometryTypeto change the result geometry type. - Pass the parameters to the related static methods:
GeometryEngine.geodesicEllipse(parameters:)andGeometryEngine.geodesicSector(parameters:). The returned geometry type is that of the parameters.
Relevant API
GeodesicEllipseParameters GeodesicSectorParameters GeometryEngine
Additional information
To create a circle instead of an ellipse, simply set semiAxis2Length to 0 and semiAxis1Length to the desired radius of the circle. This eliminates the need to update both parameters to the same value.
Tags
ellipse, geodesic, geometry, sector
Sample Code
// Copyright 2025 Esri
//
// Licensed under the Apache License, Version 2.0 (the "License");
// you may not use this file except in compliance with the License.
// You may obtain a copy of the License at
//
// https://www.apache.org/licenses/LICENSE-2.0
//
// Unless required by applicable law or agreed to in writing, software
// distributed under the License is distributed on an "AS IS" BASIS,
// WITHOUT WARRANTIES OR CONDITIONS OF ANY KIND, either express or implied.
// See the License for the specific language governing permissions and
// limitations under the License.
import ArcGIS
import SwiftUI
struct ShowGeodesicSectorAndEllipseView: View {
/// The data model that helps determine the view.
@State private var model = Model()
/// Manages the presentation state of the menu.
@State private var isPresented = false
var body: some View {
MapViewReader { mapView in
MapView(
map: model.map,
graphicsOverlays: model.graphicOverlays
)
.onSingleTapGesture { _, tapPoint in
model.center = tapPoint
}
.task(id: model.center) {
guard let center = model.center else { return }
await mapView.setViewpoint(
Viewpoint(center: center, scale: 1e7)
)
}
.overlay(alignment: .top) {
if model.center == nil {
Text("Tap map to create a geodesic sector.")
.frame(maxWidth: .infinity)
.padding(.vertical, 6)
.background(.thinMaterial, ignoresSafeAreaEdges: .horizontal)
}
}
.toolbar {
ToolbarItemGroup(placement: .bottomBar) {
Button("Settings") {
isPresented = true
}
.disabled(model.center == nil)
.sheet(isPresented: $isPresented) {
settingsSheet
}
}
}
}
}
/// The menu which holds the options that change the ellipse and sector.
private var settingsSheet: some View {
NavigationStack {
SectorSettingsView(model: $model)
.presentationDetents([.medium])
.navigationTitle("Settings")
.navigationBarTitleDisplayMode(.inline)
.toolbar {
ToolbarItem(placement: .confirmationAction) {
Button("Done") {
isPresented = false
}
}
}
}
}
}
private extension ShowGeodesicSectorAndEllipseView {
/// Custom data type so that Geometry options can be displayed in the menu.
enum GeometryType: CaseIterable {
case point, polyline, polygon
var label: String {
switch self {
case .point: "Point"
case .polyline: "Polyline"
case .polygon: "Polygon"
}
}
}
/// A view model that encapsulates logic and state for rendering a geodesic sector and ellipse.
/// Handles user-configured parameters and updates overlays when those parameters change.
@Observable
final class Model {
/// The map that will be displayed in the map view.
let map = Map(basemapStyle: .arcGISTopographic)
/// The map point selected by the user when tapping on the map.
var center: Point? {
didSet {
updateSector()
}
}
var graphicOverlays: [GraphicsOverlay] {
return [ellipseGraphicOverlay, sectorGraphicOverlay]
}
/// The graphics overlay that will be displayed on the map view.
/// This will hold the graphics that show the ellipse path.
private let ellipseGraphicOverlay = GraphicsOverlay()
/// The graphics overlay that will be displayed on the map view.
/// This will display a highlighted section of the ellipse path.
private let sectorGraphicOverlay = {
let overlay = GraphicsOverlay()
overlay.renderer = SimpleRenderer(symbol: SimpleFillSymbol(style: .solid, color: .green))
return overlay
}()
/// The direction (in degrees) of the ellipse's major axis.
var axisDirection = Measurement<UnitAngle>(value: 45, unit: .degrees) {
didSet {
updateSector()
}
}
/// Controls the complexity of the geometries and the approximation of the ellipse curve.
var maxSegmentLength = 1.0 {
didSet {
updateSector()
}
}
/// Changes the sectors shape.
var sectorAngle = Measurement<UnitAngle>(value: 90, unit: .degrees) {
didSet {
updateSector()
}
}
/// Controls the complexity of the geometries and the approximation of the ellipse curve.
var maxPointCount = 1_000.0 {
didSet {
updateSector()
}
}
/// Changes the length of ellipse shape on one axis.
var semiAxis1Length = 200.0 {
didSet {
updateSector()
}
}
/// Changes the length of ellipse shape on one axis.
var semiAxis2Length = 100.0 {
didSet {
updateSector()
}
}
/// Changes the geometry type which the sector is rendered.
var geometryType: GeometryType = .polygon {
didSet {
updateSector()
}
}
/// Changes the direction of the sector.
var startDirection = 45.0 {
didSet {
updateSector()
}
}
private func updateSector() {
updateEllipse()
setupSector()
}
private func setupSector() {
sectorGraphicOverlay.removeAllGraphics()
switch geometryType {
case .point:
// Generate sector as a multipoint (symbols).
var parameters = GeodesicSectorParameters<Multipoint>()
fillSectorParameters(¶meters)
if let geometry = GeometryEngine.geodesicSector(parameters: parameters) {
let symbol = SimpleMarkerSymbol(style: .circle, color: .green, size: 2)
addSectorGraphic(geometry: geometry, symbol: symbol)
}
case .polyline:
// Generate sector as a polyline (outlined arc).
var parameters = GeodesicSectorParameters<Polyline>()
fillSectorParameters(¶meters)
if let geometry = GeometryEngine.geodesicSector(parameters: parameters) {
let symbol = SimpleLineSymbol(style: .solid, color: .green, width: 2)
addSectorGraphic(geometry: geometry, symbol: symbol)
}
case .polygon:
// Generate sector as a filled polygon.
var parameters = GeodesicSectorParameters<ArcGIS.Polygon>()
fillSectorParameters(¶meters)
if let geometry = GeometryEngine.geodesicSector(parameters: parameters) {
let symbol = SimpleFillSymbol(style: .solid, color: .green)
addSectorGraphic(geometry: geometry, symbol: symbol)
}
}
}
/// Populates a geodesic sector parameters value with current user-defined values.
/// - Parameter parameters: A reference to the parameter struct that will be filled.
private func fillSectorParameters<T>(_ parameters: inout GeodesicSectorParameters<T>) {
parameters.center = center
parameters.axisDirection = axisDirection.value
parameters.maxPointCount = Int(maxPointCount.rounded())
parameters.maxSegmentLength = maxSegmentLength
parameters.sectorAngle = sectorAngle.value
parameters.semiAxis1Length = semiAxis1Length
parameters.semiAxis2Length = semiAxis2Length
parameters.startDirection = startDirection
parameters.linearUnit = .miles
}
/// Adds a sector graphic to the overlay and applies the appropriate renderer.
private func addSectorGraphic(geometry: Geometry, symbol: Symbol) {
let sectorGraphic = Graphic(geometry: geometry, symbol: symbol)
sectorGraphicOverlay.addGraphic(sectorGraphic)
}
/// Generates and adds a geodesic ellipse graphic based on the current settings and center point.
private func updateEllipse() {
ellipseGraphicOverlay.removeAllGraphics()
let parameters = GeodesicEllipseParameters<ArcGIS.Polygon>(
axisDirection: axisDirection.value,
center: center,
linearUnit: .miles,
maxPointCount: Int(maxPointCount.rounded()),
maxSegmentLength: maxSegmentLength,
semiAxis1Length: semiAxis1Length,
semiAxis2Length: semiAxis2Length
)
let geometry = GeometryEngine.geodesicEllipse(parameters: parameters)
let symbol = SimpleLineSymbol(style: .dash, color: .red, width: 2)
let graphic = Graphic(geometry: geometry, symbol: symbol)
ellipseGraphicOverlay.addGraphic(graphic)
}
}
struct SectorSettingsView: View {
@Binding var model: ShowGeodesicSectorAndEllipseView.Model
private var numberFormat: FloatingPointFormatStyle<Double> {
.init().precision(.fractionLength(0))
}
private var angleFormat: Measurement<UnitAngle>.FormatStyle {
.init(width: .narrow, numberFormatStyle: numberFormat)
}
var body: some View {
Form {
LabeledContent(
"Axis Direction",
value: model.axisDirection,
format: angleFormat
)
let axisDirectionRange = 0.0...360.0
Slider(
value: $model.axisDirection.value,
in: axisDirectionRange
) {
Text("Axis Direction")
} minimumValueLabel: {
Text(
Measurement<UnitAngle>(
value: axisDirectionRange.lowerBound,
unit: .degrees
),
format: angleFormat
)
} maximumValueLabel: {
Text(
Measurement<UnitAngle>(
value: axisDirectionRange.upperBound,
unit: .degrees
),
format: angleFormat
)
}
.listRowSeparator(.hidden, edges: .top)
LabeledContent(
"Max Point Count",
value: model.maxPointCount,
format: numberFormat
)
let maxPointCountRange = 1.0...1_000.0
Slider(
value: $model.maxPointCount,
in: maxPointCountRange,
step: 1
) {
Text("Max Point Count")
} minimumValueLabel: {
Text(maxPointCountRange.lowerBound, format: numberFormat)
} maximumValueLabel: {
Text(maxPointCountRange.upperBound, format: numberFormat)
}
.listRowSeparator(.hidden, edges: .top)
LabeledContent(
"Max Segment Length",
value: model.maxSegmentLength,
format: numberFormat
)
let maxSegmentLengthRange = 1.0...1_000.0
Slider(
value: $model.maxSegmentLength,
in: maxSegmentLengthRange
) {
Text("Max Segment Length")
} minimumValueLabel: {
Text(maxSegmentLengthRange.lowerBound, format: numberFormat)
} maximumValueLabel: {
Text(maxSegmentLengthRange.upperBound, format: numberFormat)
}
.listRowSeparator(.hidden, edges: .top)
Picker("Geometry Type", selection: $model.geometryType) {
ForEach(GeometryType.allCases, id: \.self) { geometryType in
Text(geometryType.label)
}
}
LabeledContent(
"Sector Angle",
value: model.sectorAngle,
format: angleFormat
)
let sectorAngleRange = 0.0...360.0
Slider(
value: $model.sectorAngle.value,
in: sectorAngleRange
) {
Text("Sector Angle")
} minimumValueLabel: {
Text(
Measurement<UnitAngle>(
value: sectorAngleRange.lowerBound,
unit: .degrees
),
format: angleFormat
)
} maximumValueLabel: {
Text(
Measurement<UnitAngle>(
value: sectorAngleRange.upperBound,
unit: .degrees
),
format: angleFormat
)
}
.listRowSeparator(.hidden, edges: .top)
LabeledContent(
"Semi Axis 1 Length",
value: model.semiAxis1Length,
format: numberFormat
)
let semiAxis1LengthRange = 0.0...1_0000.0
Slider(
value: $model.semiAxis1Length,
in: semiAxis1LengthRange
) {
Text("Semi Axis 1 Length")
} minimumValueLabel: {
Text(semiAxis1LengthRange.lowerBound, format: numberFormat)
} maximumValueLabel: {
Text(semiAxis1LengthRange.upperBound, format: numberFormat)
}
.listRowSeparator(.hidden, edges: [.top])
LabeledContent(
"Semi Axis 2 Length",
value: model.semiAxis2Length,
format: numberFormat
)
let semiAxis2LengthRange = 0.0...1_000.0
Slider(
value: $model.semiAxis2Length,
in: semiAxis2LengthRange
) {
Text("Semi Axis 2 Length")
} minimumValueLabel: {
Text(semiAxis2LengthRange.lowerBound, format: numberFormat)
} maximumValueLabel: {
Text(semiAxis2LengthRange.upperBound, format: numberFormat)
}
.listRowSeparator(.hidden, edges: [.top])
}
}
}
}
#Preview {
ShowGeodesicSectorAndEllipseView()
}