Show a line of sight between two moving objects.
Use case
A line of sight between GeoElements (i.e. observer and target) will not remain constant whilst one or both are on the move.
A GeoElementLineOfSight is therefore useful in cases where visibility between two GeoElements requires monitoring over a period of time in a partially obstructed field of view (such as buildings in a city).
How to use the sample
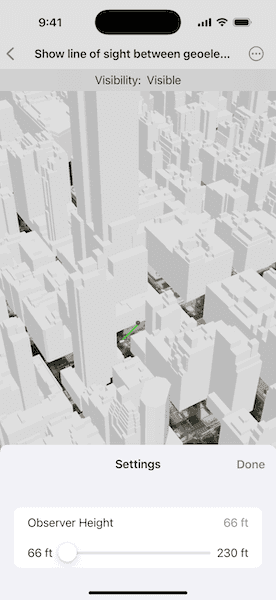
A line of sight will display between a point on the Empire State Building (observer) and a taxi (target). The taxi will drive around a block and the line of sight should automatically update. The taxi will be highlighted when it is visible. You can change the observer height with the slider to see how it affects the target's visibility.
How it works
- Instantiate an
AnalysisOverlayand add it to theSceneView's analysis overlays collection. - Instantiate a
GeoElementLineOfSight, passing in observer and targetGeoElements (features or graphics). Add the line of sight to the analysis overlay's analyses collection. - To get the target visibility when it changes, react to the target visibility changing on the
GeoElementLineOfSightinstance.
Relevant API
- AnalysisOverlay
- GeoElementLineOfSight
- LineOfSight.TargetVisibility
Offline data
This sample uses the Taxi CAD Drawing. It is downloaded from ArcGIS Online automatically.
Tags
3D, line of sight, visibility, visibility analysis
Sample Code
// Copyright 2025 Esri
//
// Licensed under the Apache License, Version 2.0 (the "License");
// you may not use this file except in compliance with the License.
// You may obtain a copy of the License at
//
// https://www.apache.org/licenses/LICENSE-2.0
//
// Unless required by applicable law or agreed to in writing, software
// distributed under the License is distributed on an "AS IS" BASIS,
// WITHOUT WARRANTIES OR CONDITIONS OF ANY KIND, either express or implied.
// See the License for the specific language governing permissions and
// limitations under the License.
import ArcGIS
import SwiftUI
struct ShowLineOfSightBetweenGeoelementsView: View {
/// The view model for the sample.
@State private var model = Model()
/// A Boolean value indicating whether the settings sheet is presented.
@State private var isPresented = false
var body: some View {
SceneView(
scene: model.scene,
graphicsOverlays: [model.graphicsOverlay],
analysisOverlays: [model.analysisOverlay]
)
.onAppear {
model.setupAnimation()
}
.onDisappear {
model.stopAnimating()
}
.overlay(alignment: .top) {
HStack {
Text("Visibility:")
Text(model.targetVisibility.label)
}
.frame(maxWidth: .infinity)
.padding(.vertical, 6)
.background(.thinMaterial, ignoresSafeAreaEdges: .horizontal)
}
.toolbar {
ToolbarItemGroup(placement: .bottomBar) {
Button("Settings") {
isPresented = true
}
.popover(isPresented: $isPresented) {
settingsSheet
}
}
}
}
/// The settings configuration sheet for adjusting the observer's height.
private var settingsSheet: some View {
NavigationStack {
Form {
let heightRange = 20.0...70.0
LabeledContent(
"Observer Height",
value: Measurement(value: model.height, unit: UnitLength.meters),
format: .measurement(width: .abbreviated)
)
Slider(
value: $model.height,
in: heightRange,
step: 1
) {
Text("Observer Height")
} minimumValueLabel: {
Text(
Measurement(
value: heightRange.lowerBound,
unit: UnitLength.meters
),
format: .measurement(width: .abbreviated)
)
} maximumValueLabel: {
Text(
Measurement(
value: heightRange.upperBound,
unit: UnitLength.meters
),
format: .measurement(width: .abbreviated)
)
}
.listRowSeparator(.hidden, edges: .top)
}
.presentationDetents([.fraction(0.25)])
.navigationTitle("Settings")
.navigationBarTitleDisplayMode(.inline)
.toolbar {
ToolbarItem(placement: .confirmationAction) {
Button("Done") {
isPresented = false
}
}
}
}
.frame(idealWidth: 320, idealHeight: 380)
}
}
private extension ShowLineOfSightBetweenGeoelementsView {
/// View model responsible for setting up the 3D scene, graphics, animation,
/// and performing line of sight analysis between moving and static geoelements.
@MainActor
@Observable
final class Model {
/// A set of predefined waypoints for animating the taxi's movement.
private let points = [
Point(latitude: 40.748469, longitude: -73.984513),
Point(latitude: 40.747786, longitude: -73.985068),
Point(latitude: 40.747091, longitude: -73.983452),
Point(latitude: 40.747762, longitude: -73.982961)
]
/// The height of the observer in meters. Updates the observer graphic when changed.
var height = 20.0 {
didSet {
/// Updates the height value of the observer's point geometry.
guard let geometry = observerGraphic.geometry as? Point else { return }
observerGraphic.geometry = GeometryEngine.makeGeometry(from: geometry, z: height)
}
}
/// The current frame number in the animation sequence for the taxi's movement.
@ObservationIgnored private var frameIndex = 0
/// The total number of animation frames to complete a segment between two waypoints.
private let frameMax = 120
/// The index of the current start point in the `points` array used for animating the taxi's path.
@ObservationIgnored private var pointIndex = 0
/// The 3D scene containing basemap, elevation, and building layers.
let scene: ArcGIS.Scene = {
// Create a scene and set an initial viewpoint.
let scene = Scene(basemapStyle: .arcGISImagery)
// Add base surface from elevation service.
let elevationSource = ArcGISTiledElevationSource(url: .elevationService)
scene.baseSurface.addElevationSource(elevationSource)
let buildingLayer = ArcGISSceneLayer(url: .buildingsService)
scene.addOperationalLayer(buildingLayer)
let camera = Camera(
lookingAt: .observerPoint,
distance: 700.0,
heading: -30.0,
pitch: 45.0,
roll: 0.0
)
scene.initialViewpoint = Viewpoint(
boundingGeometry: .observerPoint,
camera: camera
)
return scene
}()
/// The graphics overlay used to render the observer and target symbols.
let graphicsOverlay: GraphicsOverlay = {
let overlay = GraphicsOverlay()
overlay.sceneProperties.surfacePlacement = .relative
return overlay
}()
/// An analysis overlay used to display the line of sight analysis visualization.
let analysisOverlay = AnalysisOverlay()
/// A line of sight analysis between the observer and the taxi graphic.
private let lineOfSight: GeoElementLineOfSight
/// A graphic representing the taxi model that will be animated.
private let taxiGraphic: Graphic = {
let sceneSymbol = ModelSceneSymbol(url: .taxi)
sceneSymbol.anchorPosition = .bottom
let graphic = Graphic(
geometry: .taxiPoint,
symbol: sceneSymbol
)
return graphic
}()
/// A graphic representing the observer's location in the scene.
private let observerGraphic = Graphic(
geometry: .observerPoint,
symbol: SimpleMarkerSceneSymbol(
style: .sphere,
color: .red,
height: 5,
width: 5,
depth: 5,
anchorPosition: .bottom
)
)
/// A timer to synchronize the taxi animation to the refresh rate of the display.
@ObservationIgnored private var displayLink: CADisplayLink!
/// The target visibility of the taxi graphic from the point of view of the observer.
var targetVisibility: GeoElementLineOfSight.TargetVisibility = .unknown
init() {
graphicsOverlay.addGraphics([observerGraphic, taxiGraphic])
lineOfSight = GeoElementLineOfSight(observer: observerGraphic, target: taxiGraphic)
lineOfSight.targetOffsetZ = 2
analysisOverlay.addAnalysis(lineOfSight)
}
/// Sets up and starts the animation for the taxi graphic. It initializes the `displayLink` property
/// that allows the sample to synchronize its drawing to the refresh rate of the display. It calls the `animateTaxiGraphic()`
/// method on every screen refresh ensuring smooth animation of the taxi as it moves along the waypoints.
func setupAnimation() {
displayLink = makeDisplayLink()
displayLink.isPaused = false
}
/// Creates a display link timer for the image overlay animation.
/// - Returns: A new `CADisplayLink` object.
private func makeDisplayLink() -> CADisplayLink {
// Create new display link.
let newDisplayLink = CADisplayLink(
target: self,
selector: #selector(animateTaxiGraphic)
)
// Set the default frame rate to 60 fps.
newDisplayLink.preferredFramesPerSecond = 60
// Add to main thread common mode run loop, so it is not effected by UI events.
newDisplayLink.add(to: .main, forMode: .common)
return newDisplayLink
}
/// Stops animating the taxi graphic.
func stopAnimating() {
displayLink.invalidate()
displayLink = nil
}
/// Animates the target graphic between a set of points in a loop,
/// updating the heading and visibility analysis on each frame.
@objc
private func animateTaxiGraphic() {
// Increment the frame counter
frameIndex += 1
// Reset frame counter when segment is completed
if frameIndex == frameMax {
frameIndex = 0
pointIndex += 1
if pointIndex == points.count {
pointIndex = 0
}
}
let starting = points[pointIndex]
let ending = points[(pointIndex + 1) % points.count]
let progress = Double(frameIndex) / Double(frameMax)
// Interpolate between points.
let intermediatePoint = interpolatedPoint(
from: starting,
to: ending,
progress: progress
)
taxiGraphic.geometry = intermediatePoint
if let distance = GeometryEngine.geodeticDistance(
from: starting,
to: ending,
distanceUnit: .meters,
azimuthUnit: .degrees,
curveType: .geodesic
) {
(taxiGraphic.symbol as? ModelSceneSymbol)?.heading = Float(distance.azimuth1.value)
}
targetVisibility = lineOfSight.targetVisibility
}
/// Returns a point interpolated between two coordinates based on a progress ratio.
/// - Parameters:
/// - startPoint: The start point.
/// - endPoint: The end point.
/// - progress: A value representing interpolation progress.
/// - Returns: An interpolated point based on the progress value.
private func interpolatedPoint(from startPoint: Point, to endPoint: Point, progress: Double) -> Point {
let x = startPoint.x + (endPoint.x - startPoint.x) * progress
let y = startPoint.y + (endPoint.y - startPoint.y) * progress
return Point(x: x, y: y, spatialReference: .wgs84)
}
}
}
private extension GeoElementLineOfSight.TargetVisibility {
/// A human-readable label for each target visibility.
var label: String {
switch self {
case .visible: "Visible"
case .obstructed: "Obstructed"
case .unknown: "Unknown"
@unknown default: "Unknown"
}
}
}
private extension Geometry {
/// A point representing the observer's location in New York City.
static var observerPoint: Point {
Point(
latitude: 40.748131,
longitude: -73.984988
)
}
/// A point representing the initial position of the taxi in New York City.
static var taxiPoint: Point {
Point(
latitude: 40.748469,
longitude: -73.984513
)
}
}
extension URL {
/// The URL of the Terrain 3D ArcGIS REST Service.
static var elevationService: URL {
URL(string: "https://elevation3d.arcgis.com/arcgis/rest/services/WorldElevation3D/Terrain3D/ImageServer")!
}
/// The URL of a New York City buildings scene service.
static var buildingsService: URL {
URL(string: "https://tiles.arcgis.com/tiles/z2tnIkrLQ2BRzr6P/arcgis/rest/services/Buildings_NewYork_v18/SceneServer/layers/0")!
}
/// The URL to the taxi model file.
static var taxi: URL {
Bundle.main.url(forResource: "dolmus", withExtension: "3ds", subdirectory: "Dolmus3ds")!
}
}