A renderer allows you to change the style of all graphics in a graphics overlay by referencing a single symbol style. A renderer will only affect graphics that do not specify their own symbol style.
Use case
A renderer allows you to change the style of all graphics in an overlay by only changing one copy of the symbol. For example, a user may wish to display a number of graphics on a map of parkland which represent trees, all sharing a common symbol.
How to use the sample
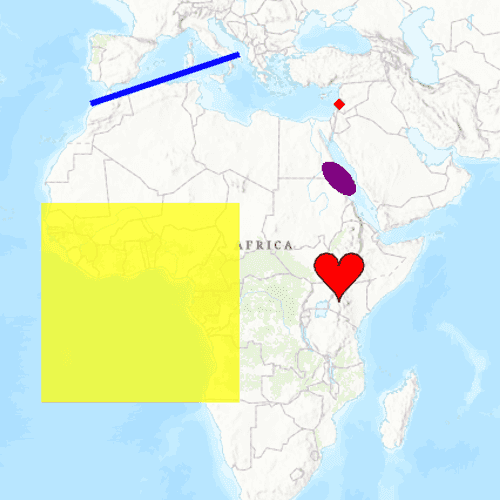
Pan and zoom on the map to view graphics for points, lines, and polygons (including polygons with curve segments), which are stylized using renderers.
How it works
- Create a
GraphicsOverlayand add it to theMapView. - Create a
Graphic, specifying only aGeometry. - Create a single
Symbolsuch as aSimpleMarkerSymbol. - Create a
Rendererwith theSymbol. - Set the renderer on the
GraphicsOverlay.
Relevant API
- CubicBezierSegment
- EllipticArcSegment
- GeodesicEllipseParameters
- Geometry
- GeometryEngine
- Graphic
- GraphicsOverlay
- PolygonBuilder
- PolylineBulder
- SimpleFillSymbol
- SimpleLineSymbol
- SimpleMarkerSymbol
- SimpleRenderer
Additional information
To set unique symbols across a number of graphics (e.g. showing graphics of individual landmarks) see "Add graphics with symbols" sample.
Tags
arc, bezier, curve, display, ellipse, graphics, marker, overlay, renderer, segment, symbol, true curve
Sample Code
// [WriteFile Name=AddGraphicsWithRenderer, Category=DisplayInformation]
// [Legal]
// Copyright 2016 Esri.
// Licensed under the Apache License, Version 2.0 (the "License");
// you may not use this file except in compliance with the License.
// You may obtain a copy of the License at
// http://www.apache.org/licenses/LICENSE-2.0
// Unless required by applicable law or agreed to in writing, software
// distributed under the License is distributed on an "AS IS" BASIS,
// WITHOUT WARRANTIES OR CONDITIONS OF ANY KIND, either express or implied.
// See the License for the specific language governing permissions and
// limitations under the License.
// [Legal]
import QtQuick
import QtQuick.Controls
import Esri.ArcGISRuntime
Rectangle {
width: 800
height: 600
property var rtCreate: ArcGISRuntimeEnvironment.createObject
// Map view UI presentation at top
MapView {
id: mapView
anchors.fill: parent
Component.onCompleted: {
// Set the focus on MapView to initially enable keyboard navigation
forceActiveFocus();
}
Map {
Basemap {
initStyle: Enums.BasemapStyleArcGISTopographic
}
}
GraphicsOverlay {
id: graphicsOverlay
}
Graphic {
id: pointGraphic
// A point graphic's geometry can be defined declaratively
geometry: Point {
x: 40e5
y: 40e5
spatialReference: SpatialReference {
wkid: 102100
}
}
symbol: SimpleMarkerSymbol {
style: Enums.SimpleMarkerSymbolStyleDiamond
color: "red"
size: 10
}
}
Graphic {
id: lineGraphic
symbol: SimpleLineSymbol {
style: Enums.SimpleLineSymbolStyleSolid
color: "blue"
width: 5
antiAlias: true
}
}
Graphic {
id: polygonGraphic
symbol: SimpleFillSymbol {
style: Enums.SimpleFillSymbolStyleSolid
color: Qt.rgba(1, 1, 0, 0.7)
}
}
Graphic {
id: ellipseGraphic
symbol: SimpleFillSymbol {
style: Enums.SimpleFillSymbolStyleSolid
color: "purple"
}
}
Graphic {
id: heartGraphic
symbol: SimpleFillSymbol {
style: Enums.SimpleFillSymbolStyleSolid
color: "red"
outline: SimpleLineSymbol {
style: Enums.SimpleLineSymbolStyleSolid
color: "black"
width: 1
}
}
}
// Used to construct the line graphic geometry
PolylineBuilder {
id: polylineBuilder
spatialReference: SpatialReference {
wkid: 102100
}
}
// Used to construct the polygon graphic geometry
PolygonBuilder {
id: polygonBuilder
spatialReference: SpatialReference {
wkid: 102100
}
}
// Used to define the ellipse geometry
GeodesicEllipseParameters {
id: geodesicEllipseParameters
center: Point {
x: 40e5
y: 25e5
spatialReference: Factory.SpatialReference.createWebMercator();
}
geometryType: Enums.GeometryTypePolygon
semiAxis1Length: 200
semiAxis2Length: 400
axisDirection: -45
maxPointCount: 100
angularUnit: AngularUnit {
angularUnitId: Enums.AngularUnitIdDegrees
}
linearUnit: LinearUnit {
linearUnitId: Enums.LinearUnitIdKilometers
}
maxSegmentLength: 20
}
}
Component.onCompleted: {
addPointGraphic();
addLineGraphic();
addPolygonGraphic();
addHeartGraphic();
addEllipseGraphic();
}
function addPointGraphic() {
graphicsOverlay.graphics.append(pointGraphic);
}
function addLineGraphic() {
// create the line by assigning points
polylineBuilder.addPointXY(-10e5, 40e5);
polylineBuilder.addPointXY(20e5, 50e5);
// assign the graphics geometry to the line
lineGraphic.geometry = polylineBuilder.geometry;
// add the graphic to the polyline graphic overlay
graphicsOverlay.graphics.append(lineGraphic);
}
function addPolygonGraphic() {
// create the polygon by assigning points
polygonBuilder.addPointXY(-20e5, 20e5);
polygonBuilder.addPointXY(20e5, 20e5);
polygonBuilder.addPointXY(20e5, -20e5);
polygonBuilder.addPointXY(-20e5, -20e5);
// assign the geometry of the graphic to be the polygon
polygonGraphic.geometry = polygonBuilder.geometry;
// add the graphic to the polygon graphics overlay
graphicsOverlay.graphics.append(polygonGraphic);
}
function addEllipseGraphic() {
// Create Ellipse
ellipseGraphic.geometry = GeometryEngine.ellipseGeodesic(geodesicEllipseParameters);
graphicsOverlay.graphics.append(ellipseGraphic);
}
function addHeartGraphic() {
heartGraphic.geometry = createHeartGeometry(40e5, 5e5, 10e5, Factory.SpatialReference.createWebMercator());
graphicsOverlay.graphics.append(heartGraphic);
}
function createHeartGeometry(centerX, centerY, sideLength, sr) {
const minX = centerX - 0.5 * sideLength;
const minY = centerY - 0.5 * sideLength;
const arcRadius = sideLength * 0.25;
// Variables used for arcs
const rotationAngle = 0;
const isMinor = false;
const isCounterClockwise = false;
const semiMajorAxis = sideLength * 0.25;
const minorMajorRatio = 1;
// Bottom left curve
const leftCurveStart = rtCreate("Point", {x: centerX, y: minY, spatialReference: sr});
const leftControlPoint1 = rtCreate("Point", {x: centerX, y: minY + 0.25 * sideLength, spatialReference: sr});
const leftControlPoint2 = rtCreate("Point", {x: minX, y: centerY, spatialReference: sr});
const leftCurveEnd = rtCreate("Point", {x: minX, y: minY + 0.75 * sideLength, spatialReference: sr});
const leftCurveSegment = Factory.CubicBezierSegment.createWithPoints(
leftCurveStart, leftControlPoint1, leftControlPoint2, leftCurveEnd, sr);
// Top left arc
const leftArcStart = leftCurveEnd;
const leftArcEnd = rtCreate("Point", {x: centerX, y: minY + 0.75 * sideLength, spatialReference: sr});
const leftArc = Factory.EllipticArcSegment.createEllipticArcWithStartAndEndpoints(
leftArcStart, leftArcEnd, rotationAngle, isMinor, isCounterClockwise, semiMajorAxis, minorMajorRatio, sr);
// Top right arc
const rightArcStart = leftArcEnd;
const rightArcEnd = rtCreate("Point", {x: minX + sideLength, y: minY + 0.75 * sideLength, spatialReference: sr});
const rightArc = Factory.EllipticArcSegment.createEllipticArcWithStartAndEndpoints(
rightArcStart, rightArcEnd, rotationAngle, isMinor, isCounterClockwise, semiMajorAxis, minorMajorRatio, sr);
// Bottom right curve
const rightCurveStart = rightArcEnd;
const rightControlPoint1 = rtCreate("Point", {x: minX + sideLength, y: centerY, spatialReference: sr});
const rightControlPoint2 = leftControlPoint1;
const rightCurveEnd = leftCurveStart;
const rightCurveSegment = Factory.CubicBezierSegment.createWithPoints(
rightCurveStart, rightControlPoint1, rightControlPoint2, rightCurveEnd, sr);
// Create a part with each of the segments
const part = rtCreate("Part", {spatialReference: sr});
part.addSegment(leftCurveSegment);
part.addSegment(leftArc);
part.addSegment(rightArc);
part.addSegment(rightCurveSegment);
const polygonBuilder = rtCreate("PolygonBuilder", {spatialReference: sr});
polygonBuilder.parts.addPart(part);
return polygonBuilder.geometry;
}
}