This sample demonstrates how to use the time slider from the toolkit to visualize temporal data by applying a specific time extent. When viewing feature layers that contain a large amount of data with timestamps, you may want to filter the data to only show data relevant to a specific time range. This can help visualize changes in the data over time and aid in making better interpretations and predictions of future trends.
Use case
When viewing layers that contain a large amount of data with timestamps, you may want to filter the data to only show data relevant to a specific time range.
How to use the sample
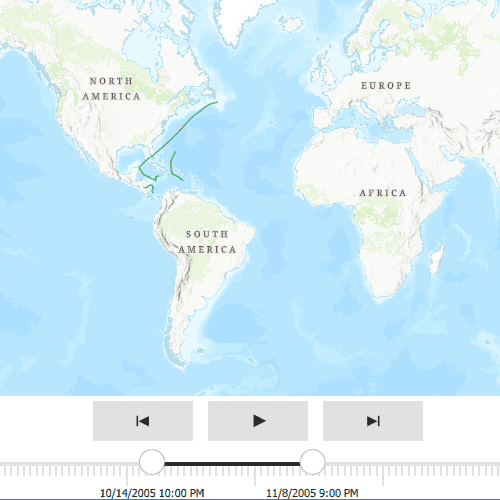
Use the slider at the bottom of the map to customize the date range for which you want to view the data. Once the start and end date have been selected, the mapview will update to only show the relevant data that falls in the time extent selected. Use the play button to step through the data one day at a time. Use the previous and next buttons to manually step through the data in one day increments.
How it works
- Create a
MapViewwith aMap. - Create a
ServiceFeatureTablefrom a URL (the feature layer from the url in this sample includes time-enabled data). - Create a feature layer from the service feature table.
- Add the feature layer that includes time-enabled data to the map's list of operational layers.
- Create a
TimeSliderfrom the ArcGIS Maps SDK for Qt Toolkit to allow users to show data only from the given date range. This sets up all necessary calls to visualize and step through the temporal data.
Relevant API
- FeatureLayer
- Map
- MapView
- ServiceFeatureTable
Additional information
This sample uses Atlantic hurricane data from the National Hurricane Center (NOAA / National Weather Service) and the TimeSlider toolkit component which requires the toolkit to be cloned and set up locally. For information about setting up the toolkit, see the repository's root README.md here.
Tags
animate, data, filter, time, time extent, time frame, toolkit
Sample Code
// [WriteFile Name=ControlTimeExtentTimeSlider, Category=Features]
// [Legal]
// Copyright 2021 Esri.
// Licensed under the Apache License, Version 2.0 (the "License");
// you may not use this file except in compliance with the License.
// You may obtain a copy of the License at
// http://www.apache.org/licenses/LICENSE-2.0
// Unless required by applicable law or agreed to in writing, software
// distributed under the License is distributed on an "AS IS" BASIS,
// WITHOUT WARRANTIES OR CONDITIONS OF ANY KIND, either express or implied.
// See the License for the specific language governing permissions and
// limitations under the License.
// [Legal]
import QtQuick
import Esri.ArcGISRuntime
import Esri.ArcGISRuntime.Toolkit
Rectangle {
id: rootRectangle
clip: true
width: 800
height: 600
MapView {
id: mapView
anchors.fill: parent
Map {
id: map
initBasemapStyle: Enums.BasemapStyleArcGISTopographic
FeatureLayer {
ServiceFeatureTable {
id: featureLayer
url: "https://services5.arcgis.com/N82JbI5EYtAkuUKU/ArcGIS/rest/services/Hurricane_time_enabled_layer_2005_1_day/FeatureServer/0"
}
}
}
// Add a TimeSlider from the toolkit to the MapView
TimeSlider {
anchors {
left: parent.left
right: parent.right
bottom: parent.bottom
}
geoView: mapView
}
}
}