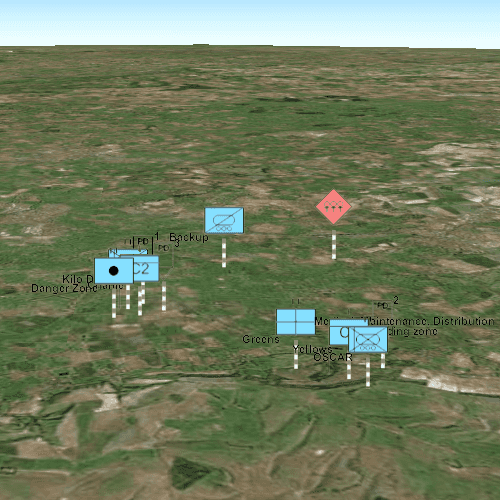
This sample demonstrates applying a dictionary renderer to a graphics overlay in a 3D scene to display military symbology.
Use case
Use a dictionary renderer on a graphics overlay to display more transient data, such as military messages coming through a local tactical network.
How to use the sample
Pan and zoom to explore military symbols on the map.
How it works
The sample loads a number of point military elements from an XML file and adds them as graphics to a GraphicsOverlay. A DictionaryRenderer is applied to the GraphicsOverlay in order to display the graphics with MIL-STD-2525D military symbology. The GraphicsOverlay's renderingMode parameter is set to GraphicsRenderingModeDynamic, so that point features are displayed with billboarded symbols facing the user (a developer can set renderingMode to GraphicsRenderingModeStatic if desired to instead drape the symbols on the surface). When all graphics are created, the 3D scene's viewpoint is set to zoom to the full extent of all graphics.
Relevant API
- DictionaryRenderer
- DictionarySymbolStyle
- GraphicsOverlay
Offline Data
To set up the sample's offline data, see the Use offline data in the samples section of the Qt Samples repository overview.
| Link | Local Location |
|---|---|
| Mil2525d Stylx File | <userhome>/ArcGIS/Runtime/Data/styles/arcade_style/mil2525d.stylx |
| MIL-STD-2525D XML Message File | <userhome>/ArcGIS/Runtime/Data/xml/arcade_style/Mil2525DMessages.xml |
About the data
The sample opens to a view of the county Wiltshire, United Kingdom. It displays military symbols illustrating a simulated combat situation in the area.
Tags
defense, military, situational awareness, tactical, visualization
Sample Code
// [WriteFile Name=GODictionaryRenderer_3D, Category=DisplayInformation]
// [Legal]
// Copyright 2016 Esri.
// Licensed under the Apache License, Version 2.0 (the "License");
// you may not use this file except in compliance with the License.
// You may obtain a copy of the License at
// http://www.apache.org/licenses/LICENSE-2.0
// Unless required by applicable law or agreed to in writing, software
// distributed under the License is distributed on an "AS IS" BASIS,
// WITHOUT WARRANTIES OR CONDITIONS OF ANY KIND, either express or implied.
// See the License for the specific language governing permissions and
// limitations under the License.
// [Legal]
import QtQuick
import QtQuick.Controls
import Esri.ArcGISRuntime
import Esri.ArcGISExtras
import Esri.samples
Rectangle {
width: 800
height: 600
readonly property url dataPath: {
Qt.platform.os === "ios" ?
System.writableLocationUrl(System.StandardPathsDocumentsLocation) + "/ArcGIS/Runtime/Data" :
System.writableLocationUrl(System.StandardPathsHomeLocation) + "/ArcGIS/Runtime/Data"
}
/*
* Create SceneView that contains a Scene with the Imagery Basemap, as well as a GraphicsOverlay
* for the military symbols.
*/
SceneView {
id: sceneView
anchors.fill: parent
Component.onCompleted: {
// Set the focus on SceneView to initially enable keyboard navigation
forceActiveFocus();
}
Scene {
id: scene
Basemap {
initStyle: Enums.BasemapStyleArcGISImageryStandard
}
Surface {
ArcGISTiledElevationSource {
url: "https://elevation3d.arcgis.com/arcgis/rest/services/WorldElevation3D/Terrain3D/ImageServer"
}
}
onLoadStatusChanged: {
if (loadStatus !== Enums.LoadStatusLoaded)
return;
// Read the XML file and create a graphic from each entry
const parsedXml = xmlParser.parseXmlFileAsync(dataPath + "/xml/arcade_style/Mil2525DMessages.xml");
// Zoom to graphics
/*
* Create a camera directly above the center of the features, and then rotate that
* camera around the center to tip it.
*/
const initialLocation = ArcGISRuntimeEnvironment.createObject("Point", {x: -2.0344707, y: 51.29712})
let camera = ArcGISRuntimeEnvironment.createObject("Camera", {
location: initialLocation,
heading: 0,
pitch: 70,
roll: 0,
distance: 15000
});
sceneView.setViewpointCameraAndWait(camera);
}
}
GraphicsOverlay {
id: graphicsOverlay
renderingMode: Enums.GraphicsRenderingModeDynamic
DictionaryRenderer {
dictionarySymbolStyle: Factory.DictionarySymbolStyle.createFromFile(dataPath + "/styles/arcade_style/mil2525d.stylx")
}
}
}
ProgressBar {
id: progressBar_loading
anchors {
horizontalCenter: parent.horizontalCenter
bottom: parent.bottom
margins: 5
}
indeterminate: true
}
XmlParser {
id: xmlParser
onXmlParseComplete: (parsedXml) => {
parsedXml.forEach(element => {createGraphicFromElement(element)});
progressBar_loading.visible = false;
}
}
function createGraphicFromElement(element) {
let wkid = element._wkid;
if (!wkid) {
// If _wkid was absent, use WGS 1984 (4326) by default.
wkid = 4326;
}
const pointStrings = element._control_points.split(";");
const sr = ArcGISRuntimeEnvironment.createObject("SpatialReference", { wkid: wkid });
let geom;
if (pointStrings.length === 1) {
// It's a point
const pointBuilder = ArcGISRuntimeEnvironment.createObject("PointBuilder");
pointBuilder.spatialReference = sr;
const coords = pointStrings[0].split(",");
pointBuilder.setXY(coords[0], coords[1]);
geom = pointBuilder.geometry;
} else {
const builder = ArcGISRuntimeEnvironment.createObject("MultipointBuilder");
builder.spatialReference = sr;
for (let ptIndex = 0; ptIndex < pointStrings.length; ptIndex++) {
const coords = pointStrings[ptIndex].split(",");
builder.points.addPointXY(coords[0], coords[1]);
}
geom = builder.geometry;
}
if (geom) {
const graphic = ArcGISRuntimeEnvironment.createObject("Graphic", { geometry: geom });
graphic.attributes.attributesJson = {
"identity": element.identity,
"symbolset": element.symbolset,
"symbolentity": element.symbolentity,
"echelon": element.echelon,
"specialentitysubtype": element.specialentitysubtype,
"indicator": element.indicator,
"modifier2": element.modifier2,
"uniquedesignation": element.uniquedesignation,
"additionalinformation": element.additionalinformation
};
graphicsOverlay.graphics.append(graphic);
}
}
}