Create a buffer around a map point and display the results as a Graphic
Use case
Creating buffers is a core concept in GIS proximity analysis that allows you to visualize and locate geographic features contained within a polygon. For example, suppose you wanted to visualize areas of your city where alcohol sales are prohibited because they are within 500 meters of a school. The first step in this proximity analysis would be to generate 500 meter buffer polygons around all schools in the city. Any such businesses you find inside one of the resulting polygons are violating the law.
How to use the sample
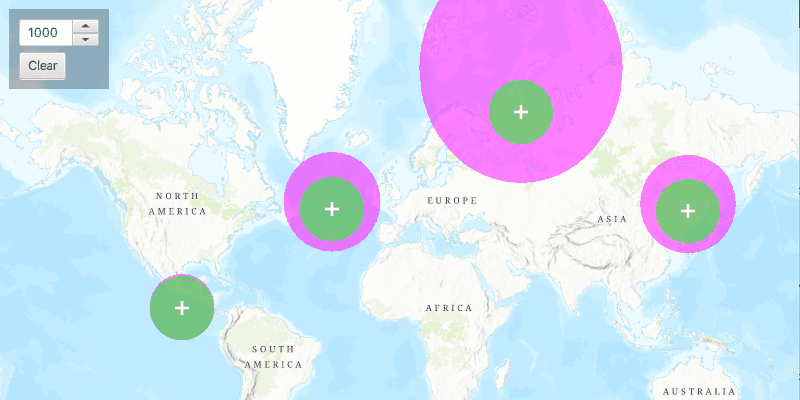
Click on the map. A planar and a geodesic buffer will be created at the click location using the distance (miles) specified in the text box. Continue clicking to create additional buffers. Notice that buffers closer to the equator appear similar in size. As you move north or south from the equator, however, the geodesic polygons become much larger. Geodesic polygons are in fact a better representation of the true shape and size of the buffer. Click "Clear" to clear the buffers from the map.
How it works
- Capture
Points when theMapViewis clicked. - Use the static method
GeometryEngine.buffer()to create a planar buffer polygon from the map location and distance. - Alternatively, use
GeometryEngine.bufferGeodetic()to create a geodesic buffer polygon using the same inputs.
Relevant API
- GeometryEngine
- GraphicsOverlay
Additional information
Buffers can be generated as either planar (flat - coordinate space of the map's spatial reference) or geodesic (technique that considers the curved shape of the Earth's surface, which is generally a more accurate representation). In general, distortion in the map increases as you move away from the standard parallels of the spatial reference's projection. This map is in Web Mercator so areas near the equator are the most accurate. As you move the buffer location north or south from that line, you'll see a greater difference in the polygon size and shape. Planar operations are generally faster, but performance improvement may only be noticeable for large operations (buffering a great number or complex geometry).
For more information about using buffer analysis, see the topic How Buffer (Analysis) works in the ArcGIS Pro documentation.
Tags
analysis, buffer, euclidean, geodesic, geometry, planar
Sample Code
/*
* Copyright 2018 Esri.
*
* Licensed under the Apache License, Version 2.0 (the "License"); you may not
* use this file except in compliance with the License. You may obtain a copy of
* the License at
*
* http://www.apache.org/licenses/LICENSE-2.0
*
* Unless required by applicable law or agreed to in writing, software
* distributed under the License is distributed on an "AS IS" BASIS, WITHOUT
* WARRANTIES OR CONDITIONS OF ANY KIND, either express or implied. See the
* License for the specific language governing permissions and limitations under
* the License.
*/
package com.esri.samples.buffer;
import java.util.Arrays;
import javafx.application.Application;
import javafx.geometry.Insets;
import javafx.geometry.Point2D;
import javafx.geometry.Pos;
import javafx.scene.Scene;
import javafx.scene.control.Button;
import javafx.scene.control.Spinner;
import javafx.scene.input.MouseButton;
import javafx.scene.layout.Background;
import javafx.scene.layout.BackgroundFill;
import javafx.scene.layout.CornerRadii;
import javafx.scene.layout.StackPane;
import javafx.scene.layout.VBox;
import javafx.scene.paint.Color;
import javafx.scene.paint.Paint;
import javafx.stage.Stage;
import com.esri.arcgisruntime.ArcGISRuntimeEnvironment;
import com.esri.arcgisruntime.geometry.GeodeticCurveType;
import com.esri.arcgisruntime.geometry.GeometryEngine;
import com.esri.arcgisruntime.geometry.LinearUnit;
import com.esri.arcgisruntime.geometry.LinearUnitId;
import com.esri.arcgisruntime.geometry.Point;
import com.esri.arcgisruntime.geometry.Polygon;
import com.esri.arcgisruntime.mapping.ArcGISMap;
import com.esri.arcgisruntime.mapping.BasemapStyle;
import com.esri.arcgisruntime.mapping.view.Graphic;
import com.esri.arcgisruntime.mapping.view.GraphicsOverlay;
import com.esri.arcgisruntime.mapping.view.MapView;
import com.esri.arcgisruntime.symbology.SimpleFillSymbol;
import com.esri.arcgisruntime.symbology.SimpleMarkerSymbol;
public class BufferSample extends Application {
private MapView mapView;
@Override
public void start(Stage stage) {
try {
// create stack pane and application scene
StackPane stackPane = new StackPane();
Scene scene = new Scene(stackPane);
// set title, size, and add scene to stage
stage.setTitle("Buffer Sample");
stage.setWidth(800);
stage.setHeight(700);
stage.setScene(scene);
stage.show();
// authentication with an API key or named user is required to access basemaps and other location services
String yourAPIKey = System.getProperty("apiKey");
ArcGISRuntimeEnvironment.setApiKey(yourAPIKey);
// create a map with the topographic basemap style
ArcGISMap map = new ArcGISMap(BasemapStyle.ARCGIS_TOPOGRAPHIC);
// create a map view and set the map to it
mapView = new MapView();
mapView.setMap(map);
// create a graphics overlay to contain the buffered geometry graphics
GraphicsOverlay graphicsOverlay = new GraphicsOverlay();
mapView.getGraphicsOverlays().add(graphicsOverlay);
// create a spinner to set the buffer size (in miles)
Spinner<Integer> bufferSpinner = new Spinner<>(500, 2000, 1000);
bufferSpinner.setEditable(true);
// set up units to convert from miles to meters
final LinearUnit miles = new LinearUnit(LinearUnitId.MILES);
final LinearUnit meters = new LinearUnit(LinearUnitId.METERS);
// create a white cross marker symbol to show where the user clicked
final SimpleMarkerSymbol markerSymbol = new SimpleMarkerSymbol(SimpleMarkerSymbol.Style.CROSS, Color.WHITE, 14);
// create a semi-transparent purple fill symbol for the geodesic buffers
final SimpleFillSymbol geodesicFillSymbol = new SimpleFillSymbol(SimpleFillSymbol.Style.SOLID,
Color.web("fuchsia", 0.5), null);
// create a semi-transparent green fill symbol for the planar buffers
final SimpleFillSymbol planarFillSymbol = new SimpleFillSymbol(SimpleFillSymbol.Style.SOLID,
Color.web("lime", 0.5), null);
// create buffers around the clicked location
mapView.setOnMouseClicked(e -> {
if (e.isStillSincePress() && e.getButton() == MouseButton.PRIMARY) {
Point2D point2D = new Point2D(e.getX(), e.getY());
// buffer around the clicked point
Point point = mapView.screenToLocation(point2D);
Polygon geodesicBufferGeometry = GeometryEngine.bufferGeodetic(point, miles.convertTo(meters, bufferSpinner.getValue()),
meters, Double.NaN, GeodeticCurveType.GEODESIC);
Polygon planarBufferGeometry = GeometryEngine.buffer(point, miles.convertTo(meters, bufferSpinner.getValue()));
// show the buffered regions
Graphic geodesicBufferGraphic = new Graphic(geodesicBufferGeometry, geodesicFillSymbol);
Graphic planarBufferGraphic = new Graphic(planarBufferGeometry, planarFillSymbol);
graphicsOverlay.getGraphics().addAll(Arrays.asList(geodesicBufferGraphic, planarBufferGraphic));
// show a white marker where clicked
Graphic markerGraphic = new Graphic(point, markerSymbol);
graphicsOverlay.getGraphics().add(markerGraphic);
// set the z index of each graphic so they display in the correct order
geodesicBufferGraphic.setZIndex(0);
planarBufferGraphic.setZIndex(1);
markerGraphic.setZIndex(2);
}
});
// create a button to clear graphics
Button clearButton = new Button("Clear");
// clear the graphics overlay when the clear button is clicked
clearButton.setOnMouseClicked(event -> graphicsOverlay.getGraphics().clear());
// create a vbox that contains the spinner and clear button
VBox controlsVBox = new VBox(6);
controlsVBox.setBackground(new Background(new BackgroundFill(Paint.valueOf("rgba(0,0,0,0.3)"), CornerRadii.EMPTY,
Insets.EMPTY)));
controlsVBox.setPadding(new Insets(10.0));
controlsVBox.setMaxSize(100, 75);
controlsVBox.getChildren().addAll(bufferSpinner, clearButton);
// add the map view and vbox to the stack pane
stackPane.getChildren().addAll(mapView, controlsVBox);
StackPane.setAlignment(controlsVBox, Pos.TOP_LEFT);
StackPane.setMargin(controlsVBox, new Insets(10, 0, 0, 10));
} catch (Exception e) {
// on any error, display the stack trace.
e.printStackTrace();
}
}
/**
* Stops and releases all resources used in application.
*/
@Override
public void stop() {
if (mapView != null) {
mapView.dispose();
}
}
/**
* Opens and runs application.
*
* @param args arguments passed to this application
*/
public static void main(String[] args) {
Application.launch(args);
}
}