Displays a composite layer of all the subtype values in a feature class.
Use case
This is useful for controlling labeling, visibility and symbology of a given subtype as though they are distinct layers on the map.
How to use the sample
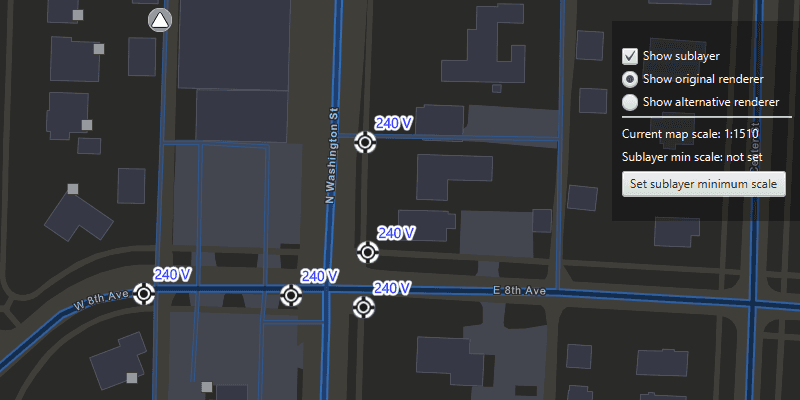
The sample loads with the sublayer visible on the map. Toggle its visibility with the "Show sublayer" checkbox. Change the sublayer's renderer with the radio buttons, using "Show original renderer" or "Show alternative renderer", and set its minimum scale using the "Set sublayer minimum scale" button. This will set the sublayer's minimum scale to that of the current map scale. Zoom in and out to see the sublayer become visible based on its new scale range.
How it works
- Create a
SubtypeFeatureLayerfrom aServiceFeatureTablethat defines a subtype, and add it to theArcGISMap. - Get a
SubtypeSublayerfrom the subtype feature using its name. - Enable the sublayer's labels and define them with a
LabelDefinition. - Set the visibility status using this sublayer's
IsVisibleproperty. - Change the sublayer's symbology with
.setRenderer(Renderer). - Update the sublayer's minimum scale value with
.setMinScale().
Relevant API
- LabelDefinition
- ServiceFeatureTable
- SimpleLabelExpression
- SubtypeFeatureLayer
- SubtypeSublayer
About the data
The feature service layer in this sample represents an electric network in Naperville, Illinois, which contains a utility network with asset classification for different devices.
Tags
asset group, feature layer, labeling, sublayer, subtype, symbology, utility network, visible scale range
Sample Code
/*
* Copyright 2019 Esri.
*
* Licensed under the Apache License, Version 2.0 (the "License"); you may not
* use this file except in compliance with the License. You may obtain a copy of
* the License at
*
* http://www.apache.org/licenses/LICENSE-2.0
*
* Unless required by applicable law or agreed to in writing, software
* distributed under the License is distributed on an "AS IS" BASIS, WITHOUT
* WARRANTIES OR CONDITIONS OF ANY KIND, either express or implied. See the
* License for the specific language governing permissions and limitations under
* the License.
*/
package com.esri.samples.display_subtype_feature_layer;
import javafx.beans.binding.Bindings;
import javafx.fxml.FXML;
import javafx.scene.control.Alert;
import javafx.scene.control.CheckBox;
import javafx.scene.control.Label;
import javafx.scene.layout.VBox;
import javafx.scene.paint.Color;
import com.esri.arcgisruntime.ArcGISRuntimeEnvironment;
import com.esri.arcgisruntime.arcgisservices.LabelDefinition;
import com.esri.arcgisruntime.arcgisservices.LabelingPlacement;
import com.esri.arcgisruntime.data.ServiceFeatureTable;
import com.esri.arcgisruntime.geometry.Envelope;
import com.esri.arcgisruntime.geometry.SpatialReferences;
import com.esri.arcgisruntime.layers.SubtypeFeatureLayer;
import com.esri.arcgisruntime.layers.SubtypeSublayer;
import com.esri.arcgisruntime.loadable.LoadStatus;
import com.esri.arcgisruntime.mapping.ArcGISMap;
import com.esri.arcgisruntime.mapping.BasemapStyle;
import com.esri.arcgisruntime.mapping.labeling.SimpleLabelExpression;
import com.esri.arcgisruntime.mapping.Viewpoint;
import com.esri.arcgisruntime.mapping.view.MapView;
import com.esri.arcgisruntime.security.UserCredential;
import com.esri.arcgisruntime.symbology.Renderer;
import com.esri.arcgisruntime.symbology.SimpleMarkerSymbol;
import com.esri.arcgisruntime.symbology.SimpleRenderer;
import com.esri.arcgisruntime.symbology.Symbol;
import com.esri.arcgisruntime.symbology.TextSymbol;
public class DisplaySubtypeFeatureLayerController {
@FXML private MapView mapView;
@FXML private Label currentMapScaleLabel;
@FXML private Label minScaleLabel;
@FXML private CheckBox sublayerVisibilityCheckbox;
@FXML private VBox vBox;
private Renderer originalRenderer;
private Renderer alternativeRenderer;
private SubtypeSublayer sublayer;
public void initialize() {
try {
// authentication with an API key or named user is required to access basemaps and other location services
String yourAPIKey = System.getProperty("apiKey");
ArcGISRuntimeEnvironment.setApiKey(yourAPIKey);
// create a map with the streets night basemap style and add it to the map view
ArcGISMap map = new ArcGISMap(BasemapStyle.ARCGIS_STREETS_NIGHT);
mapView.setMap(map);
// display the current map scale
currentMapScaleLabel.textProperty().bind(Bindings.createStringBinding(() -> {
return "Current map scale: 1:" + Math.round(mapView.mapScaleProperty().get());
}, mapView.mapScaleProperty()));
// set a viewpoint on the map view, to Naperville, Illinois
Viewpoint initialViewpoint = new Viewpoint(new Envelope(-9812691.11079696, 5128687.20710657,
-9812377.9447607, 5128865.36767282, SpatialReferences.getWebMercator()));
mapView.setViewpoint(initialViewpoint);
// create a subtype feature layer from the service feature table, and add it to the map
ServiceFeatureTable serviceFeatureTable = new ServiceFeatureTable(
"https://sampleserver7.arcgisonline.com/server/rest/services/UtilityNetwork/NapervilleElectric/FeatureServer/0");
// set user credentials to authenticate with the service
UserCredential userCredential = new UserCredential("viewer01", "I68VGU^nMurF");
serviceFeatureTable.setCredential(userCredential);
SubtypeFeatureLayer subtypeFeatureLayer = new SubtypeFeatureLayer(serviceFeatureTable);
map.getOperationalLayers().add(subtypeFeatureLayer);
// create a text symbol for styling the sublayer label definition
var textSymbol = new TextSymbol();
textSymbol.setSize(12);
textSymbol.setOutlineColor(Color.WHITE);
textSymbol.setColor(Color.BLUE);
textSymbol.setHaloColor(Color.WHITE);
textSymbol.setHaloWidth(3);
// create a label definition with a simple label expression
var simpleLabelExpression = new SimpleLabelExpression("[nominalvoltage]");
var labelDefinition = new LabelDefinition(simpleLabelExpression, textSymbol);
labelDefinition.setPlacement(LabelingPlacement.POINT_ABOVE_RIGHT);
labelDefinition.setUseCodedValues(true);
// load the subtype feature layer
subtypeFeatureLayer.loadAsync();
subtypeFeatureLayer.addDoneLoadingListener(() -> {
if (subtypeFeatureLayer.getLoadStatus() == LoadStatus.LOADED) {
// show the UI for interaction with the sublayer once it has loaded
vBox.setVisible(true);
// get the Street Light sublayer and define its labels
sublayer = subtypeFeatureLayer.getSublayerWithSubtypeName("Street Light");
sublayer.setLabelsEnabled(true);
sublayer.getLabelDefinitions().add(labelDefinition);
// get the original renderer of the sublayer (white and black circular icon)
originalRenderer = sublayer.getRenderer();
// create a custom renderer for the sublayer (light pink diamond symbol)
Symbol symbol = new SimpleMarkerSymbol(SimpleMarkerSymbol.Style.DIAMOND, Color.LIGHTPINK, 20);
alternativeRenderer = new SimpleRenderer(symbol);
} else {
new Alert(Alert.AlertType.ERROR, "Failed to load feature layer").show();
}
});
} catch (Exception e) {
// on any error, display the stack trace.
e.printStackTrace();
}
}
/**
* Sets the minimum scale of the labels for the sublayer.
*/
@FXML
private void handleMinScaleButtonClicked() {
sublayer.setMinScale(mapView.getMapScale());
minScaleLabel.setText("Sublayer min scale: 1:" + Math.round(sublayer.getMinScale()));
}
/**
* Sets the visibility of the sublayer.
*/
@FXML
private void handleSublayerVisibility() {
sublayer.setVisible(sublayerVisibilityCheckbox.isSelected());
}
/**
* Sets the renderer of the sublayer to its original format (a white and black circular icon).
*/
@FXML
private void handleOriginalRendererButtonClicked() {
sublayer.setRenderer(originalRenderer);
}
/**
* Sets the renderer of the sublayer to that of a pink diamond symbol.
*/
@FXML
private void handleAlternativeRendererButtonClicked() {
sublayer.setRenderer(alternativeRenderer);
}
/**
* Disposes application resources.
*/
void terminate() {
if (mapView != null) {
mapView.dispose();
}
}
}