Apply a renderer to a sublayer.
Use case
A layer showing animal populations contains sublayers for different species. A renderer could be applied which gives each sublayer a different color, so that populations of each species can be compared visually.
How to use the sample
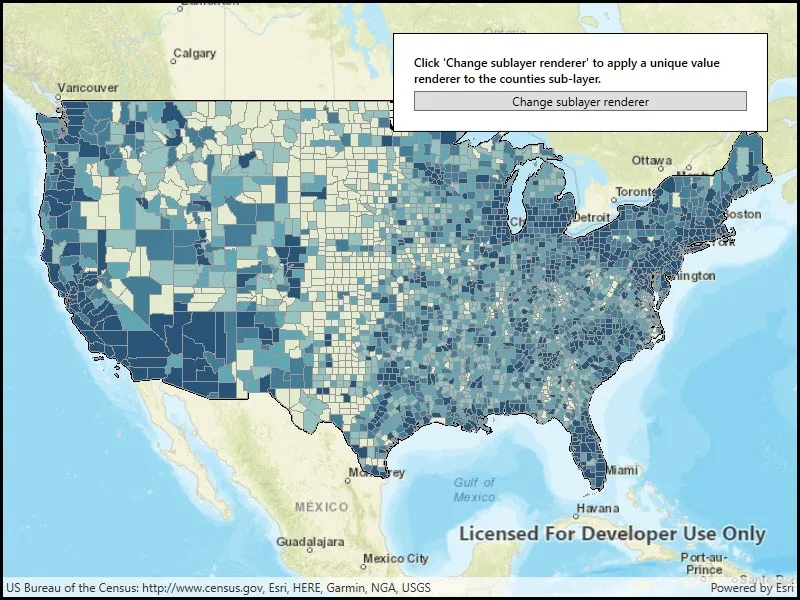
Wait for the map image layer to load. Click the button to apply a unique value renderer to see different population ranges in the counties sub-layer data.
How it works
- Create an
ArcGISMapImageLayerfrom its URL. - After it is done loading, get its
SublayerListwithimageLayer.Sublayers. - Cast the sublayer you want to change to the appropriate type:
(ArcGISMapImageSublayer) sublayers[0]. - Create a
ClassBreaksRendererwith a collection ofClassBreaks for different population ranges. - Set the renderer of the sublayer with
sublayer.Renderer = renderer.
Relevant API
- ArcGISMapImageLayer
- ArcGISMapImageSubLayer
- ClassBreaksRenderer
- ClassBreaksRenderer.ClassBreak
About the data
This application displays census data from an ArcGIS Server map service. It contains various population statistics, including total population for each county in 2007.
Additional information
The service hosting the layer must support dynamic layers to be able to change the rendering of sublayers.
Tags
class breaks, dynamic layer, dynamic rendering, renderer, sublayer, symbology, visualization
Sample code
// Copyright 2018 Esri.//// Licensed under the Apache License, Version 2.0 (the "License"); you may not use this file except in compliance with the License.// You may obtain a copy of the License at: http://www.apache.org/licenses/LICENSE-2.0//// Unless required by applicable law or agreed to in writing, software distributed under the License is distributed on an// "AS IS" BASIS, WITHOUT WARRANTIES OR CONDITIONS OF ANY KIND, either express or implied. See the License for the specific// language governing permissions and limitations under the License.
using Esri.ArcGISRuntime.Geometry;using Esri.ArcGISRuntime.Mapping;using Esri.ArcGISRuntime.Symbology;using System.Collections.Generic;using System.Drawing;using System.Windows;
namespace ArcGIS.WPF.Samples.ChangeSublayerRenderer{    [ArcGIS.Samples.Shared.Attributes.Sample(        name: "Change sublayer renderer",        category: "Layers",        description: "Apply a renderer to a sublayer.",        instructions: "Wait for the map image layer to load. Click the button to apply a unique value renderer to see different population ranges in the counties sub-layer data.",        tags: new[] { "class breaks", "dynamic layer", "dynamic rendering", "renderer", "sublayer", "symbology", "visualization" })]    public partial class ChangeSublayerRenderer    {        // ArcGIS map image layer that contains four Census sub-layers.        private ArcGISMapImageLayer _arcGISMapImageLayer;
        public ChangeSublayerRenderer()        {            InitializeComponent();
            // Load the initial datasets in the map.            Initialize();        }
        private void Initialize()        {            // Create a new map based on the streets base map.            Map newMap = new Map(BasemapStyle.ArcGISStreets);
            // Create an envelope that covers the continental US in the web Mercator spatial reference.            Envelope continentalUSEnvelope = new Envelope(-14193469.5655232, 2509617.28647268, -7228772.04749191, 6737139.97573925, SpatialReferences.WebMercator);
            // Zoom the map to the extent of the envelope.            newMap.InitialViewpoint = new Viewpoint(continentalUSEnvelope);
            // Assign the map to the MapView.            MyMapView.Map = newMap;
            // Create an ArcGIS map image layer based on the Uri to that points to an ArcGIS Server map service that contains four Census sub-layers.            // NOTE: sub-layer[0] = Census Block Points, sub-layer[1] = Census Block Group, sub-layer[3] = Counties, sub-layer[3] = States.            _arcGISMapImageLayer = new ArcGISMapImageLayer(new System.Uri("https://sampleserver6.arcgisonline.com/arcgis/rest/services/Census/MapServer"));
            // Add the ArcGIS map image layer to the map's operation layers collection.            newMap.OperationalLayers.Add(_arcGISMapImageLayer);        }
        private ClassBreaksRenderer CreateClassBreaksRenderer()        {            // Define the colors that will be used by the unique value renderer.            Color gray = Color.FromArgb(255, 153, 153, 153);            Color blue1 = Color.FromArgb(255, 227, 235, 207);            Color blue2 = Color.FromArgb(255, 150, 194, 191);            Color blue3 = Color.FromArgb(255, 97, 166, 181);            Color blue4 = Color.FromArgb(255, 69, 125, 150);            Color blue5 = Color.FromArgb(255, 41, 84, 120);
            // Create a gray outline and five fill symbols with different shades of blue.            SimpleLineSymbol outlineSimpleLineSymbol = new SimpleLineSymbol(SimpleLineSymbolStyle.Solid, gray, 1);            SimpleFillSymbol simpleFileSymbol1 = new SimpleFillSymbol(SimpleFillSymbolStyle.Solid, blue1, outlineSimpleLineSymbol);            SimpleFillSymbol simpleFileSymbol2 = new SimpleFillSymbol(SimpleFillSymbolStyle.Solid, blue2, outlineSimpleLineSymbol);            SimpleFillSymbol simpleFileSymbol3 = new SimpleFillSymbol(SimpleFillSymbolStyle.Solid, blue3, outlineSimpleLineSymbol);            SimpleFillSymbol simpleFileSymbol4 = new SimpleFillSymbol(SimpleFillSymbolStyle.Solid, blue4, outlineSimpleLineSymbol);            SimpleFillSymbol simpleFileSymbol5 = new SimpleFillSymbol(SimpleFillSymbolStyle.Solid, blue5, outlineSimpleLineSymbol);
            // Create a list of five class breaks for different population ranges.            List<ClassBreak> listClassBreaks = new List<ClassBreak>            {                new ClassBreak("-99 to 8560", "-99 to 8560", -99, 8560, simpleFileSymbol1),                new ClassBreak("> 8,560 to 18,109", "> 8,560 to 18,109", 8560, 18109, simpleFileSymbol2),                new ClassBreak("> 18,109 to 35,501", "> 18,109 to 35,501", 18109, 35501, simpleFileSymbol3),                new ClassBreak("> 35,501 to 86,100", "> 35,501 to 86,100", 35501, 86100, simpleFileSymbol4),                new ClassBreak("> 86,100 to 10,110,975", "> 86,100 to 10,110,975", 86100, 10110975, simpleFileSymbol5)            };
            // Create and return the a class break renderer for use with the POP2007 field in the counties sub-layer.            return new ClassBreaksRenderer("POP2007", listClassBreaks);        }
        private void ChangeSublayerRendererButton_Click(object sender, RoutedEventArgs e)        {            // Get the counties sub-layer (the 3rd layer) from the ArcGIS map image layer.            ArcGISMapImageSublayer countiesArcGISMapImageSubLayer = (ArcGISMapImageSublayer)_arcGISMapImageLayer.Sublayers[2];
            // Set the renderer of the ArcGIS map image sub-layer to a class break renderer based on population.            countiesArcGISMapImageSubLayer.Renderer = CreateClassBreaksRenderer();
// Disable the button after has been used. ChangeSublayerRendererButton.IsEnabled = false; } }}<UserControl x:Class="ArcGIS.WPF.Samples.ChangeSublayerRenderer.ChangeSublayerRenderer" xmlns="http://schemas.microsoft.com/winfx/2006/xaml/presentation" xmlns:x="http://schemas.microsoft.com/winfx/2006/xaml" xmlns:esri="http://schemas.esri.com/arcgis/runtime/2013"> <Grid> <esri:MapView x:Name="MyMapView" /> <Border Style="{StaticResource BorderStyle}"> <StackPanel> <TextBlock x:Name="ChangeSublayerRendererInstructionsLabel" Margin="0,0,0,5" FontWeight="SemiBold" Text="Click 'Change sublayer renderer' to apply a unique value renderer to the counties sub-layer." TextWrapping="Wrap" /> <Button x:Name="ChangeSublayerRendererButton" Click="ChangeSublayerRendererButton_Click" Content="Change sublayer renderer" /> </StackPanel> </Border> </Grid></UserControl>