Create a buffer around a map point and display the results as a Graphic
Use case
Creating buffers is a core concept in GIS proximity analysis that allows you to visualize and locate geographic features contained within a polygon. For example, suppose you wanted to visualize areas of your city where alcohol sales are prohibited because they are within 500 meters of a school. The first step in this proximity analysis would be to generate 500 meter buffer polygons around all schools in the city. Any such businesses you find inside one of the resulting polygons are violating the law.
How to use the sample
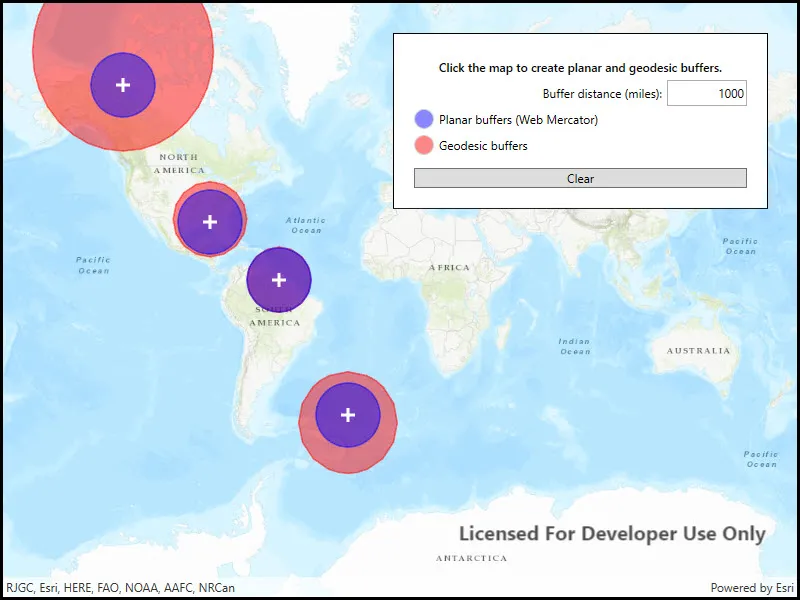
- Tap on the map.
- A planar and a geodesic buffer will be created at the tap location using the distance (miles) specified in the text box.
- Continue tapping to create additional buffers. Notice that buffers closer to the equator appear similar in size. As you move north or south from the equator, however, the geodesic polygons become much larger. Geodesic polygons are in fact a better representation of the true shape and size of the buffer. Geodesic buffers will not be generated for points placed beyond +/-90 degrees latitude.
- Click
Clearto remove all buffers and start again.
How it works
- The
MapPointfor a tap on the display is captured. - The static extension method
GeometryEngine.Bufferis called to create a planar buffer polygon from the map location and distance. - Another static extension method,
GeometryEngine.BufferGeodeticis called to create a geodesic buffer polygon using the same inputs. - The polygon results (and tap location) are displayed in the map view with different symbols in order to highlight the difference between the buffer techniques due to the spatial reference used in the planar calculation.
Relevant API
- GeometryEngine.Buffer
- GeometryEngine.BufferGeodetic
- GraphicsOverlay
Additional information
Buffers can be generated as either planar (flat - coordinate space of the map’s spatial reference) or geodesic (technique that considers the curved shape of the Earth’s surface, which is generally a more accurate representation). In general, distortion in the map increases as you move away from the standard parallels of the spatial reference’s projection. This map is in Web Mercator so areas near the equator are the most accurate. As you move the buffer location north or south from that line, you’ll see a greater difference in the polygon size and shape. Planar operations are generally faster, but performance improvement may only be noticeable for large operations (buffering a great number or complex geometry).
Geodesic buffers in the far northern and southern regions of the map will extend beyond the map’s limits. The visible extent of the basemap in this sample is limited to between approximately +/-85 degrees latitude while geodesic buffers are calculated to extend all the way to the poles (+/-90 degrees). Also, since map view wraparound is active, geodesic buffers that cross the international date line (180 degrees longitude) will be normalized, resulting in a multipart geometry. This results in a vertical line in the buffer graphic at the dateline.
For more information about using buffer analysis, see the topic How Buffer (Analysis) works in the ArcGIS Pro documentation.
Tags
analysis, buffer, euclidean, geodesic, geometry, planar
Sample code
// Copyright 2018 Esri.//// Licensed under the Apache License, Version 2.0 (the "License"); you may not use this file except in compliance with the License.// You may obtain a copy of the License at: http://www.apache.org/licenses/LICENSE-2.0//// Unless required by applicable law or agreed to in writing, software distributed under the License is distributed on an// "AS IS" BASIS, WITHOUT WARRANTIES OR CONDITIONS OF ANY KIND, either express or implied. See the License for the specific// language governing permissions and limitations under the License.
using Esri.ArcGISRuntime.Geometry;using Esri.ArcGISRuntime.Mapping;using Esri.ArcGISRuntime.Symbology;using Esri.ArcGISRuntime.UI;using System.Drawing;using System.Windows;
namespace ArcGIS.WPF.Samples.Buffer{    [ArcGIS.Samples.Shared.Attributes.Sample(        name: "Buffer",        category: "Geometry",        description: "Create a buffer around a map point and display the results as a `Graphic`",        instructions: "1. Tap on the map.",        tags: new[] { "analysis", "buffer", "euclidean", "geodesic", "geometry", "planar" })]    public partial class Buffer    {        public Buffer()        {            InitializeComponent();
            // Initialize the map and graphics overlays.            Initialize();        }
        private void Initialize()        {            // Create a map with a topographic basemap and add it to the map view.            MyMapView.Map = new Map(BasemapStyle.ArcGISTopographic);
            // Handle the MapView's GeoViewTapped event to create buffers.            MyMapView.GeoViewTapped += MyMapView_GeoViewTapped;
            // Create a fill symbol for geodesic buffer polygons.            Color geodesicBufferColor = Color.FromArgb(120, 255, 0, 0);            SimpleLineSymbol geodesicOutlineSymbol = new SimpleLineSymbol(SimpleLineSymbolStyle.Solid, geodesicBufferColor, 2);            SimpleFillSymbol geodesicBufferFillSymbol = new SimpleFillSymbol(SimpleFillSymbolStyle.Solid, geodesicBufferColor, geodesicOutlineSymbol);
            // Create a fill symbol for planar buffer polygons.            Color planarBufferColor = Color.FromArgb(120, 0, 0, 255);            SimpleLineSymbol planarOutlineSymbol = new SimpleLineSymbol(SimpleLineSymbolStyle.Solid, planarBufferColor, 2);            SimpleFillSymbol planarBufferFillSymbol = new SimpleFillSymbol(SimpleFillSymbolStyle.Solid, planarBufferColor, planarOutlineSymbol);
            // Create a marker symbol for tap locations.            SimpleMarkerSymbol tapSymbol = new SimpleMarkerSymbol(SimpleMarkerSymbolStyle.Cross, Color.White, 14);
            // Create a graphics overlay to display geodesic polygons, set its renderer and add it to the map view.            GraphicsOverlay geodesicPolysOverlay = new GraphicsOverlay            {                Id = "GeodesicPolys",                Renderer = new SimpleRenderer(geodesicBufferFillSymbol)            };            MyMapView.GraphicsOverlays.Add(geodesicPolysOverlay);
            // Create a graphics overlay to display planar polygons, set its renderer and add it to the map view.            GraphicsOverlay planarPolysOverlay = new GraphicsOverlay            {                Id = "PlanarPolys",                Renderer = new SimpleRenderer(planarBufferFillSymbol)            };            MyMapView.GraphicsOverlays.Add(planarPolysOverlay);
            // Create a graphics overlay to display tap locations for buffers, set its renderer and add it to the map view.            GraphicsOverlay tapLocationsOverlay = new GraphicsOverlay            {                Id = "TapPoints",                Renderer = new SimpleRenderer(tapSymbol)            };            MyMapView.GraphicsOverlays.Add(tapLocationsOverlay);
            // Show the colors for each type of buffer in the UI.            ShowBufferSwatches(planarBufferColor, geodesicBufferColor);        }
        private void MyMapView_GeoViewTapped(object sender, Esri.ArcGISRuntime.UI.Controls.GeoViewInputEventArgs e)        {            try            {                // Get the location tapped by the user (a map point in the WebMercator projected coordinate system).                MapPoint userTapPoint = e.Location;
                // Get the buffer distance (miles) entered in the text box.                double bufferInMiles = System.Convert.ToDouble(BufferDistanceMilesTextBox.Text);
                // Call a helper method to convert the input distance to meters.                double bufferInMeters = LinearUnits.Miles.ToMeters(bufferInMiles);
                // Create a planar buffer graphic around the input location at the specified distance.                Geometry bufferGeometryPlanar = userTapPoint.Buffer(bufferInMeters);                Graphic planarBufferGraphic = new Graphic(bufferGeometryPlanar);
                // Create a geodesic buffer graphic using the same location and distance.                Geometry bufferGeometryGeodesic = userTapPoint.BufferGeodetic(bufferInMeters, LinearUnits.Meters, double.NaN, GeodeticCurveType.Geodesic);                Graphic geodesicBufferGraphic = new Graphic(bufferGeometryGeodesic);
                // Create a graphic for the user tap location.                Graphic locationGraphic = new Graphic(userTapPoint);
                // Get the graphics overlays.                GraphicsOverlay planarBufferGraphicsOverlay = MyMapView.GraphicsOverlays["PlanarPolys"];                GraphicsOverlay geodesicBufferGraphicsOverlay = MyMapView.GraphicsOverlays["GeodesicPolys"];                GraphicsOverlay tapPointGraphicsOverlay = MyMapView.GraphicsOverlays["TapPoints"];
                // Add the buffer polygons and tap location graphics to the appropriate graphic overlays.                planarBufferGraphicsOverlay.Graphics.Add(planarBufferGraphic);                geodesicBufferGraphicsOverlay.Graphics.Add(geodesicBufferGraphic);                tapPointGraphicsOverlay.Graphics.Add(locationGraphic);            }            catch (System.Exception ex)            {                // Display an error message if there is a problem generating the buffers.                MessageBox.Show(ex.Message, "Error creating buffers");            }        }
        private void ShowBufferSwatches(Color planarBufferColor, Color geodesicBufferColor)        {            // Create an equivalent System.Windows.Media.Color for each of the buffer symbol colors (System.Drawing.Color).            System.Windows.Media.Color planarLabelColor = System.Windows.Media.Color.FromArgb(                planarBufferColor.A,                planarBufferColor.R,                planarBufferColor.G,                planarBufferColor.B);            System.Windows.Media.Color geodesicLabelColor = System.Windows.Media.Color.FromArgb(                geodesicBufferColor.A,                geodesicBufferColor.R,                geodesicBufferColor.G,                geodesicBufferColor.B);
            // Show buffer symbol colors in the UI by setting the appropriate Ellipse object fill color.            BufferSwatchPlanarEllipse.Fill = new System.Windows.Media.SolidColorBrush(planarLabelColor);            BufferSwatchGeodesicEllipse.Fill = new System.Windows.Media.SolidColorBrush(geodesicLabelColor);        }
private void ClearBuffersButton_Click(object sender, RoutedEventArgs e) { // Clear the buffer and point graphics. foreach (GraphicsOverlay ov in MyMapView.GraphicsOverlays) { ov.Graphics.Clear(); } } }}<UserControl x:Class="ArcGIS.WPF.Samples.Buffer.Buffer" xmlns="http://schemas.microsoft.com/winfx/2006/xaml/presentation" xmlns:x="http://schemas.microsoft.com/winfx/2006/xaml" xmlns:esri="http://schemas.esri.com/arcgis/runtime/2013"> <Grid> <esri:MapView x:Name="MyMapView" /> <Border Style="{StaticResource BorderStyle}"> <Grid> <Grid.RowDefinitions> <RowDefinition Height="Auto" /> <RowDefinition Height="Auto" /> <RowDefinition Height="Auto" /> <RowDefinition Height="Auto" /> <RowDefinition Height="Auto" /> </Grid.RowDefinitions> <Grid.ColumnDefinitions> <ColumnDefinition Width="Auto" /> <ColumnDefinition /> <ColumnDefinition Width="Auto" /> </Grid.ColumnDefinitions> <Label Grid.Row="0" Grid.Column="0" Grid.ColumnSpan="3" HorizontalContentAlignment="Center" Content="Click the map to create planar and geodesic buffers." FontWeight="SemiBold" /> <Label Grid.Row="1" Grid.Column="0" Grid.ColumnSpan="2" HorizontalAlignment="Right" Content="Buffer distance (miles):" /> <TextBox x:Name="BufferDistanceMilesTextBox" Grid.Row="1" Grid.Column="2" MinWidth="80" VerticalContentAlignment="Center" Text="1000" TextAlignment="Right" /> <Ellipse x:Name="BufferSwatchPlanarEllipse" Grid.Row="2" Grid.Column="0" Width="20" Height="20" Stroke="LightGray" /> <Label Grid.Row="2" Grid.Column="1" HorizontalAlignment="Left" Content="Planar buffers (Web Mercator)" /> <Ellipse x:Name="BufferSwatchGeodesicEllipse" Grid.Row="3" Grid.Column="0" Width="20" Height="20" Stroke="LightGray" /> <Label Grid.Row="3" Grid.Column="1" HorizontalAlignment="Left" Content="Geodesic buffers" /> <Button x:Name="ClearBuffersButton" Grid.Row="4" Grid.Column="0" Grid.ColumnSpan="3" Margin="0,10,0,0" Click="ClearBuffersButton_Click" Content="Clear" /> </Grid> </Border> </Grid></UserControl>