Displays a composite layer of all the subtype values in a feature class.
Use case
This is useful for controlling labeling, visibility, and symbology of a given subtype as though they are distinct layers on the map.
How to use the sample
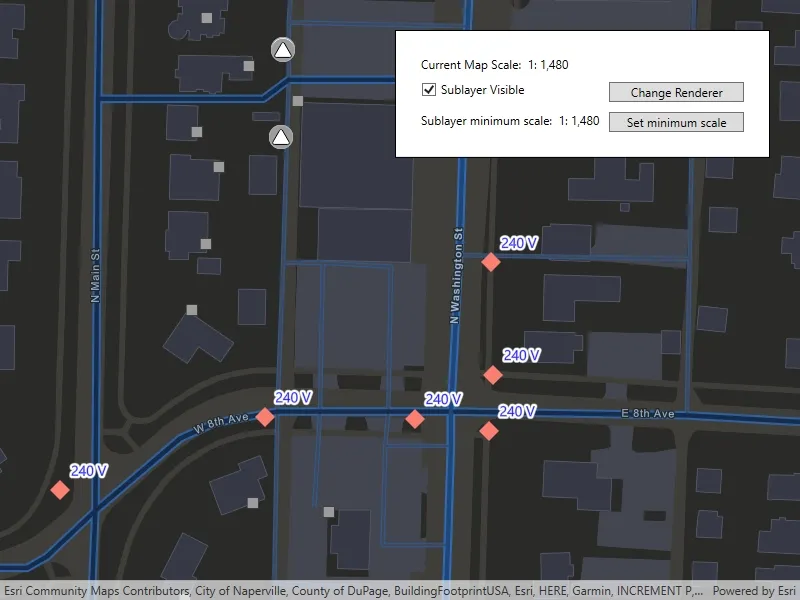
The sample loads with the sublayer visible on the map. Change the sublayer’s visibiliy, renderer, and minimum scale using the on screen controls. Setting the minimum scale will change its value to that of the current map scale. Zoom in and out to see the sublayer become visible based on its new scale range.
How it works
- Create a
SubtypeFeatureLayerfrom aServiceFeatureTablethat defines a subtype, and add it to theMap. - Get a
SubtypeSublayerfrom the subtype feature using its name. - Enable the sublayer’s labels and define them with a
LabelDefinition. - Set the visibility status using this sublayer’s
IsVisibleproperty. - Change the sublayer’s symbology using this sublayer’s
Rendererproperty. - Update the sublayer’s minimum scale value using the using the mapview’s current scale.
Relevant API
- LabelDefinition
- ServiceFeatureTable
- SimpleLabelExpression
- SubtypeFeatureLayer
- SubtypeSublayer
About the data
The feature service layer in this sample represents an electric network in Naperville, Illinois, which contains a utility network with asset classification for different devices.
Additional information
Using utility network on ArcGIS Enterprise 10.8 requires an ArcGIS Enterprise member account licensed with the Utility Network user type extension. Please refer to the utility network services documentation.
Tags
asset group, feature layer, labeling, sublayer, subtype, symbology, utility network, visible scale range
Sample code
// Copyright 2021 Esri.//// Licensed under the Apache License, Version 2.0 (the "License"); you may not use this file except in compliance with the License.// You may obtain a copy of the License at: http://www.apache.org/licenses/LICENSE-2.0//// Unless required by applicable law or agreed to in writing, software distributed under the License is distributed on an// "AS IS" BASIS, WITHOUT WARRANTIES OR CONDITIONS OF ANY KIND, either express or implied. See the License for the specific// language governing permissions and limitations under the License.
using Esri.ArcGISRuntime.Data;using Esri.ArcGISRuntime.Geometry;using Esri.ArcGISRuntime.Mapping;using Esri.ArcGISRuntime.Mapping.Labeling;using Esri.ArcGISRuntime.Security;using Esri.ArcGISRuntime.Symbology;using System;using System.Diagnostics;using System.Drawing;using System.Threading.Tasks;using System.Windows;
namespace ArcGIS.WPF.Samples.DisplaySubtypeFeatureLayer{    [ArcGIS.Samples.Shared.Attributes.Sample(        name: "Display subtype feature layer",        category: "Layers",        description: "Displays a composite layer of all the subtype values in a feature class.",        instructions: "The sample loads with the sublayer visible on the map. Change the sublayer's visibiliy, renderer, and minimum scale using the on screen controls. Setting the minimum scale will change its value to that of the current map scale. Zoom in and out to see the sublayer become visible based on its new scale range.",        tags: new[] { "asset group", "feature layer", "labeling", "sublayer", "subtype", "symbology", "utility network", "visible scale range" })]    public partial class DisplaySubtypeFeatureLayer    {        // Reference to a sublayer.        private SubtypeSublayer _sublayer;
        // Renderers for the sublayer.        private Renderer _defaultRenderer;        private Renderer _customRenderer;
        public DisplaySubtypeFeatureLayer()        {            InitializeComponent();            _ = Initialize();        }
        private async Task Initialize()        {            // As of ArcGIS Enterprise 10.8.1, using utility network functionality requires a licensed user. The following login for the sample server is licensed to perform utility network operations.            AuthenticationManager.Current.ChallengeHandler = new ChallengeHandler(async (info) =>            {                try                {                    // WARNING: Never hardcode login information in a production application. This is done solely for the sake of the sample.                    string sampleServer7User = "viewer01";                    string sampleServer7Pass = "I68VGU^nMurF";                    return await AccessTokenCredential.CreateAsync(info.ServiceUri, sampleServer7User, sampleServer7Pass);                }                catch (Exception ex)                {                    Debug.WriteLine(ex.Message);                    return null;                }            });
            try            {                // Starting viewpoint for the map view.                Viewpoint _startingViewpoint = new Viewpoint(new Envelope(-9812691.11079696, 5128687.20710657, -9812377.9447607, 5128865.36767282, SpatialReferences.WebMercator));
                // Create the map.                MyMapView.Map = new Map(BasemapStyle.ArcGISStreetsNight) { InitialViewpoint = _startingViewpoint };
                // NOTE: This layer supports any ArcGIS Feature Table that define subtypes.                SubtypeFeatureLayer subtypeFeatureLayer = new SubtypeFeatureLayer(new ServiceFeatureTable(new Uri("https://sampleserver7.arcgisonline.com/server/rest/services/UtilityNetwork/NapervilleElectric/FeatureServer/0")));                MyMapView.Map.OperationalLayers.Add(subtypeFeatureLayer);
                // Select sublayer to control.                await subtypeFeatureLayer.LoadAsync();
                // Select the sublayer of street lights by name.                _sublayer = subtypeFeatureLayer.GetSublayerBySubtypeName("Street Light");
                // Create a text symbol for styling the sublayer label definition.                TextSymbol textSymbol = new TextSymbol                {                    Size = 12,                    OutlineColor = Color.White,                    Color = Color.Blue,                    HaloColor = Color.White,                    HaloWidth = 3,                };
                // Create a label definition with a simple label expression.                LabelExpression simpleLabelExpression = new SimpleLabelExpression("[nominalvoltage]");                LabelDefinition labelDefinition = new LabelDefinition(simpleLabelExpression, textSymbol)                {                    Placement = Esri.ArcGISRuntime.ArcGISServices.LabelingPlacement.PointAboveRight,                    UseCodedValues = true,                };
                // Add the label definition to the sublayer.                _sublayer.LabelDefinitions.Add(labelDefinition);
                // Enable labels for the sub layer.                _sublayer.LabelsEnabled = true;
                // Set the data context for data-binding in XAML.                SublayerInfo.DataContext = _sublayer;
                // Get the default renderer for the sublayer.                _defaultRenderer = Renderer.FromJson(_sublayer.Renderer.ToJson());
                // Create a custom renderer for the sublayer.                _customRenderer = new SimpleRenderer()                {                    Symbol = new SimpleMarkerSymbol()                    {                        Color = Color.Salmon,                        Style = SimpleMarkerSymbolStyle.Diamond,                        Size = 20,                    }                };
                // Set a default minimum scale.                _sublayer.MinScale = 3000;            }            catch (Exception ex)            {                MessageBox.Show(ex.Message, ex.GetType().Name, MessageBoxButton.OK, MessageBoxImage.Error);            }        }
        private void OnChangeRenderer(object sender, RoutedEventArgs e)        {            // Check if the current renderer is the custom renderer.            if (_sublayer.Renderer == _customRenderer)            {                _sublayer.Renderer = _defaultRenderer;            }            else            {                _sublayer.Renderer = _customRenderer;            }        }
private void OnSetMinimumScale(object sender, RoutedEventArgs e) { // Set the minimum scale of the sublayer. // NOTE: You may also update Sublayer.MaxScale _sublayer.MinScale = MyMapView.MapScale; } }}<UserControl x:Class="ArcGIS.WPF.Samples.DisplaySubtypeFeatureLayer.DisplaySubtypeFeatureLayer" xmlns="http://schemas.microsoft.com/winfx/2006/xaml/presentation" xmlns:x="http://schemas.microsoft.com/winfx/2006/xaml" xmlns:esri="http://schemas.esri.com/arcgis/runtime/2013"> <Grid> <esri:MapView x:Name="MyMapView" /> <Border x:Name="SublayerInfo" HorizontalAlignment="Right" VerticalAlignment="Top" Style="{StaticResource BorderStyle}"> <Grid> <Grid.ColumnDefinitions> <ColumnDefinition Width="Auto" /> <ColumnDefinition Width="*" /> </Grid.ColumnDefinitions> <Grid.RowDefinitions> <RowDefinition Height="Auto" /> <RowDefinition Height="Auto" /> <RowDefinition Height="Auto" /> <RowDefinition Height="Auto" /> </Grid.RowDefinitions> <TextBlock Grid.ColumnSpan="2" Margin="5"> <Run Text="Current Map Scale: " /> <Run Text="1:" /> <Run Text="{Binding ElementName=MyMapView, Path=MapScale, Mode=OneWay, StringFormat=n0}" /></TextBlock> <CheckBox Grid.Row="2" Margin="5" Content="Sublayer visible" IsChecked="{Binding IsVisible, Mode=TwoWay}" /> <Button Grid.Row="2" Grid.Column="1" Margin="5" Click="OnChangeRenderer" Content="Change renderer" /> <TextBlock Grid.Row="3" Margin="5"> <Run Text="Sublayer min scale: " /> <Run Text="1:" /> <Run Text="{Binding MinScale, Mode=OneWay, StringFormat=n0}" /></TextBlock> <Button Grid.Row="3" Grid.Column="1" Margin="5" Click="OnSetMinimumScale" Content="Set min scale" /> </Grid> </Border> </Grid></UserControl>