Display a time-enabled feature layer with a time offset.
Use case
You can use a time offset to compare time periods by displaying them overlaid on the map. For example, you could show a feature layer with flu cases from December overlaid with flu cases from January to visualize the spread of the disease over time.
How to use the sample
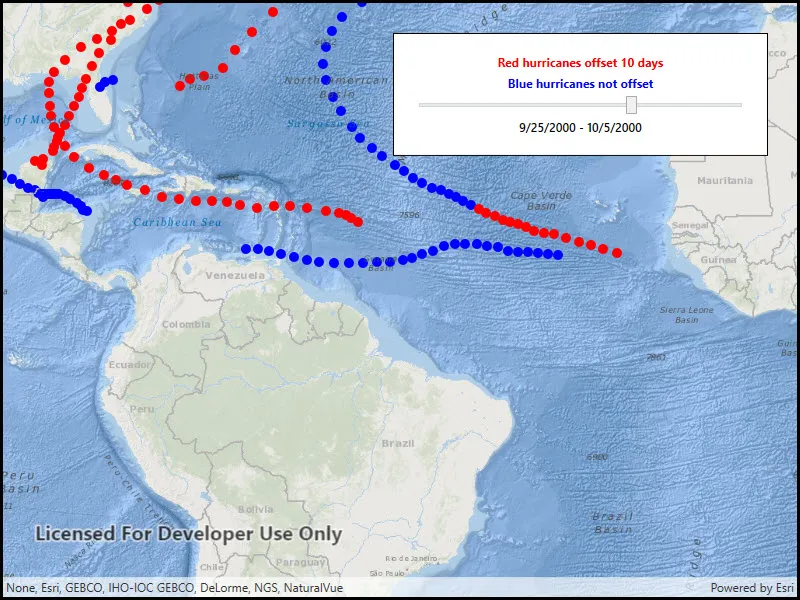
When the sample loads, you’ll see hurricane tracks visualized in red and blue. The red hurricane tracks occurred 10 days before the tracks displayed in blue. Adjust the slider to move the interval to visualize how storms progress over time.
How it works
- Create a feature layer for displaying the non-offset features and apply symbology to it.
- Create a second feature layer referring to the same service. Apply a 10 day time offset and unique symbology. Features displayed from this layer will have time values 10 days earlier than the values in the non-offset layer.
- Apply a 10-day time extent to the map view, starting at the beginning of the data range.
- When the user adjusts the slider, move the time extent. Both feature layers will filter their content for the map view’s time extent.
Relevant API
- FeatureLayer
- MapView
- TimeExtent
About the data
The sample uses a time-enabled feature service depicting hurricanes in the year 2000.
Tags
change, range, time, time extent, time offset, time-aware, time-enabled
Sample code
// Copyright 2017 Esri.//// Licensed under the Apache License, Version 2.0 (the "License"); you may not use this file except in compliance with the License.// You may obtain a copy of the License at: http://www.apache.org/licenses/LICENSE-2.0//// Unless required by applicable law or agreed to in writing, software distributed under the License is distributed on an// "AS IS" BASIS, WITHOUT WARRANTIES OR CONDITIONS OF ANY KIND, either express or implied. See the License for the specific// language governing permissions and limitations under the License.
using Esri.ArcGISRuntime;using Esri.ArcGISRuntime.Mapping;using Esri.ArcGISRuntime.Symbology;using System;using System.Threading.Tasks;using System.Windows;
namespace ArcGIS.WPF.Samples.FeatureLayerTimeOffset{    [ArcGIS.Samples.Shared.Attributes.Sample(        name: "Feature layer time offset",        category: "MapView",        description: "Display a time-enabled feature layer with a time offset.",        instructions: "When the sample loads, you'll see hurricane tracks visualized in red and blue. The red hurricane tracks occurred 10 days before the tracks displayed in blue. Adjust the slider to move the interval to visualize how storms progress over time.",        tags: new[] { "change", "range", "time", "time extent", "time offset", "time-aware", "time-enabled" })]    public partial class FeatureLayerTimeOffset    {        // Hold the feature layer URI        private Uri _featureLayerUri = new Uri("https://sampleserver6.arcgisonline.com/arcgis/rest/services/Hurricanes/MapServer/0");
        // Hold a reference to the original time extent        private TimeExtent _originalExtent;
        public FeatureLayerTimeOffset()        {            InitializeComponent();
            // Create the UI, setup the control references and execute initialization            _ = Initialize();        }
        private async Task Initialize()        {            // Create new Map            Map myMap = new Map(BasemapStyle.ArcGISOceans);
            // Create the hurricanes feature layer once            FeatureLayer noOffsetLayer = new FeatureLayer(_featureLayerUri);
            // Apply a blue dot renderer to distinguish hurricanes without offsets            SimpleMarkerSymbol blueDot = new SimpleMarkerSymbol(SimpleMarkerSymbolStyle.Circle, System.Drawing.Color.Blue, 10);            noOffsetLayer.Renderer = new SimpleRenderer(blueDot);
            // Add the non-offset layer to the map            myMap.OperationalLayers.Add(noOffsetLayer);
            // Create the offset hurricanes feature layer            FeatureLayer withOffsetLayer = new FeatureLayer(_featureLayerUri);
            // Apply a red dot renderer to distinguish these hurricanes from the non-offset hurricanes            SimpleMarkerSymbol redDot = new SimpleMarkerSymbol(SimpleMarkerSymbolStyle.Circle, System.Drawing.Color.Red, 10);            withOffsetLayer.Renderer = new SimpleRenderer(redDot);
            // Apply the time offset (red hurricane dots will be from 10 days before the current extent)            withOffsetLayer.TimeOffset = new TimeValue(10, Esri.ArcGISRuntime.ArcGISServices.TimeUnit.Days);
            // Add the layer to the map            myMap.OperationalLayers.Add(withOffsetLayer);
            // Apply the Map to the MapView            MyMapView.Map = myMap;
            try            {                // Ensure the no offset layer is loaded                await noOffsetLayer.LoadAsync();
                // Store a reference to the original time extent                _originalExtent = noOffsetLayer.FullTimeExtent;
                // Update the time extent set on the map                UpdateTimeExtent();            }            catch (Exception e)            {                MessageBox.Show(e.ToString(), "Error");            }        }
        private void MyTimeSlider_ValueChanged(object sender, System.Windows.RoutedPropertyChangedEventArgs<double> e)        {            UpdateTimeExtent();        }
        private void UpdateTimeExtent()        {            // Get the value of the slider            double value = MyTimeSlider.Value;
            // Calculate the number of days that value corresponds to            // 1. Get the interval            TimeSpan interval = _originalExtent.EndTime - _originalExtent.StartTime;
            // 2. Store the interval as days            double days = interval.TotalDays;
            // 3. Scale the interval by the value from the slider            double desiredInterval = value * days;
            // 4. Create a new TimeSpan            TimeSpan newOffset = new TimeSpan((int)desiredInterval, 0, 0, 0);
            // Determine the new starting offset            DateTime newStart = _originalExtent.StartTime.DateTime.Add(newOffset);
            // Determine the new ending offset            DateTime newEnd = newStart.AddDays(10);
            // Reset the new DateTimeOffset if it is outside of the extent            if (newEnd > _originalExtent.EndTime)            {                newEnd = _originalExtent.EndTime.DateTime;            }
            // Do nothing if out of bounds            if (newEnd < newStart) { return; }
            // Apply the new extent            MyMapView.TimeExtent = new TimeExtent(newStart, newEnd);
// Update the label CurrentDateLabel.Text = string.Format("{0} - {1}", newStart.ToShortDateString(), newEnd.ToShortDateString()); } }}<UserControl x:Class="ArcGIS.WPF.Samples.FeatureLayerTimeOffset.FeatureLayerTimeOffset" xmlns="http://schemas.microsoft.com/winfx/2006/xaml/presentation" xmlns:x="http://schemas.microsoft.com/winfx/2006/xaml" xmlns:esri="http://schemas.esri.com/arcgis/runtime/2013"> <Grid> <esri:MapView x:Name="MyMapView" /> <Border Style="{StaticResource BorderStyle}"> <StackPanel> <TextBlock Margin="0" HorizontalAlignment="Center" FontWeight="Bold" Foreground="Red" Text="Red hurricanes offset 10 days" /> <TextBlock Margin="0,5,0,0" HorizontalAlignment="Center" FontWeight="Bold" Foreground="Blue" Text="Blue hurricanes not offset" /> <Slider x:Name="MyTimeSlider" Margin="0,5,0,0" IsMoveToPointEnabled="True" Maximum="1" Minimum="0" ValueChanged="MyTimeSlider_ValueChanged" /> <TextBlock x:Name="CurrentDateLabel" Margin="0,5,0,0" FontWeight="SemiBold" TextAlignment="Center" /> </StackPanel> </Border> </Grid></UserControl>