The time slider provides controls that allow you to visualize temporal data by applying a specific time extent to a map view.
Use case
When viewing feature layers that contain a large amount of data with timestamps, you may want to filter the data to only show data relevant to a specific time range. This can help visualize changes in the data over time and aids in making better interpretations and predictions of future trends.
How to use the sample
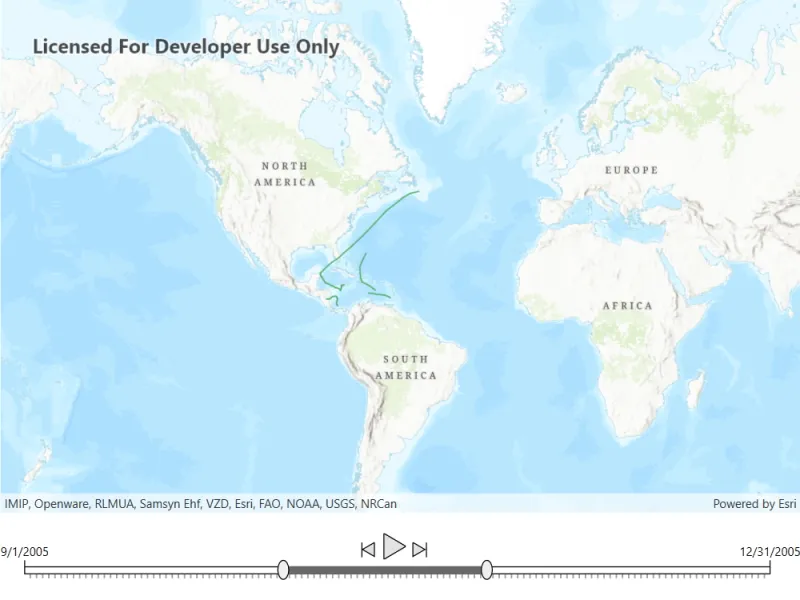
Use the slider at the bottom of the map to customize the date range for which you want to view the data. The date for the hurricanes sample data ranges from September 1st, 2005 to December 31st, 2005. Once the start and end dates have been selected, the map view will update to only show the relevant data that falls in the time extent selected. Use the play button to step through the data one day at a time. Use the previous and next buttons to go back and forth in 2 day increments as demonstrated below.
How it works
- Create a
MapViewwith aMap, and add layers that have time-enabled data. - Create a
TimeSliderfrom the ArcGIS Maps SDK for .NET Toolkit to allow users to show data only from the given date range. - Call
TimeSlider.InitializeTimePropertiesAsyncto initialize the full extent and time intervals of theTimeSliderbased on the time-awareFeaturelayer. - Create a
TimeSlider.CurrentExtentChangedevent handler to update theMapViewwhen theTimeSliderextent changes.
Relevant API
- FeatureLayer
- Map
- MapView
- ServiceFeatureTable
Additional information
This sample uses Atlantic hurricane data from the National Hurricane Center (NOAA / National Weather Service) and the TimeSlider toolkit component which requires the toolkit to be cloned and set up locally. For information about setting up the toolkit, see the repository’s root README.md here.
Tags
animate, data, filter, time, time extent, time frame, toolkit
Sample code
// Copyright 2022 Esri.//// Licensed under the Apache License, Version 2.0 (the "License"); you may not use this file except in compliance with the License.// You may obtain a copy of the License at: http://www.apache.org/licenses/LICENSE-2.0//// Unless required by applicable law or agreed to in writing, software distributed under the License is distributed on an// "AS IS" BASIS, WITHOUT WARRANTIES OR CONDITIONS OF ANY KIND, either express or implied. See the License for the specific// language governing permissions and limitations under the License.
using Esri.ArcGISRuntime.Data;using Esri.ArcGISRuntime.Mapping;using Esri.ArcGISRuntime.Toolkit.UI;using System;using System.Threading.Tasks;
namespace ArcGIS.WPF.Samples.FilterByTimeExtent{    [ArcGIS.Samples.Shared.Attributes.Sample(        name: "Filter by time extent",        category: "MapView",        description: "The time slider provides controls that allow you to visualize temporal data by applying a specific time extent to a map view.",        instructions: "Use the slider at the bottom of the map to customize the date range for which you want to view the data. The date for the hurricanes sample data ranges from September 1st, 2005 to December 31st, 2005. Once the start and end dates have been selected, the map view will update to only show the relevant data that falls in the time extent selected. Use the play button to step through the data one day at a time. Use the previous and next buttons to go back and forth in 2 day increments as demonstrated below.",        tags: new[] { "animate", "data", "filter", "time", "time extent", "time frame", "toolkit" })]    public partial class FilterByTimeExtent    {        // URL to the feature service.        private const string FeatureServiceUrl = "https://services5.arcgis.com/N82JbI5EYtAkuUKU/ArcGIS/rest/services/Hurricane_time_enabled_layer_2005_1_day/FeatureServer/0";
        // Hold a reference to the feature table.        private ServiceFeatureTable _featureTable;
        public FilterByTimeExtent()        {            InitializeComponent();            _ = Initialize();        }
        private async Task Initialize()        {            // Create the map.            MyMapView.Map = new Map(BasemapStyle.ArcGISTopographic);
            // Set the initial map location.            MyMapView.SetViewpoint(new Viewpoint(29.979774, -58.495293, 150000000));
            // Create the feature table, referring to the feature service.            _featureTable = new ServiceFeatureTable(new Uri(FeatureServiceUrl));
            // Create a feature layer to visualize the features in the table.            FeatureLayer featureLayer = new FeatureLayer(_featureTable);
            // Add the layer to the map.            MyMapView.Map.OperationalLayers.Add(featureLayer);
            // Initialize time slider properties, including full extent and time intervals, based on the feature layer.            await MyTimeSlider.InitializeTimePropertiesAsync(featureLayer);        }
private void TimeSlider_CurrentExtentChanged(object sender, TimeExtentChangedEventArgs e) { // Update the time extent on the map view. MyMapView.TimeExtent = e.NewExtent; } }}<UserControl x:Class="ArcGIS.WPF.Samples.FilterByTimeExtent.FilterByTimeExtent" xmlns="http://schemas.microsoft.com/winfx/2006/xaml/presentation" xmlns:x="http://schemas.microsoft.com/winfx/2006/xaml" xmlns:esri="http://schemas.esri.com/arcgis/runtime/2013"> <Grid> <Grid.RowDefinitions> <RowDefinition Height="*" /> <RowDefinition Height="auto" /> </Grid.RowDefinitions> <esri:MapView x:Name="MyMapView" Grid.Row="0" /> <esri:TimeSlider x:Name="MyTimeSlider" Grid.Row="1" MaxWidth="800" Margin="0,20" CurrentExtentChanged="TimeSlider_CurrentExtentChanged" /> </Grid></UserControl>