Query a feature table to get statistics for one or more specified fields. The sample queries a service feature table of US states to get the selected statistics. The results can be grouped and sorted using one or several fields in the table.
Use case
You can use statistical queries, grouping and sorting to process large amounts of data saved in feature tables. This is helpful for identifying trends and relationships within the data, which can be used to support further interpretations and decisions. For example, a health agency can use information on medical conditions occurring throughout a country to identify at-risk areas or demographics, and decide on further action and preventive measures.
How to use the sample
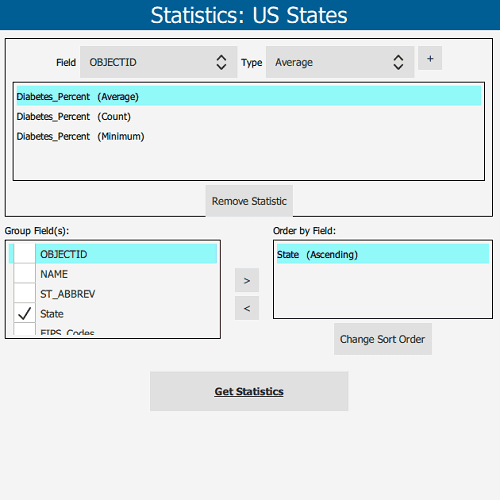
The sample will start with some default options selected. You can immediately click the "Get Statistics" button to see the results for these options. There are several ways to customize your queries:
-
You can add statistic definitions to the top-left table using the combo boxes and "Add" button. Select a table row and click "Remove" to remove a definition.
-
To change the Group-by fields, check the box by the field you want to group by in the bottom-left list view.
-
To change the Order-by fields, select a Group-by field (it must be checked) and click the ">>" button to add it to the Order-by table. To remove a field from the Order-by table, select it and click the "<<" button. To change the sort order of the Order-by field, the cells of the "Sort Order" column are combo-boxes that may be either ASCENDING or DESCENDING.
How it works
- Create a
ServiceFeatureTableusing theURLof a feature service and load the table. - Get the feature tables field names list with
featureTable.fields. - Create
StatisticDefinitions specifying the field to compute statistics on and theStatisticTypeto compute. - Create
StatisticsQueryParameterspassing in the list of statistic definitions. - To have the results grouped by fields, add the field names to the query parameters'
groupByFieldNamescollection. - To have the results ordered by fields, create
OrderBys, specifying the field name andSortOrder. Pass theseOrderBys to the parameters'orderByFieldscollection. - To execute the query, call
featureTable.queryStatistics(queryParameters). - Get the
StatisticQueryResult. From this, you can get an iterator ofStatisticRecords to loop through and display.
About the data
This sample uses a Diabetes, Obesity, and Inactivity by US County feature layer hosted on ArcGIS Online.
Relevant API
- Field
- OrderBy
- QueryParameters
- ServiceFeatureTable
- StatisticDefinition
- StatisticRecord
- StatisticsQueryParameters
- StatisticsQueryResult
- StatisticType
Tags
correlation, data, fields, filter, group, sort, statistics, table
Sample Code
// [WriteFile Name=StatisticalQueryGroupSort, Category=Analysis]
// [Legal]
// Copyright 2017 Esri.
// Licensed under the Apache License, Version 2.0 (the "License");
// you may not use this file except in compliance with the License.
// You may obtain a copy of the License at
// http://www.apache.org/licenses/LICENSE-2.0
// Unless required by applicable law or agreed to in writing, software
// distributed under the License is distributed on an "AS IS" BASIS,
// WITHOUT WARRANTIES OR CONDITIONS OF ANY KIND, either express or implied.
// See the License for the specific language governing permissions and
// limitations under the License.
// [Legal]
import QtQuick
import QtQuick.Controls
import Esri.ArcGISRuntime
Rectangle {
id: rootRectangle
clip: true
width: 800
height: 600
ServiceFeatureTable {
id: censusTable
url: "https://services.arcgis.com/jIL9msH9OI208GCb/arcgis/rest/services/Counties_Obesity_Inactivity_Diabetes_2013/FeatureServer/0"
Component.onCompleted: load();
onLoadStatusChanged: {
if (loadStatus !== Enums.LoadStatusLoaded)
return;
const fieldModel = [];
for (let i = 0; i < fields.length; i++) {
fieldModel.push(fields[i].name);
}
statisticOptionsPage.fields = fieldModel;
}
onQueryStatisticsStatusChanged: {
if (queryStatisticsStatus === Enums.TaskStatusErrored) {
resultsModel.clear();
resultsModel.append({"section": "", "statistic": "Error. %1".arg(error.message)});
return;
}
if (queryStatisticsStatus !== Enums.TaskStatusCompleted)
return;
// reset the model and check the results
resultsModel.clear();
if (!queryStatisticsResult) {
resultsModel.append({"section": "", "statistic": "Error. %1".arg(error.message)});
return;
}
// iterate the results and add to a model
const iter = queryStatisticsResult.iterator;
while (iter.hasNext) {
const record = iter.next();
const sectionString = JSON.stringify(record.group).replace("{","").replace("}","");
for (let statKey in record.statistics) {
if (record.statistics.hasOwnProperty(statKey)) {
const result = {
"section" : sectionString,
"statistic" : statKey + ": " + record.statistics[statKey]
};
resultsModel.append(result)
}
}
}
}
}
StackView {
id: stackView
anchors.fill: parent
// Initial page is the OptionsPage
initialItem: OptionsPage {
id: statisticOptionsPage
onStatisticButtonClicked: {
// create the parameter object
const params = ArcGISRuntimeEnvironment.createObject("StatisticsQueryParameters");
// add the statistic definition objects
const statisticDefinitions = [];
for (let i = 0; i < statisticsModel.count; i++) {
const statistic = statisticsModel.get(i);
const definition = ArcGISRuntimeEnvironment.createObject("StatisticDefinition", {
onFieldName: statistic.field,
statisticType: statisticStringToEnum(statistic.statistic)
});
statisticDefinitions.push(definition);
}
params.statisticDefinitions = statisticDefinitions;
// set the grouping fields
params.groupByFieldNames = groupingFields;
// add the order by objects
const orderBys = [];
for (let j = 0; j < orderByModel.count; j++) {
const group = orderByModel.get(j);
const orderBy = ArcGISRuntimeEnvironment.createObject("OrderBy", {
fieldName: group.field,
sortOrder: orderStringToEnum(group.order)
});
orderBys.push(orderBy);
}
params.orderByFields = orderBys;
// ignore counties with missing data
params.whereClause = "\"State\" IS NOT NULL";
// execute the query
censusTable.queryStatistics(params);
// show the results page
stackView.push(resultsPage);
}
}
// The ResultsPage is shown when a query is executed
ResultsPage {
id: resultsPage
width: parent.width
height: parent.height
statisticResult: resultsModel
onBackClicked: stackView.pop();
}
}
// helper to convert from statistic type string to enum
function statisticStringToEnum(statString) {
switch(statString) {
default:
case "Average":
return Enums.StatisticTypeAverage;
case "Count":
return Enums.StatisticTypeCount;
case "Maximum":
return Enums.StatisticTypeMaximum;
case "Minimum":
return Enums.StatisticTypeMinimum;
case "Standard Deviation":
return Enums.StatisticTypeStandardDeviation;
case "Sum":
return Enums.StatisticTypeSum;
case "Variance":
return Enums.StatisticTypeVariance;
}
}
// helper to convert from sort order string to enum
function orderStringToEnum(orderString) {
switch(orderString) {
default:
case "Ascending":
return Enums.SortOrderAscending;
case "Descending":
return Enums.SortOrderDescending;
}
}
ListModel {
id: resultsModel
}
}