
Basemap Gallery component
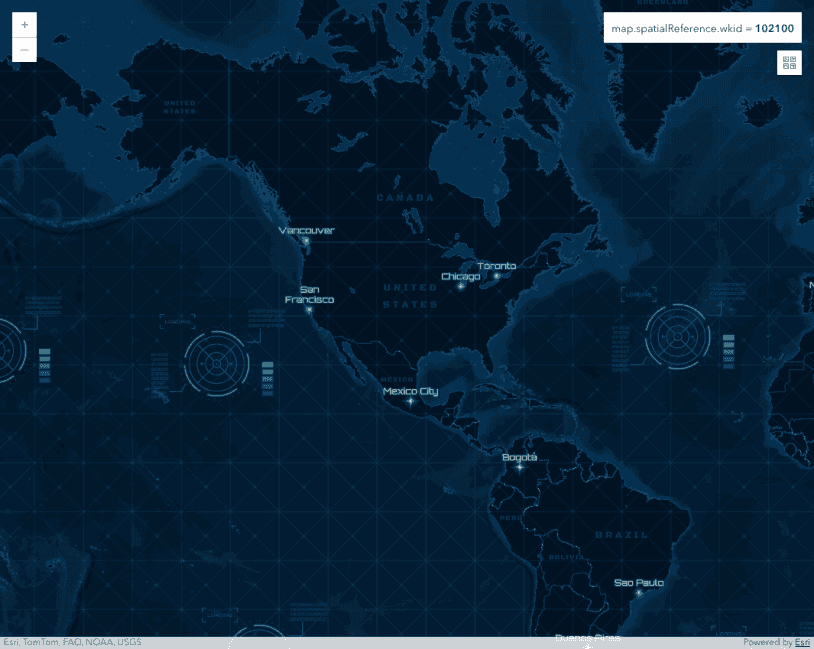
Basemaps with different projections

Edit features in 3D with the Editor component

Edit features with the Editor component

Elevation Profile component

Summarize binned data using Arcade

FlowRenderer with effects and blending

SceneLayerView - query statistics by geometry

Animate color visual variable

Dot density

Watch for changes in components

Weather component
You can also download the ArcGIS Maps SDK for JavaScript 4.34 single archive with all samples.